NAME
d.correlate - Prints a graph of the correlation between raster maps (in pairs).KEYWORDS
display, statistics, raster, diagram, correlationSYNOPSIS
d.correlate
d.correlate --helpd.correlate map=name[,name,...] [--help] [--verbose] [--quiet] [--ui]
Flags:
- --help
- Print usage summary
- --verbose
- Verbose module output
- --quiet
- Quiet module output
- --ui
- Force launching GUI dialog
Parameters:
- map=name[,name,...] [required]
- Name of raster map(s)
Table of contents
DESCRIPTION
d.correlate displays graphically the results of a r.stats analysis run on two raster map layers. This module highlights the correlation (or lack of it) among data layers (scattergram).The results are displayed in the active display frame on the user's graphics monitor. d.correlate erases the active frame before displaying results. If no graphics monitor is open, a file map.png is generated in the current directory.
NOTES
If three or four map layers are specified, the correlation among each combination of two data layers is displayed.EXAMPLE
Scatterplot of two LANDSAT TM7 channels (North Carolina sample dataset):g.region raster=lsat7_2002_30 -p d.correlate map=lsat7_2002_30,lsat7_2002_40
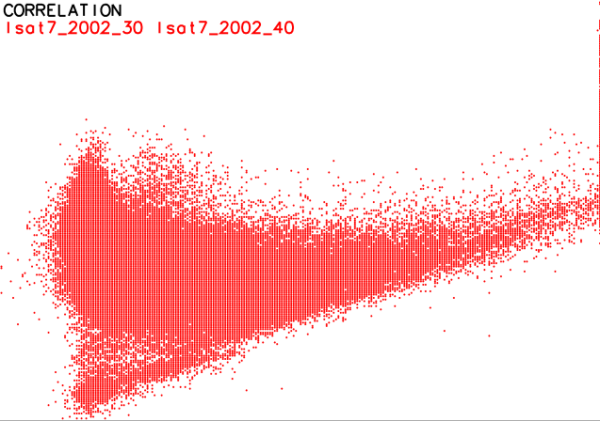
Scatterplot of two LANDSAT TM7 channels
SEE ALSO
d.text, d.graph, r.coin, r.regression.line, r.statsAUTHORS
Michael Shapiro, U.S.Army Construction Engineering Research LaboratoryRewritten to GRASS 6 (from csh to sh) by Markus Neteler; from sh to Python by Glynn Clements
SOURCE CODE
Available at: d.correlate source code (history)
Latest change: Thursday Feb 03 11:10:06 2022 in commit: 547ff44e6aecfb4c9cbf6a4717fc14e521bec0be
Main index | Display index | Topics index | Keywords index | Graphical index | Full index
© 2003-2023 GRASS Development Team, GRASS GIS 8.2.2dev Reference Manual