NAME
r.vol.dem - Creates a 3D raster model (voxels) from a series of raster DEMsKEYWORDS
raster, volume, conversionSYNOPSIS
Flags:
- -c
- Calculate 3D cell counts for each layer.
- -f
- Fill through NULL value areas in DEMs
- -g
- Export voxel model as vector points
- -p
- Export VTK point data instead of cell data
- -q
- Disable on-screen progress display
- -s
- Skip topology error checking
- -v
- Generate a .vtk file for visualisation with e.g. paraview
- -z
- Fit active region's Z range to input DEMs
- --overwrite
- Allow output files to overwrite existing files
- --help
- Print usage summary
- --verbose
- Verbose module output
- --quiet
- Quiet module output
- --ui
- Force launching GUI dialog
Parameters:
- input=name[,name,...] [required]
- Input DEMs (at least 2) in raster format. Bottom DEM first
- output=name [required]
- Name for output 3D raster map
- labels=float
- List of label values, one for each 3D layer
- colors=string
- List of RRR:GGG:BBB color triplets, one for each layer
- errormap=name
- Raster map to represent topology errors in input DEMs
- algorithm=string
- 3D flood fill algorithm to use
- Options: up, down
- Default: up
Table of contents
DESCRIPTION
r.vol.dem interpolates a voxel model from a series of DEMs by flood filling the voxel space in between. The module is able to calculate voxel maps between at least two DEMs. The algorithm is based on a so-called "Flood-filling" algorithm. Since a date, label or category number of an e.g., archaeological stratum represents always the value for the entire stratum it would be more suitable to fill the entire 3D unit with this single value.The input bottom and top DEMs represent each the bottom and top border for the "voxeled" stratum, in this case the implicit structure. Before running the r.vol.dem module, one needs to adjust the three-dimensional extent of the 3D interpolation which works as an analytical mask in the GRASS GIS module g.region. This procedure adjusts additionally the voxel's size which influences the 3D resolution of the entire stratum. Furthermore, it is possible to adjust the height and width of the voxel in order to obtain a cube or cuboid voxel shape. In general, the smaller the voxel's size the higher the resolution, the more precise 3D units.
NOTES
The input data for the 3D interpolation which requires at least two raster DEMs. They have to be entered in a certain rank, with the lowest, according to elevation, DEM first.The list of label values is one for each 3D layer (labels=value): Since one can enter an infinite number of DEMs it is possible adjust certain labels for each 3D layer. If they are not specified, labelling starts with layer 0. The numbers are given always upwards disregarding the algorithm direction.
The errormap raster map is to represent topology errors in input DEMs. This option does not yet create a real map but gives the coordinates where intersections of DEMs occur.
The algorithm parameter is used to select the 3D flood fill algorithm to use. The user can chose between an up or down filling direction. The default adjustment is the upwards algorithm. The results can become very different according to the shape and extension of the DEMs.
The -c flag calculates 3D cell counts for each layer: This option counts the number of voxels for each 3D layer label. Unfortunately, this count is not stored in the r3.info information. Thus, if one needs this information afterwards, one has to repeat the whole calculation.
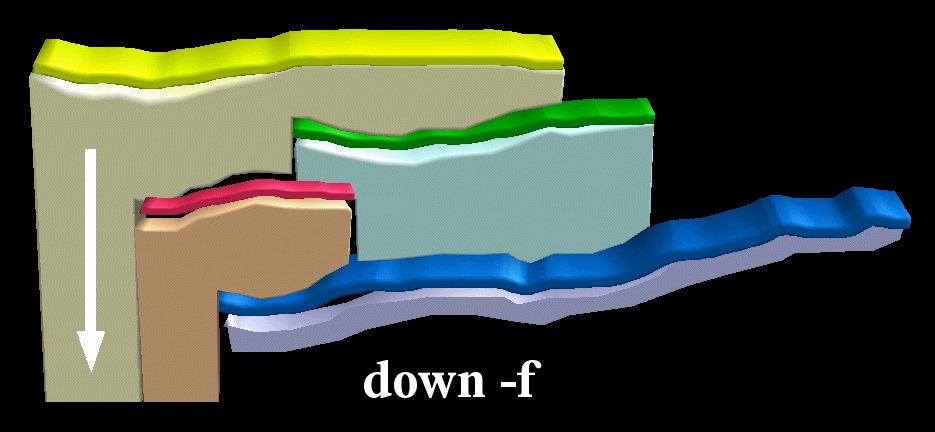
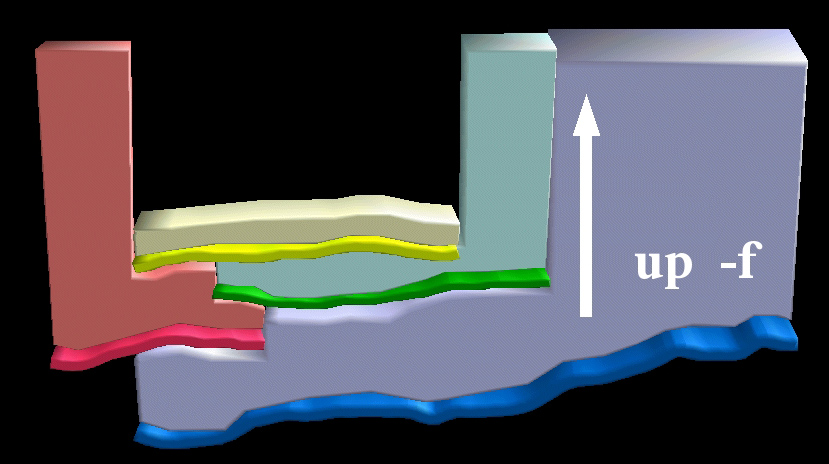
The -f flag fills through NULL value areas in DEMs: Null value areas are areas which lie outside a 3D layer defined by two successive DEMs in the input command. In the case, where a 3D layer is limited not only from one unit surface, e.g. on top, this flag allows a further 3D interpolation until the next DEM or the region's margin.

Layer down NULL filling behaviour of r.vol.dem

Layer up NULL filling behaviour of r.vol.dem
The -g flag exports voxel model as vector points: This option creates a vector point for each interpolated voxel. This became necessary because of the lack of suitable representation in the visualisation module nivz in GRASS GIS 6. Nevertheless, the points can be represented virtually as cubes in nviz which gives an idea of the voxel layer. Unfortunately, there is still an error in the module using this flag (state 01.06.2006) that can be corrected by the following procedure: The module r.vol.dem creates a temporary txt-file in the HOME directory. Opening this file one will find a line which starts with "# v.in.ascii". This line needs to be copied without the #-sign and executed in the GRASS bash shell.
The -p flag exports VTK point data instead of cell data: This option reflects the fact that the visualisation program ParaView which treats cell data and point data differently in comparison to the program GRASS GIS. Hence, if one wants to visualise GRASS voxel in ParaView, this flag is recommended. The VTK floating point precision is 1/1000 of the current GRASS location's map unit.
The -q flag disables on-screen progress display: This option does not yet work.
The -s flag skips topology error checking: The module checks the input DEMs for intersection before running the algorithm. If such an unwanted intersection is found, the algorithm creates an errormap (see errormap option) and stops the entire 3D interpolation process. Using this flag one can skip this precaution.
The -v flag generates a vtk-file for visualisation with e.g. ParaView: Since the GRASS visualisation module nviz is unable to show voxel as (semitransparent) cubes, the Open Source visualisation program ParaView is now commonly used for the visualisation of GRASS GIS maps and especially for 3D visualisations. Hence, the output GRASS GIS files have to be converted into a ParaView readable format.
The -z flag fits active region's z range to input DEMs: This option does not yet work.
EXAMPLE
tbd
SEE ALSO
g.region, r.to.rast3, r.to.rast3elevAUTHORS
Software: Benjamin DuckeDocumentation: Undine Lieberwirth
SOURCE CODE
Available at: r.vol.dem source code (history)
Latest change: Monday Jan 30 19:52:26 2023 in commit: cac8d9d848299297977d1315b7e90cc3f7698730
Main index | Raster index | Topics index | Keywords index | Graphical index | Full index
© 2003-2023 GRASS Development Team, GRASS GIS 8.2.2dev Reference Manual