Note: This document is for an older version of GRASS GIS that will be discontinued soon. You should upgrade, and read the current manual page.
NAME
g.gui.timeline - Allows comparing temporal datasets by displaying their temporal extents in a plot.KEYWORDS
general, GUI, temporal, plotSYNOPSIS
g.gui.timeline
g.gui.timeline --helpg.gui.timeline [-3] [inputs=name[,name,...]] [--help] [--verbose] [--quiet] [--ui]
Flags:
- -3
- Show also 3D plot of spatio-temporal extents
- --help
- Print usage summary
- --verbose
- Verbose module output
- --quiet
- Quiet module output
- --ui
- Force launching GUI dialog
Parameters:
- inputs=name[,name,...]
- Name of the input space time datasets
Table of contents
DESCRIPTION
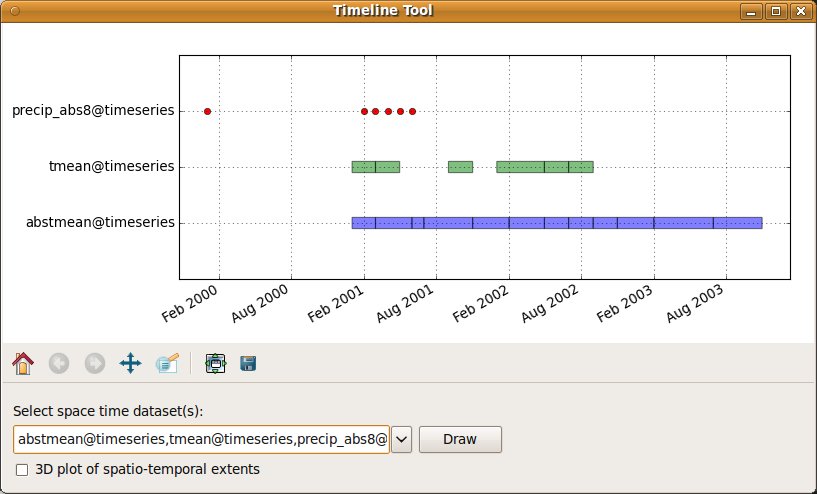
The Timeline Tool is a wxGUI component which allows the user to compare the extents of temporal datasets (strds, stvds, str3ds) in a plot.Supported features:
- temporal datasets with interval/point and absolute/relative time
- 2D plots - temporal extent
- 3D plots - spatio-temporal extent (matplotlib >= 1.0.0)
- pop-up annotations with basic metadata
NOTES
g.gui.timeline requires the Python plotting library Matplotlib.SEE ALSO
Temporal data processingwxGUI
wxGUI components
AUTHOR
Anna Kratochvilova, Czech Technical University in Prague, Czech RepublicSOURCE CODE
Available at: wxGUI Timeline Tool source code (history)
Latest change: Sat Jul 16 18:18:43 2022 in commit: effc544b795cef89a0c38628eee513eca82c266e
Note: This document is for an older version of GRASS GIS that will be discontinued soon. You should upgrade, and read the current manual page.
Main index | GUI index | Topics index | Keywords index | Graphical index | Full index
© 2003-2023 GRASS Development Team, GRASS GIS 7.8.8dev Reference Manual