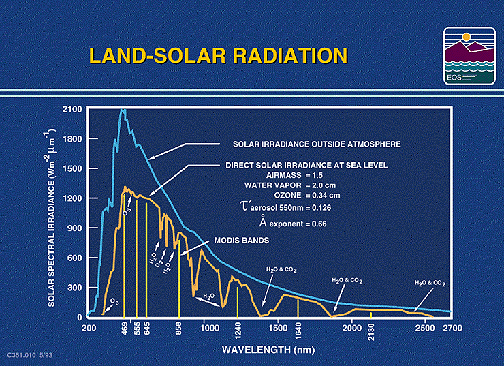
The amount of solar radiation
reflected from land and sea surfaces, as well as the amount absorbed, depends
partly on that portion of energy from the Sun that reaches these surfaces. In
the Introduction, we stated that when we move from lower to higher wavelengths,
this radiance rises rapidly to a peak at 480 nanometers (0.48 Ám), then trails
off to near zero through wavelengths out to about 3000 nanometers (3.0 Ám).
The plot below confirms that distribution and also shows many of the principal
water, carbon dioxide, and oxygen absorption bands.

A thermal sensor detects radiant energy from a surface target, heated through radiation (solar insolation and sky radiance), convection (atmospheric circulation) and conduction (through the ground). Most sensed heat from surfaces has its origin in solar illumination, that varies with diurnal and seasonal changes, as well as cloud cover, but there is also a small, nearly constant, contribution from internal heat flux from Earth's interior (mostly from radioactive decay). Heat transfers into and out of near surface layers because of external heating by the thermal processes of conduction, convection, and radiation.
A primary objective of temperature measurements and related thermal responses is to infer something about the nature of the composition and other physical attributes of materials at the Earth's surface and, in its atmosphere. For any material, certain internal properties play important roles in governing the temperature of a body at equilibrium with its surroundings.
These properties include:
In this chart, we show
some characteristic values of these intrinsic thermal properties:
| Water | Sandy Soil | Basalt | Stainless Steel | |
|---|---|---|---|---|
| K | 0.0014 | 0.0014 | 0.0050 | 0.030 |
| c | 1.0 | 0.24 | 0.20 | 0.12 |
| d | 1.0 | 1.82 | 2.80 | 7.83 |
| P | 0.038 | 0.024 | 0.053 | 0.168 |
9-5: Of the materials in this table, which will show the largest temperature fluctuation during a 24-hr heating/cooling cycle; which the smallest? ANSWER
9-6: We give here the values (without their units; see above) for Specific Heat; Thermal Conductivity; and Density (in that order) for these three rock types: Limestone: 0.17, 0.0048, 2.5; Sandstone: 0.47, 0.0125, 2.5; Shale: 0.391, 0.0042, 2.3. Calculate the Thermal Inertia P for each type. Are the P values different enough that, assuming a gray scale from 0 to 100, they would show up as sufficiently separable gray tones (assigned to each P value) on a black and white image of a target containing these three rocks? There is also a river passing through the scene; its values are 1.00, 0.0013, 1.0; will it show up as distinctly different? ANSWER
Interpreting thermal data and images of temperature distribution over an area is complex. In many instances, we must look for patterns of relative temperature differences rather than the absolute values, because of the many complex factors that make quantitative determinations difficult, such as:
9-7: All of the above factors play a role but some are more influential in determining the radiant temperatures than others. List, in your opinion, the five most important of these. ANSWER
Some factors have fixed or constant effects, while others vary with each sensor overpass. We may possibly correct for the influence of some of the variable factors, but this is difficult to do routinely. Measurements made at isolated individual points in a scene and extrapolated to the general scene have limited validity.