|
MSS
Mosaics of the United States; Alaska; Mexico; International Mosaics and
large scenes including Afghanistan
|
Additional mosaics of the
U.S., Alaska, and regions in Europe and Asia demonstrate the value of combining
space images to present views of large segments of the Earth’s continental
surfaces. A series of images shows Afghanistan and its neighbors - the focus
of attention in the first year of the War on Terrorism.
MSS Mosaics of the United
States; Alaska; Mexico; International Mosaics and large scenes including Afghanistan
Mosaics of entire continents
or subcontinents became plausible when enough cloud-free Landsat images were acquired
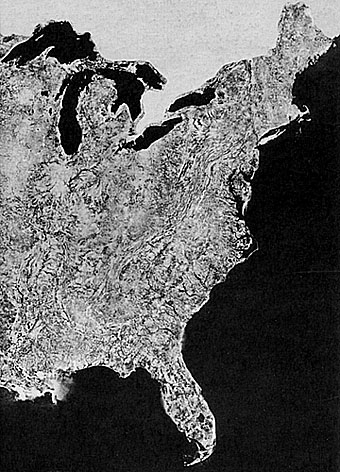
and reprocessed (to minimize tonal differences) The U.S. Department of Agriculture's
Soil Conservation Service (SCS) put together the first Landsat "image" of the
entire United States in 1974, as part of a NASA contract initiated by the writer
(NMS) and monitored by his colleague, Arthur Anderson. Using 595 Band 5 black
and white images, the result was the first higher resolution space portrait of
the 48 States (Alaska and Hawaii were also done). The original photo version was
many feet in dimension; what appears here has been greatly reduced in size, so
that much detail present in the original is lost. Appearing here is the eastern
half of the United States; the version shown is somewhat degraded because the
only copy available to the writer is the inside fly leaf of the book, Mission
to Earth.
The General Electric Company
produced the first false color rendition for NASA and the National Geographic
Society (NGS). We reproduce here a portion of the NGS Magazine's Landsat "map"
of the U.S., which was part of its Bicentennial (1976) anniversary issue, in
the natural color version.
In making this mosaic (there
is also a false color red version), GE projected the MSS Band 7 through a green
filter and Bands 4 and 5 through blue and red filters). It shows all of the
western U.S. into the Great Plains beyond Denver and the Black Hills. Blackish
areas on land are either water bodies (such as the Great Salt Lake) or vegetated
mountain slopes. Obviously, relatively little detail in the landscape is visible
at this scale (~1:11,000,000) but the impression of the overall geomorphology
and geologic structures that set the western U.S. apart is striking (more so
when the full size - 14 ft wide - is viewed. Compare this rendition with the
equivalent area in the NOAA Advanced Very High Resolution Radiometer image presented
on page 6-1.
7-8:
While this is a passably good natural color approximation, something
does not ring true. Why; what's missing?
ANSWER
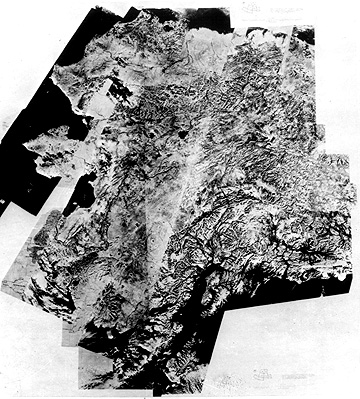
Alaska Mosaic
The first Landsat mosaic
to cover the United States was made, following a suggestion by this writer (NMS)
and then under the aegis of a colleague, Arthur Anderson, by the Soil Conservation
Service. After it was made, someone realized that the states of Hawaii and Alaska
had been overlooked. An effort to correct this soon produced the missing states.
Hawaii was easy. The Alaska mosaic was more problematic as at the time there
was a missing strip of coverage and the western Aleutians were also not covered.
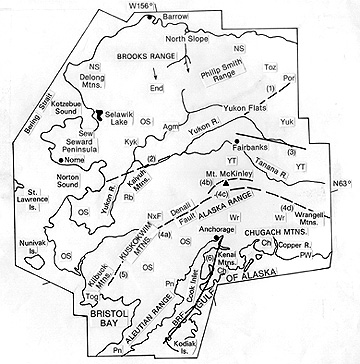
Still, the mosaic shown here is imposing; a map of its main features is placed
below it:
Notice on the map a number
of symbols, e.g., OS. These refer to the generalized locations of different
structural terranes - great blocks of crust that at different times in the distant
past crashed into that part of the North American plate (both before and after
its split from Pangaea) and thus built up the region by accretion. The concept
of terranes is discussed in much more detail in Section 17 (second half). For
now, we will just identify these terranes by name: Agm = Angayucham; Ch = Chugach;
End = Endicott; Kyk = Koyukuk; NxF = Nixon Fort; OS = Overlap Sequence; Pn =
Peninsular; Por = Porcupine; PW = Prince William; Sew = Seward; Tog = Togiak;
Toz = Tozina; Wr = Warngellia; YT = Yukon/Tinana; Yuk = Yukon. Major faults
are numbered.
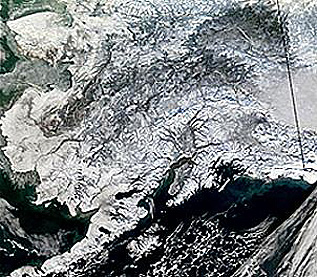
It is interesting to compare
this Landsat mosaic with a single image produced in color by the MODIS sensor
on Terra (Section 16). The image covers about 2/3rds of the main part of the
state. Try to locate some of the features and terranes listed above in this
image:
7-9:
Why does the MODIS image appear so different from the Landsat mosaic? ANSWER
One of the big three cities
in Alaska is Anchorate (the others: Juneau [the capital] and Fairbanks). Locate
it in the map above. Here is a SIR-C view:
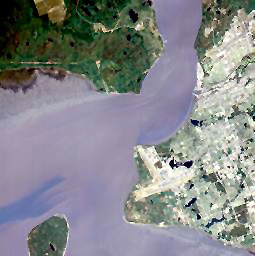
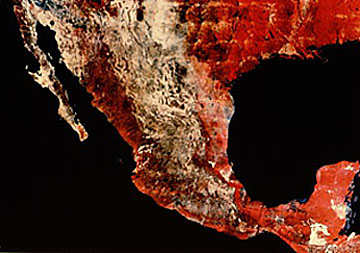
Mosaic of Mexico
A standard false color
mosaic of Mexico, extending into parts of the southern United States, appears
thusly:
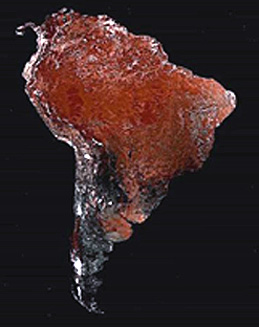
South America
Mosaics have now been produced
for entire continents. North America has been constructed from Landsat images,
and several images of the United States appear in this Tutorial. Using AVHRR data
(see page 14-2), all
of South America has been mosaicked; the Andes and the Amazon in particular stand
out:
7-10:
Can you pick out the general regions in this mosaic that correspond
to the Amazon rain forest; how did you do this?
ANSWER
Color Mosaic of Southern
Europe: The Alps
Another magnificent mosaic,
made as a variant of true color, shows the entire Alps (Alpine Mountain Chain)
across southern Europe, including all of Switzerland and Austria, and parts
of eastern France, southern Germany, Czechoslovakia, Slovenia, Croatia, and
northern Italy. Westermann Satellite Maps prepared this mosaic, which, shortly
after its production, became a standard aid for teaching geography to students
in many European countries.
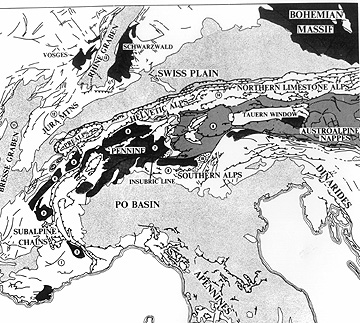
Below is a schematic map
that shows most of the same area as in the Alps mosaic; this map defines the
geologic/geomorphic segments of the Alps as well as for adjacent terrains. Try
to match the main units to their topographic expression in the mosaic.
7-11:
Locate the Apennines on the mosaic, using the map. Develop a single
item argument that supports this statement: The Apennines are not nearly as
high as the Alps? ANSWER
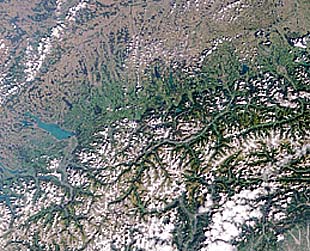
While we are focussed on
the Alps, compare this next scene, made by the MISR sensor on Terra, of a part
of the Alps (fit it in to the above mosaic).
The Antarctic and the
Arctic
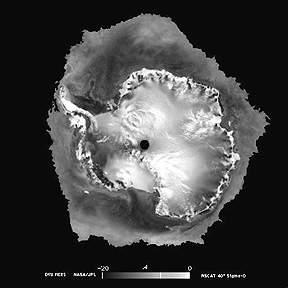
The entire Antarctic continent
and surrounding ice shelves has been imaged from sets of radar images acquired
over six days in September of 1996 by the NASA Scatterometer (NSCAT), as shown
below, with the South Pole appearing as a drawn-in black dot:
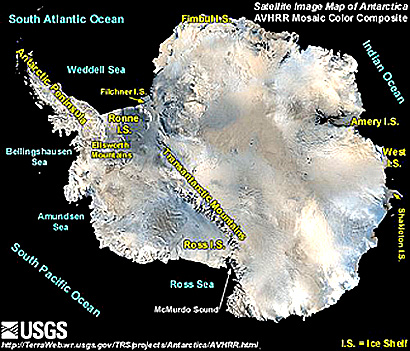
This whole continent, about
the size of the U.S. and Canada combined, has been imaged in color by specially
processing AVHRR scenes acquired by meteorological satellites. This mosaicked
version, produced by Pat Chavez's image processiong group at the U.S. Geological
Survey, is shown here in its annotated form:
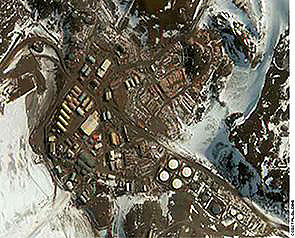
Turning to the other extreme,
here is a very high resolution (2.4 m) of the U.S. Antarctic Research Base at
McMurdo Sound (bottom center of the above mosaic) as imaged by the QuickBird satellite
(see Overview):
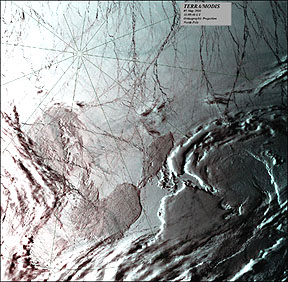
The MODIS instrument on
Terra (page 16-9) has obtained
a view of the North Pole (in the image below the longitudinal lines converging
at it are added artificially), even though it does not pass directly over it
(in the image below it has looked slightly sidewards). The polar Arctic is not
a land mass but a sea covered with ice. While the scene roughly resembles the
ice sheet covering central Antarctica, the give-away that the Arctic has sea
ice is the sets of leads (fractures) that result from ice cover breakup and
movement.
Mosaics of Iran, Pakistan,
India, and Afghanistan
We look next at one of the most sensational mosaics yet made from Landsat images,
assembled by R.D. Lawrence and R.O. Rogers of the Geology Department at Oregon
State University.
The region displayed in
this black and white, red band mosaic includes nearly all of Pakistan, part
of eastern Iran and a bit of southern Afghanistan, and a smaller segment of
India, extending over about 2,100 km (1,305 mi) from west to east. We drew the
principal structural features on the locator map below.
The continuous mountain
belt starting with the east-west Makran Ranges, then the north-trending Kirthar
and Sulaiman Ranges in Pakistan, and the great bend of the Hindu Kush joining
the north-west-trending western Himalayas, is the consequence of the monstrous,
still continuing, collision of the Indian subcontinent during the last 130 million
years as it drifted north, striking the underbelly of Asia along a vast subduction
zone.
7-12:
This question is a departure into the realm of ancient history in
which the Landsat mosaic helps to show what the problems were in the events
that led to the demise of the Macedonian Alexander the Great. Maybe you know
the story; if not, consult an encyclopedia for a synopsis of his life. What
was the situation he faced, and how did the imagery help you to appreciate its
gravity? ANSWER
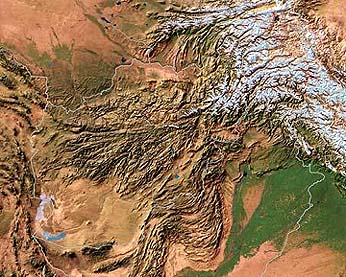
The region just to the
north of the top center of this mosaic has became famous - and infamous - to
Americans since September 11, 2001. The country of Afghanistan is in many ways
similar to Pakistan, with desert, a group of central mountains, and mountains
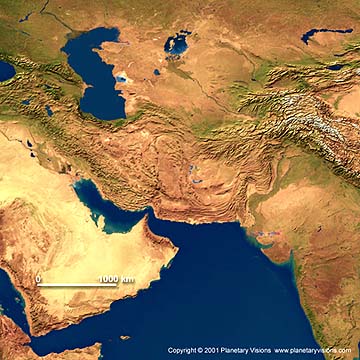
on its southeast border with Pakistan. Afghanistan lies within this 4 km resolution
metsat AVHRR image of the broad region that includes Saudi Arabia, Iran, Pakistan,
Afghanistan, and the several "Stans" such as Turkestan - once countries once
part of the Soviet Union
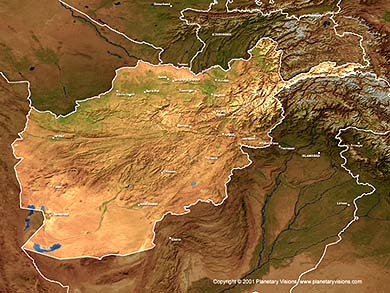
This next view zeroes in
on the region that includes all of Afghanistan.
In this image, the outlines
of the country are added, while the processing has reduced the emphasis on mountain
terrain.
7-13:
In the above image, try to find the area encompassing the Afghanistan-Pakistan
border where Osama bin Laden and his Al-Queda terrorists are believed to be
hiding out as of December 2002. ANSWER
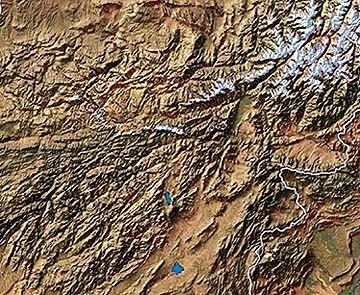
That mountain terrain is
strongly depicted in this reprocessed image:
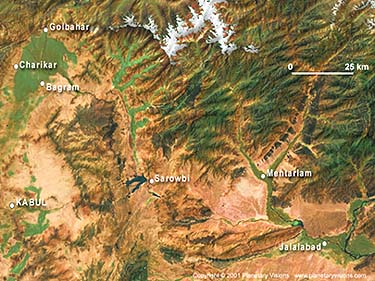
Just to its northeast is
this Landsat subimage that includes Kabul and several of the Afghan towns much
in the news since the War on Terrorism:
The ability to produce
mosaics from high resolution imagery such as Landsat opens a new dimension in
the study of Earth's land masses at continental and regional scales.
Computer displays lose
much of the detail from this resolution, but when we prepare a large space photomosaic,
either at the scale (1:1,000,000), at which it is normally printed or at a moderately
reduced scale (say, 1:2,500,000) to keep it’s size manageable, we retain
most of the original information. The chief users of mosaics, such as those
shown above, are geographers, structural geologists, and geomorphologists, all
of whom benefit from the panoramic vista afforded by seeing local features in
a regional context.
These mosaics also dovetail
nicely with the lower resolution views of continents at the hemispherical scale
provided by meteorological satellites, such as Nimbus (see page 14-4) and GOES (see
page 14-7).