|
The
Goldfield, Nevada Study, and other sites
|
The White Mountain demonstration of the ability of multispectral data to discriminate mineralogy and rock types depended exclusively on Landsat and aerial multiband data. On this page we describe the use of Landsat and AVIRIS in the study of alteration in the Goldfield, and briefly the Cuprite, mining districts in Nevada. Goldfield was the first in-depth study of the potential of multispectral imagery for singling out several of the diagnostic alteration minerals associated with the surface manifestation of certain types of mineral deposits lying near the Earth's surface
In the early ERTS (Landsat-1) days, several geologic investigations were aimed at determining whether the MSS (and later, the TM) sensor could produce images (any mode: natural or false color; ratio; PCA; Unsupervised Classification; others) in which tell-tale signs of alteration of minerals in near surface deposits could be detected. Flip back to page 5-1 for the discussion of the principles involved. Most commonly sought were indications of hydrated iron oxides (gossans).
The best known and ballyhooed study was that of Goldfield, an active mining district in south-western Nevada, about 30 km (20 miles) south of Tonapah (a major mining area) on U.S. Highway 95. It was one of many small to medium active or abandoned mines (including the Cuprite district, discussed later) from which gold, silver, and copper have been extracted. The study was directed by Dr. Lawrence C. Rowan of the U.S. Geological Survey, with assistance from Pamela Wetlaufer of the U.S.G.S. and Alexander F.H. Goetz of JPL, and others. The present writer (NMS) was the NASA contract monitor for this investigation and followed its very promising results with excitement. We will review these, plus more recent updates, on this page.
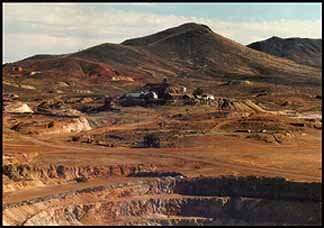
The writer remembers driving through Goldfield enroute to Reno in the mid-80s. Alongside the highway on either side were natural discolorations in browns, yellows, and infrequently orange in the surface soil above the underlying volcanic rocks. This landscape also displayed prospecting pits exposing even fresher gossan alteration. This is a typical view:
Here is a large part of a Landsat-1 image, in quasi-natural color, that includes the Goldfield district:
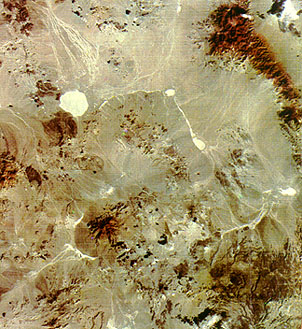
The prominent mountain belt near the upper right is the Kawich Range. The near circular white patch is Mud Lake (normally dry - a playa - but may contain a thin water cover after heavy rains). Goldfield lies just below the brown patch that touches Mud Lake at its south end. The Cuprite Mining district is hard to see but occurs west of the peak-like Stonewall Mountain in the lower left of the image.
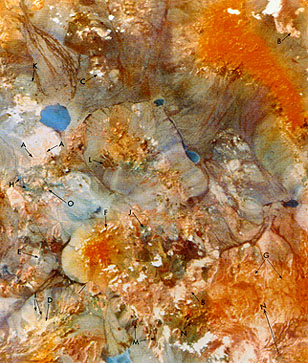
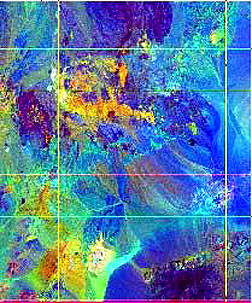
The Investigation Team produced a ratio version of this image, in which MSS Bands 4/5 appear in blue; 5/6 in yellow; and 6/7 in magenta. Vegetation is shown in orange; basalts in gray; silicic extrusives in pinkish-orange. Goldfield is at D; Cuprite is near G; C locates Pihute Mesa in an extension of the Nevada Test Site (this is the area the writer once proposed for a nuclear cratering explosion, when he worked for the AEC; it is also being considered as the main underground facility for eventual storage of nuclear wastes).
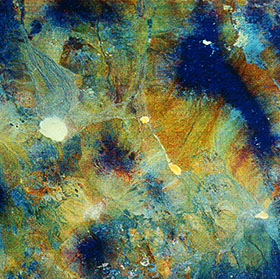
The writer tried his hand at bringing out gossan anomalies using ratioing. In this next image, MSS Bands 4/5 = blue; 5/6 = green; and 6/7 = red. Contrary to my expectations, the anomaly at Goldfield showed up as a distinct and separable orange-brown. Its shape is an elongate E-W patch, with a tendency to form a hook at its west end, which in different versions were a "trademark" of the Goldfield anomaly. That color occurs elsewhere, particularly in desert slopes to the east, and also around Cuprite.
Using Landsat TM data, this hook pattern has been more emphatically defined in this ratio composite (5/7, 3/1; 4/5 as RGB); the Cuprite alteration zone also is identified:
Find Goldfield, using Mud Lake as a reference point, in this full TM scene in which Bands 5 and 7 are involved. The color at the anomaly is pinkish.
Larry Rowan's group extracted what they believed to be anomalies relating to several varieties of alteration. Check their map (the form of the Goldfield anomaly is sketched in the lower right):
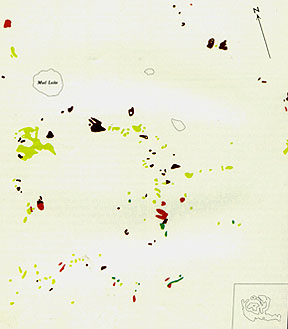
In the map below are X's that represent individual mining areas and prospects in a region corresponding to the Anomalies map just above. Switch back and forth between the two; you will note that most of the X's coincide with the color patches.
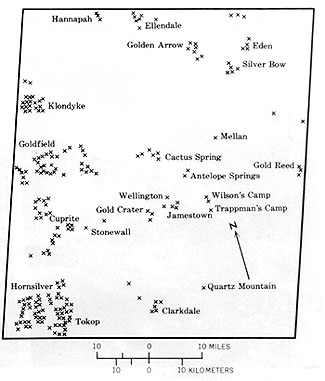
The correlation appears good enough to be reasonably convincing.
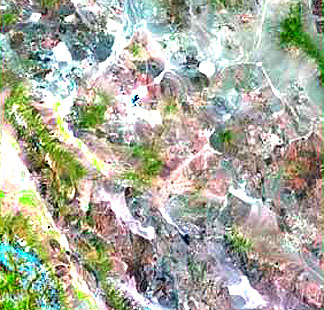
TM data have been processed to extract more information on the alteration present. This is a ratio image, with TM Bands 3/1 = red, indicating iron; 5/4 = green, denoting silica; and 5/7 = blue, picking out clay minerals.
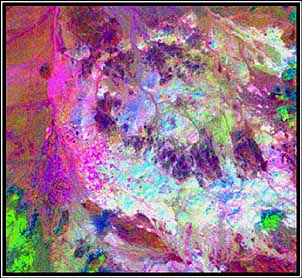
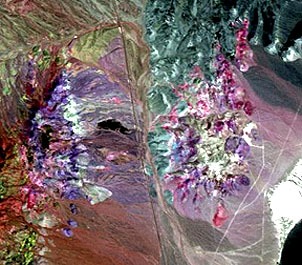
A Principal Components
image (subjected to a decorrelation stretch) of the Goldfield anomaly using
data obtained from an AVIRIS mission yields this result:
Specific minerals are identified
using this hyperspectral data set. For clays, pink = Kaolinite; red = Dickite;
dark blue = Illite; for other secondary minerals, green = Alunite; Additional information
on the above two images, and on other applications of hyperspectral remote sensing
can be found by visiting Spectral International,
Inc' Web Site. We end this part of Section
5 with a tantalizing look at a powerful remote sensing product - an image made
with the AVIRIS (Airborne Visible-InfraRed Imaging Spectrometer) now being flown
by JPL and the U.S. Geological Survey - which will be covered in detail in Section
13. Shown below (and again, in context, on page 13-10) is an image
that delineates iron-bearing minerals and clay minerals around the Cuprite,
Nevada mining district. This kind of detailed plot of the distribution of ore-guide
mineralogy represents the current state-of-the-art capability of sensors suited
for mineral exploration (along with many other uses outside of geology).
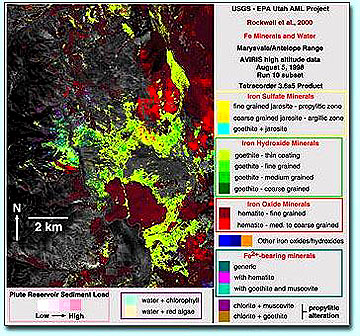
Many minerals in an alteration
zone can be identified specifically, as indicated from the legend for this AVIRIS
image of the Marysvale mining district in Utah.
These last three images
above, of the alteration minerals at three well-known mining districts, all
support the claim that hyperspectral remote sensing will be the prime tool in
exploring for mineral deposits of commercial value from air and space platforms.
For geologists, this approach is almost "revolutionary". Remote sensing has also
been applied to the hunt for uranium minerals. Some of these are associated
with mineral deposits that oxidize or "rust" giving telltale alteration signatures.
But prospecting for uranium minerals is usually done with handheld Geiger counters
or scintillometers. Many uranium minerals are sought in certain rock types -
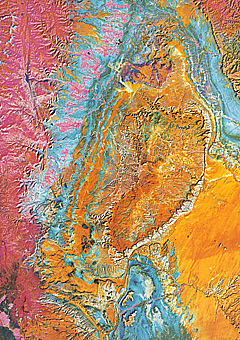
often shale, but also sandstones and limestones. This next image is a specially
enhanced subscene of a Landsat image in which different colors associate with
different lithologies. The area shown is the San Rafael Swell, a broad dome
with gentle outward dipping strata. It lies just north of the Waterpocket Fold,
Utah, that we studied in Section 2.
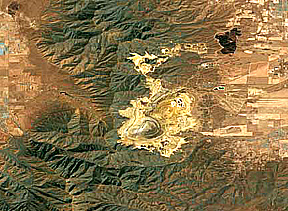
As a peripheral observation,
but again in Utah, we show here a space image of the famed Bingham Copper Mine,
which is the world's largest open pit mine, in the Oquirhh Mountains west of
Salt Lake City.
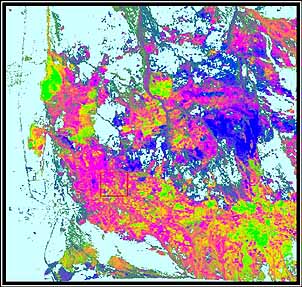 Image courtesy
William Peppin, Spectral International, Inc.
Image courtesy
William Peppin, Spectral International, Inc.