|
New
York, Miami, Atlanta, New Orleans, Houston, Dallas-Fort Worth, and St
Louis
|
The focus of attention now shifts to cities in the eastern half of the United States. Images from several satellites are used to highlight the appearance, at different resolutions, of New York, Miami, Atlanta, New Orleans, Dallas-Fort Worth, and St.Louis. The latest version of this page contains IKONOS images of the horrendous damage and loss of life at the World Trade Center Twin Towers resulting from a terrorist attack on Sept. 11, 2001.
The higher resolution of the Landsat TM facilitates better recognition of many individual buildings, downtown layouts, shopping centers, industrial complexes, and other landmarks in a city. From these images we could draw a street map for most urban areas, if we enlarge the image to fill the screen. We illustrate this with four more examples: the first is New York City and surroundings, then Miami, the largest city on the Florida peninsula followed by the great Mardi Gras city of New Orleans, Louisiana, and finally Atlanta, Georgia. They are similar to Los Angeles and San Diego, being metropolitan areas near sea level.
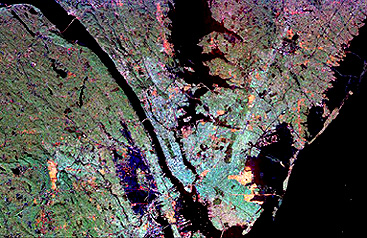
To start, first look at this SIR-C radar color composite that covers the greater New York-New Jersey-Long Island region, which brings out some of the underlying topography:
Now, let's look at another Landsat image that focuses on New York City and the New Jersey cities across the Hudson River (you saw this area earlier in the "exam" at the close of Section 1).
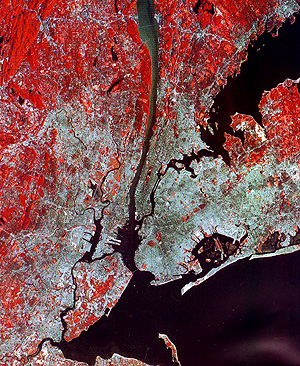
All five boroughs of New York, including Staten Island, are contained in this subscene. Newark, Jersey City, and Paterson are also shown. Look for John F. Kennedy Airport and Central Park in Manhattan. Now, find that Park again in this Landsat-7 subscene in which the 20 meter panchromatic image has been combined with TM Bands 1, 2, and 3. (The orientation has South on the left.)
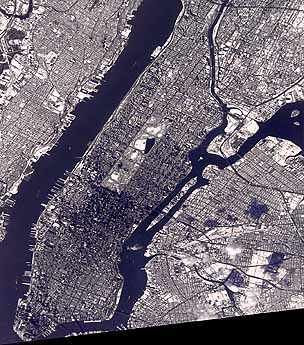
Manhattan, the lower Bronx, and Brooklyn make up the scene photographed by astronauts onboard the International Space Station (ISS):
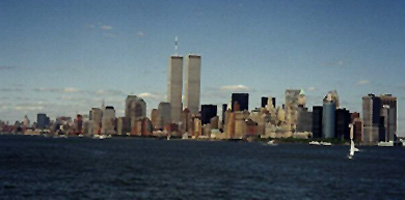
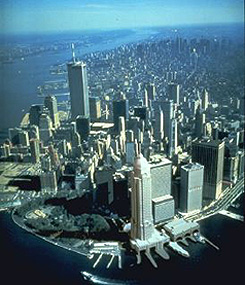
Now let's get down to Earth by zeroing in on Manhattan from the ground, first with a skyline shot and then with an aerial oblique photo looking north from the skyscrapers in Lower Manhattan (A little tidbit: from a distance one notices that there are two clusters of skyscrapers separated by a gap of lower buildings (mini-skyscrapers). Why? Because of the geology underlying Manhattan - the tall skyscrapers are built on two outliers of hard, firm crystalline rock foundations but the land between contains a hundred feet or so of weak sediment unable to sustain the weight of tall buildings.)
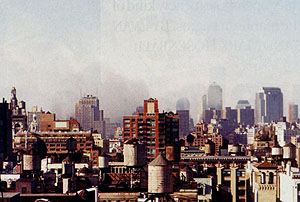
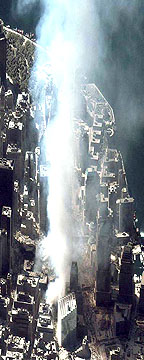
Approximately at 9 AM Tuesday on September
11, 2001 a massive terrorist attack on the United States began with the direct
crashing of two highjacked commercial U.S. jetliners onto Towers 1 and 2 of the
World Trade Center in lower Manhattan. Both buildings, about 110 stories and 1300
feet high, were so severely damaged that they collapsed within an hour. More than
three thousand people lost their lives (and others elsewhere at the Pentagon near
Washington, D.C. and in a rural area of southwest Pennsylvania added several hundred
more fatalities) from airplanes deliberately used as "human-filled" rockets. The
two ground photos below were taken from the same vantage point north of the twin
Towers; the first shortly after the second plane had collided with the South Tower
and the second soon after both towers had collapsed almost to their bases.
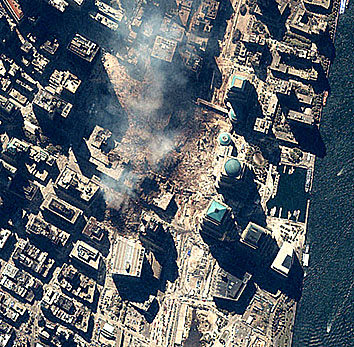
Space Imaging Inc. quickly provided
two IKONOS images of the New York scene, one taken before the event and the
second within a day after the horrific destruction of these, and several adjacent,
buildings. Compare these two views, which illustrate the capability of space
imagery to provide an overview of a disaster in an urban center:
On Saturday, September 15, after
much of the smoke and dust was cleared by a heavy rain, IKONOS captured this
1-meter resolution image (a bit degraded in this rendition) of the World Trade
Center devastation and the avenues filled with rescue and recovery vehicles:
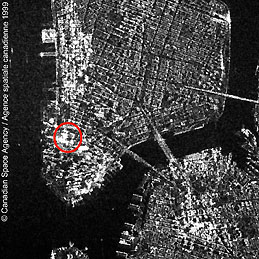
The devastation in Lower Manhattan
was also monitored by satellite radar. Below is a high resolution SAR mode image
taken from Canada's Radarsat, with the World Trade Center complex circled in
red, at a pass (August 1999) well before the Sept. 11 catastrophe:
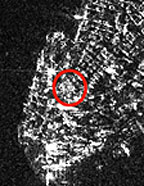
This next image was also made by
Radarsat just two days after the terrorist attacks. But shown is a subset extracted
from that image and enlarged to show more detail:
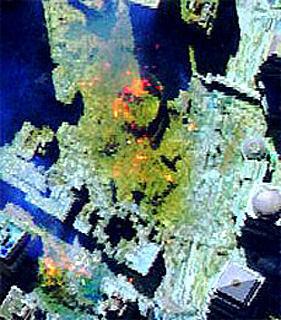
Also, several days later, the AVIRIS
hyperspectral sensor, flown on an aircraft (see Section 13 for details on this
instrument), was directed over the site. With one of its long wavelength bands
as part of a color composite, AVIRIS was able to detect "hot spots" of smoldering
flames, as seen in this image:
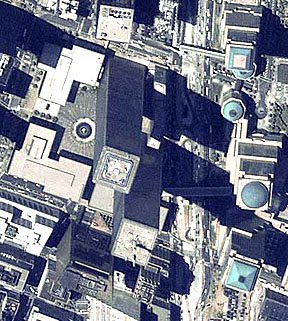
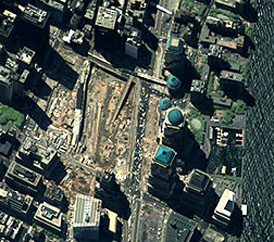
Nearly a year later, in mid-August
2002, IKONOS imaged ground zero at the time that the destruction site was declared
cleared of recovered bodies and debris. Here is a subset from that image.
But, let us next return to more
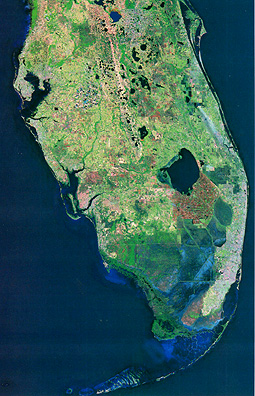
halcyon days before the Terrorist War, and look at southern Florida. We establish
a framework for the Miami metropolis by looking at our first large Landsat mosaic
(others are treated in Section 7) constructed from several individual TM scenes,
each rendered in quasi-natural color.
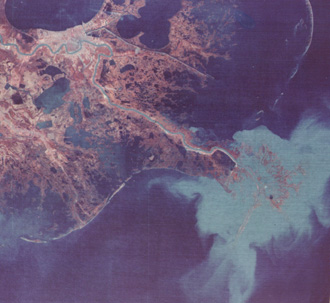
This mosaic extends from the Florida
Keys at the bottom to the Orlando area in the center of state at the top. To the
east is Cape Canaveral, site of all manned and many unmanned NASA space launches.
Having set up your bearings, look for the following features an atlas: the Tampa-St.
Petersburg area around Tampa Bay; Fort Myers; Sanibel Island; Lake Okeechobee;
the Everglades; Alligator Alley; Fort Lauderdale; the greater Miami region. The
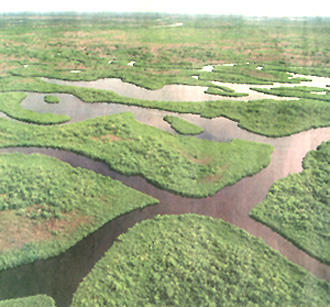
famed Everglades is essentially a wide river of sluggish drainage, flowing over
sink depressions through a vast expanse of open water and land covered by sawgrass
and hammocks - "tree islands", seen in the photo below as irregular, often elongated
patches of hardwoods. The Everglades, a subtropical environment, is being ecologically
threatened as building and drainage to convert to farmlands has seriously disturbed
its natural state. Almost half has been destroyed in the 20th Century; state and
federal programs are rallying to save and better manage the remainder.
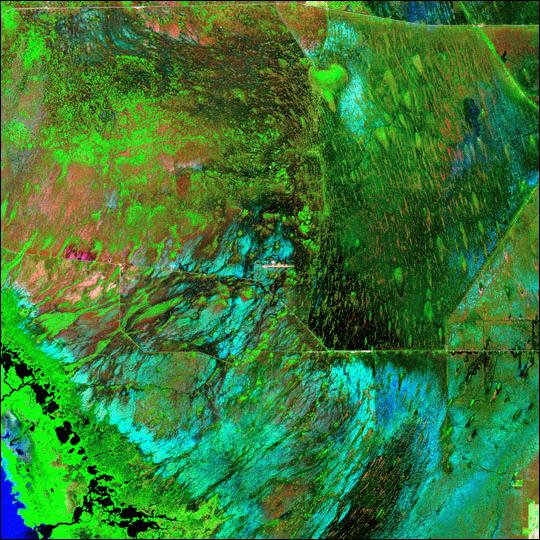
This Landsat subscene affords a
closer look at the a large part of the Everglades:
Along the southern coast are mangrove
swamps and marshes. An extensive farm region has been cultivated in reclaimed
land between Lake Okeechobee and the northern edge of the present Everglades.
The widely dispersed lake country in central Florida develops from sinkholes
and other internal drainage features in the limestone bedrock. 4-6: Find
each of the above features in the mosaic, drawing on an atlas as your guide.
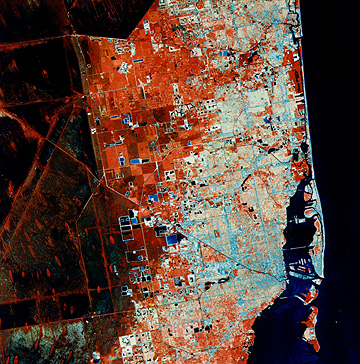
Where are the Florida Keys? ANSWER Next, we view a false-color Landsat
TM subscene that covers the Miami area and much of the Florida Gold Coast, from
West Palm Beach to Fort Lauderdale. The city and its suburbs generally
hug the coastline, being prevented from spreading inland by the eastern edge
of the Everglades. The elongated red features that seem to follow curvilinear
tracks are hammocks, whose distribution follows water flow patterns. The linear
red features are sloughs dredged by engineers to better control flow. The offshore
bar that makes up Miami Beach is conspicuous. The slanted linear feature passing
through Miami is the Miami Canal that parallels Route 27. Reclaimed swamplands
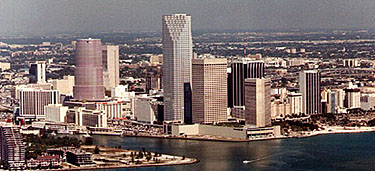
to the north are converted to large farm tracts. Like most large American cities
today, Miami's downtown has an impressive collection of tall buildings:
4-7: Along
the coast, locate Coral Gables, Key Biscayne, Miami Beach, Hollywood. Is Fort
Lauderdale in the scene? ANSWER One of the fastest growing cities
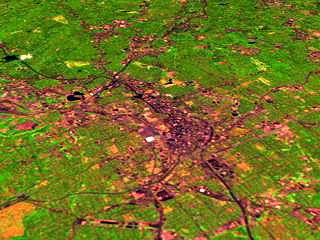
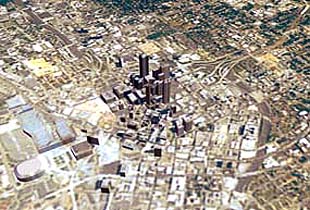
in the eastern U.S. in last 30 years is Atlanta, Georgia. Here is a Landsat-5
subscene taken on June 8, 1999. This next image was made by an airborne
multispectral scanner; rather surprising is the low number of high rise buildings
in the downtown area. Most growth has led to a great expansion of suburban areas.
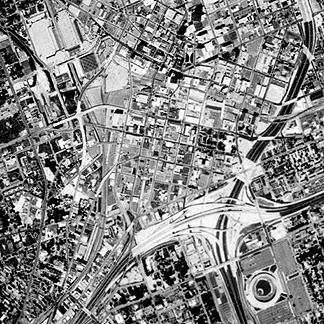
Obviously, even more information
about an urban center will result from higher resolution imagery. This next
subscene shows part of central Atlanta, Georgia, as imaged by the Kosmo's 2-meter
KVR-1000 film camera, which flew on the Russian MIR Space Station. This space
photo has many of the qualities and details of aerial photos. Features of interest
include the Atlanta-Fulton Co. Stadium, until 1997, home of the Braves baseball
team, and the convoluted intersection of Interstates 20 (east-west) and 75-85
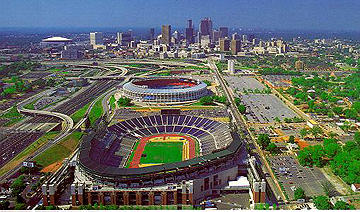
(north-south). Now, this sports complex has expanded,
as shown in this recent photo with the downtown in the background:
You should be able to match this
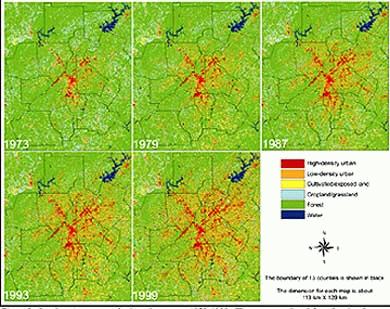
photo to the Kosmos scene above. Using Landsat data over the last
26 years, these subimages (reworked as classifications) really reveal the magnitude
of urban growth in the Atlanta region:
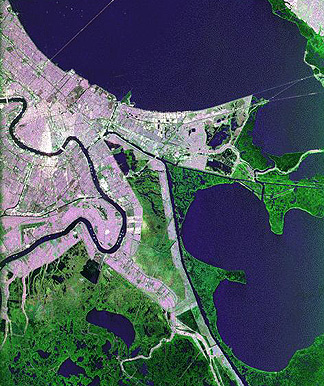
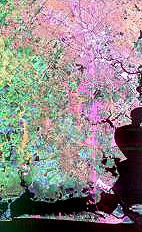
Turning to New Orleans, let's set
the city into context with its surroundings by looking at two images. The image
below is a full Landsat MSS image, in which the city appears in the upper left
between Lake Ponchartrain and meanders of the Mississippi River. This January
1973 scene is dominated by the "birds-foot" distributaries and bayous of the
Mississippi Delta. They are set off by the subdued false-color reds of the swampy
vegetation in moderate winter dormancy, and by the pronounced chalky blue of
sediments from the river, as it empties at the currently-active distributary.
Zeroing in on the city itself, this
Landsat-7 natural color subscene shows the entire city - mostly on the east
side of the Mississippi and parts of Lake Ponchartrain (you can just make out
the causeway bridge that was built from New Orleans to the south edge of the
lake).
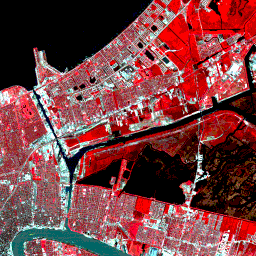
The next image is a still closer look,
consisting of a multiband (with RGB color assignments) SIR-C radar image, taken
from the Space Shuttle on October 2, 1994. Compare the two, noting similarities
and differences.
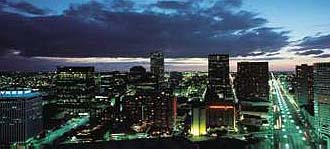
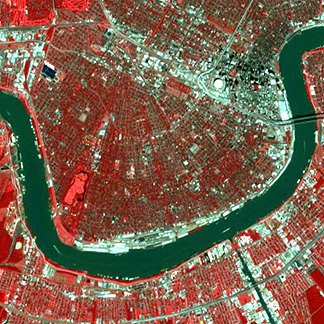
Now look at the TM false-color composite
that is a subset from a Landsat 5 scene obtained on March 24, 1985. Below it
is a night view of central New Orleans - this city really comes to life after
dark, when the humid heat cools and the activities that make this a Fun City
commence.
Remember that the resolution is 30
m (98 ft). The subscene covers a part of the eastern half of the Crescent City,
starting with just a bit of the world-famous French Quarter, at the bottom-left
corner of the image (Bourbon Street near the Cathedral of St. Louis just enters
there). The French Quarter extends from the docks along the Mississippi River,
which has powder blue color, resulting from its high silt content that imparts
increased reflectance in TM Band 2. Many of the city streets form true square
blocks. Some of the larger buildings in this scene are resolvable at the TM's
30 m. resolution. The reds in the city proper are signs of the luxuriant vegetation
that is profuse throughout this lovely city. The large body of water, at the top,
is the south shore of Lake Pontchartrain, a 57 km (35 mi) wide (1619 sq. km; 625
sq. mi) inland, brackish (mildly salty) lake that connects by an eastward channel
to Lake Borgne, which is a saltwater body joined by the Mississippi Sound to the
Gulf of Mexico.
Running through the city is part
of the Gulf Intracoastal Waterway, a continuous 1725 km (1072 mi) long water
route from Carrabelle, Florida to Brownsville, Texas. It also connects with
the Mississippi River to provide a protected canal-like passageway for pleasure
boats and freight barges. Where it doesn't use the open Gulf of Mexico, the
waterway is cut inland from the shore to an average depth of 3.7 m (12 ft) and
width of 38 m (125 ft). This waterway also merges in the scene with the Inner
Harbor Navigation Canal that joins Lake Pontchartrain to the Mississippi River.
Note the wharfs along it. Interstate 10 runs eastward here passing through the
Gentilly section of New Orleans. Highway 46 follows the river through the suburb
of Chalmette. To its north is a large swampy area, or bayou, in St. Bernard
Parish. Much of this area is heavily vegetated, but open water (blackish) takes
up most of the interior. The New Orleans Lakefront Airport juts into Lake Pontchartrain.
Green areas to its southwest are Pontchartrain Park and the University of New
Orleans campus. Now look at another view of central
New Orleans, lying mainly to the southwest of the Landsat subscene. This subscene,
about 9 km (6 mi) on a side, shows the city at 10 meters resolution, as imaged
by the multispectral scanner on JERS-1, a Japanese satellite launched in 1992.
Note the radial pattern of the streets that act like spokes against 000the crescent
bend of the Mississippi River. The large white round feature is the Superdome,
site of several football Superbowls. Tall buildings downtown are just to its
right. The dark patch nearby is astride the Vieux Carre or French Quarter. 4-8: Locate
the SIR-C, Landsat 5, and JERS-1 images in the Landsat MSS subscene.
ANSWER
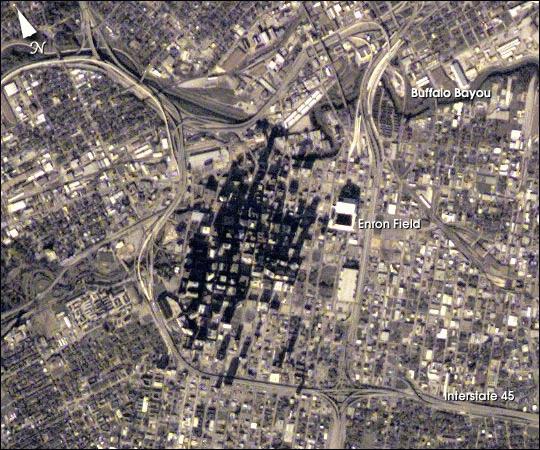
The next big city west of New Orleans,
and one of the country's largest, is Houston, where the writer (NMS) spent three
years at the University of Houston. To set in in context, look first at this SIR-C
X-Band radar image that extends from central Houston to the Gulf Coast at Galveston
Island.
The photo below was taken by an
astronaut aboard the International Space Station. The camera used is capable
of much better resolution than has been acquired in most previous manned missions
from space (see Section 12). This view of downtown Houston shows a part of the
freeway system built through and around this city. Both Houston and Dallas-Fort
Worth (below) have more major urban area road networks than most other American
cities, owing to the foresight of transportation planners in recognizing that
future growth requires such roadways even at the expense of replacing (removing)
homes, etc. to provide the necessary right-of-ways.
One of the prime uses of space imagery
is that aspect of change detection which examines an urban scene after intervals
of years or even decades. This is an invaluable aid to regional planners and
even to the Bureau of the Census, which has learned how to use these observations
in estimating population changes (helpful to the U.S. Congress in re-allocating
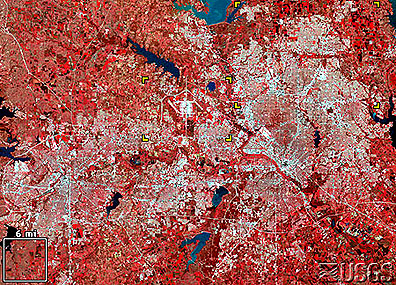
federal funds). The next two images are of the Dallas-Fort Worth, TX area (see
also page 4-5), in 1974 and
1989.
Both of these cities are now major
urban centers - a conclusion one would draw from these views of their downtown
skylines:
We will leave it as an exercise
for you to evaluate the changes in the 15 years since the 1974 subscene. Are
there any new lakes (reservoirs)? Throughout the Tutorial, but mostly
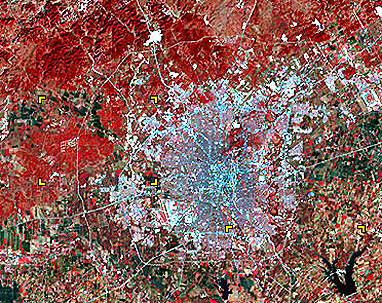
in this Section, we have a number of scenes of Texas. We have, or shall, cover(ed)
all Texas' major cities except San Antonio. To avoid possible negativity from
its citizens, we show this Landsat image of the city built around the Alamo.
Here:
The writer (NMS) would be amiss (i.e.,
subject to bad vibes from his relatives and friends there) if he did not feature
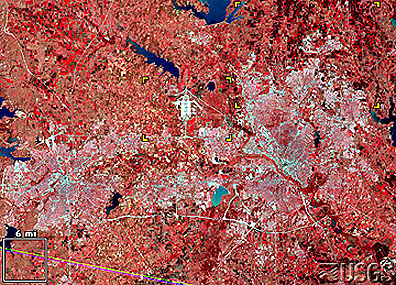
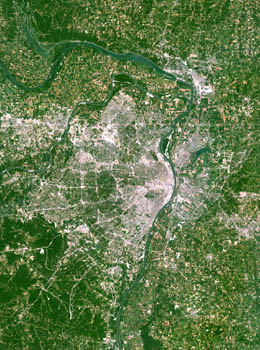
his home town in this Section. So, below is a Landsat 4 subscene showing St. Louis
- the pride of eastern Missouri - the town where, just to its north, the Missouri
and Mississippi Rivers meet.
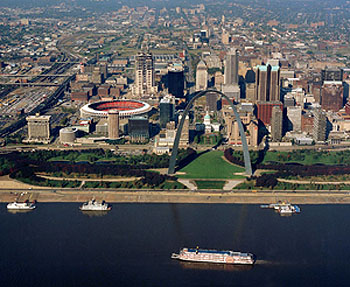
This is a photo of the St.Louis
downtown area, including the stadium that Mark McGwire has made famous:
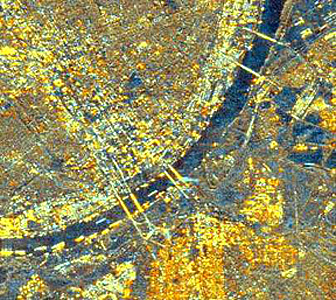
And, for more detail, look at this
SIR-C radar (from the Shuttle) composite (see Section 8) of the central city,
with East St. Louis on the Illinois side (bottom).


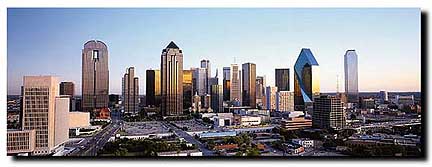 SKYLINE OF DOWNTOWN
DALLAS
SKYLINE OF DOWNTOWN
DALLAS
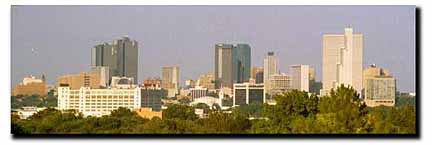 SKYLINE OF DOWNTOWN
FORT WORTH
SKYLINE OF DOWNTOWN
FORT WORTH
 Makes one homesick!