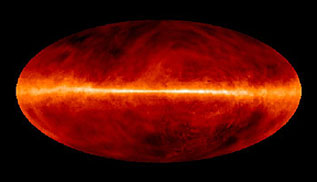
Astronomers at NASA's Goddard
Space Flight Center have assembled images taken at various regions of the spectrum
by instruments (ground and space based telescopes, etc.) looking at our galaxy
the Milky Way, as depicted in this montage (this is not a view of the M.W. taken
externally but one looking towards its center and beyond towards its far edge;
thus that part of the M.W. lying behind us [further from the center] is not included.
Below, each image is identified by its imaging wavelength or wavelength interval
of the spectrum, together with a brief description of the principal information
that is associated with data collected from that region. Starting from the top:
(1) Atomic Hydrogen
(1420 Mhz): Picks out radiation from excited neutral hydrogen in interstellar
gas and dust clouds.
(2) Radio Continuum
(480 Mhz): Signal produced by fast-moving electrons; good for spotting sites
of now diminished supernovae.
(3) Molecular Hydrogen
(115 GHz): Shows distribution of molecular hydrogen associated with carbon
monoxide in cold interstellar matter.
(4) Radio Continuum
(2.4-2.7 GHz): Caused by high energy electrons and associated warm, ionized
gases.
(5) Far-Infrared (12-100
µm): Radiation emanates from dust heated by stellar radiation; emphasizes
active star-forming regions.
(6)Mid-Infrared (6.8-10.8
µm): Due to excitation of complex molecules in interstellar clouds and in
cooler reddish stars.
(7) Near-Infrared (1.25-3.5
µm): Reveals temperatures, mainly of Giant, relatively cool stars, and shows
the galactic core; dust is "transparent" in this spectral region and does not
obscure many luminous features.
(8)Visible Light (0.4-0.5
µm): Displays primarily nearby stars and thin ionized gas; dark areas cold.
(9) X-Rays (0.25-1.5
kiloelectron-volts): Reveals gases heated by shock waves from supernovae.
(10) Gamma-Rays (300
megaelectron-volts): Pinpoints high energy sources coming from pulsars or
phenomena stemming from cosmic-rays. More information about
these images is presented at this Goddard Multiwavelength Astronomy
site. This idea of imaging cosmological
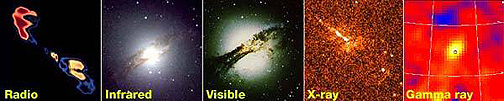
entities at different wavelengths can be further enforced by looking at the
montage of five views of the star Centaurus A in the wavelength regions indicated
on each panel.
A point to be kept in mind
in looking at images below, as well as on preceding and subsequent pages: Images
acquired in any of the specific regions of the EM spectrum do not necessarily
look the same - some may appear notably different than others because of the
way in which the image is processed and displayed (for example, different filters
may be used or the image values for intensity may be rendered in color-coded
levels assigned different colors). Now, some additional examples
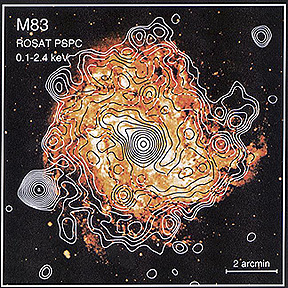
of observations in specific regions of the spectrum: First, let us look at high
energy radiations in the X-ray region. The first image below shows the spiral
galaxy M83 as it appears (in a colorized rendition) optically. Against this
are contours of varations in x-ray intensities (given in units of keV [kilo-electron
volts]) as measured by the joint U.S.- German Rosat (Roentgen Satellite) launched
on June 1, 1990 to monitor the entire sky. Note the close-spaced contours around
the galaxy center, but several other x-ray "hot spots" are also evident.
Several mechanisms account
for this x-ray generation. Most prevalent is excitation into ionized states
of intragalactic gases between stars or gases between galaxies that, in the
tenuous void separating the stellar bodies, are traveling at such high velocities
that they represent temperatures in excess of 1,000,000 °K capable of producing
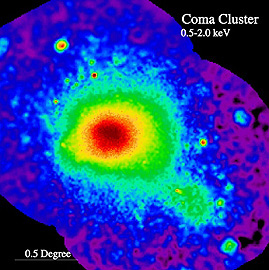
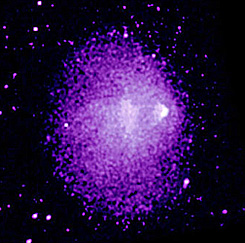
strong x-ray responses. The second Rosat image
portrays x-ray variations spread over the entire Coma supercluster, comprised
of well over 1000 bright galaxies, located some 300,000,000 light years away.
X-ray intensities vary from strong in reds to decreasingly weaker in greens
to blues and purples. The interstellar gases emitting this radiation make up
about 10% of the total mass of the supercluster, along with 2% more in the stars
found in the individual galaxies as determined from optical measurements; the
remainder of the mass is presently unaccounted for after inventories across
the spectrum are related to their sources, so that the bulk of the mass is presumed
associated with dark matter (see page
20-9). Thus, examining both galaxies and intergalactic regions using radiation
at wavelengths both shorter and longer than the visible helps to quantify the
distribution of the entire mass of the Universe.
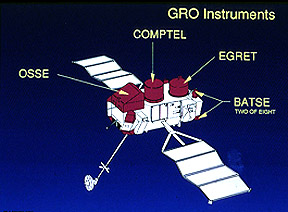
On April 5, 1991 NASA launched
the Compton Gamma Ray Observatory (CGRO) as a complement to the HST that extends
coverage into the short wavelength, high energy end of the EM spectrum. It carried
four instruments that could measure radiation whose energies range from 30 MeV
to 30 GeV. This huge (central part nearly the size of a school bus) sensor platform
has been one of the most productive astronomical observatories orbited so far.
It is shown in this artist's drawing:
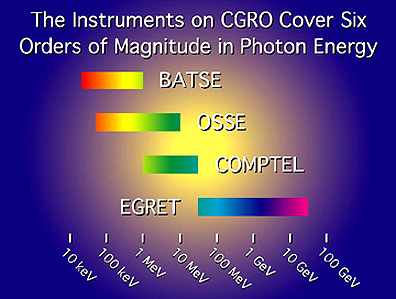
The individual range of
coverage by the CGRO sensors is shown in this plot:
The acronyms stand for
BATSE = Burst and Transient Source experiment; COMPTEL = Imaging Compton Telescope;
EGRET = Energetic Gamma Ray Experiment Telescope; OSSE = Oriented Scintillation
Spectral Telescope. (The CGRO was named to honor Dr. Arthur Holly Compton, an
eminent physicist, Nobel Laureate, and Chancellor of Washington University when
the writer [NMS] was a graduate student there).
The CGRO was designed to measure
radiation associated with stars and galaxies which result from high energy, usually
nuclear processes. It looked particularly at supernovas, quasar and pulsar emissions,
black hole accretions and other powerful stellar processes (next paragraph). CGRO
discovered a new class of energetic objects, called blazars, that give
off energy in the 30 MeV-30-GeV range.
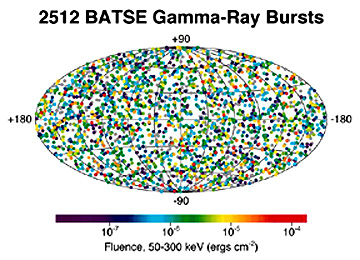
One prime astronomical
target of the CGRO was to search for Gamma Ray Bursts (GRBs), which are huge
releases of energy that are short-lived and variable, are widespread in the
celestial sphere and occur mainly in galaxies. Here is a map of those bursts
measured over time by CGRO; the local effects of the Milky Way bursts have been
removed. These GRBs will be discussed in more detail at the bottom of page page 20-6.
The Compton Gamma Ray Observatory
was a major achievement guided by astrophysicists and operated by NASA Goddard.
You can learn more about its results, with many additional images, at the CGRO site. On June 4, 2000 the CGRO was
deliberatly decelerated so as to enter the atmosphere over the Pacific, as its
orbital decay (adjustment fuel exhausted) meant it might fall to Earth at any
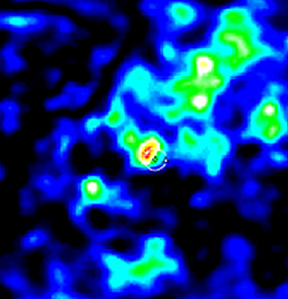
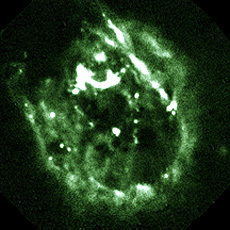
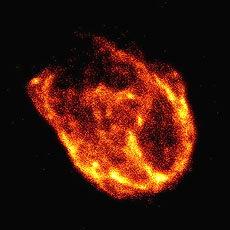
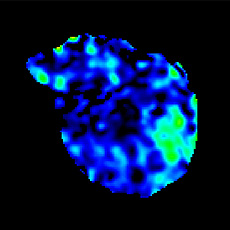
time soon, possibly threatening populated areas. A star in the Vela galaxy
is a typical example. As seen by Rosat, it looked like this:
When variations in x-ray
intensities are determined and displayed by color coding, this results:
CSRO provided this image
in which the energy levels are color-shaded:
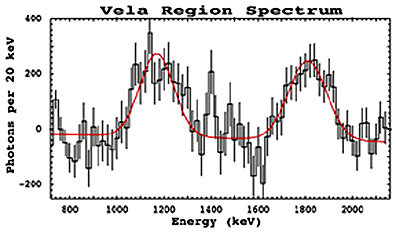
That energy spectrum can
be quantified for this object, as shown in this plot:
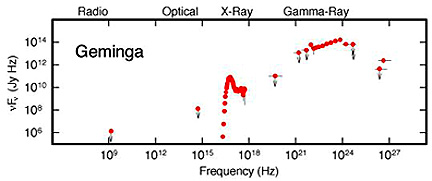
A plot based on frequencies
(which can be converted to energies) was obtained for the pulsar Geminga:
In September of 1999, NASA,
guided by scientists from several nations, launched the Chandra X-ray (Telescope)
(CXO). Named after the late S. Chandrasekhar, a reknown astronomer from India,
Chandra is managed by the Marshall Space Center. Its length, when fully deployed,
is 13.6 m (45 ft). It carries 4 sensors: a charge-coupled imaging spectrometer,
a High Resolution camera, and High and Low Energy gratings.Its spatial resolution
is 8 times greater than the best previous X-ray observatory and can pick out objects
20 times fainter as sources of x-radiation. Its astronomical targets include quasars,
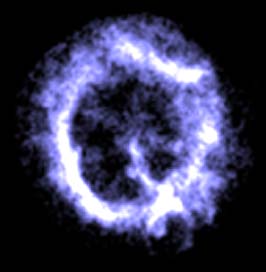
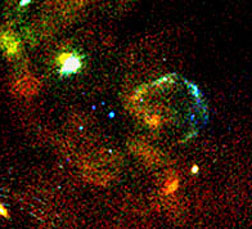
supernova and other high energy-emitting objects. Here is an example of an image
of a ring of x-radiation associated with the remnants of a supernova in the Constellation
Tucane:
Chandra has made images
of regions of more recent star formations (sometimes as bursts) in the Milky
Way. This one is striking indeed.
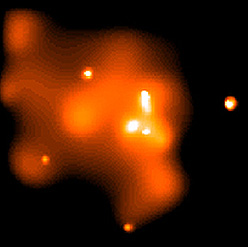
The Milky Way galaxy has
a powerful x-ray source at its center probably associated with material infall
into a Black Hole, as imaged thusly:
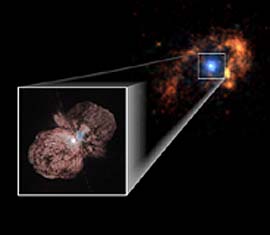
Imaging in the x-ray region
of the spectrum commonly picks up a completely different picture of the object
being imaged in the visible or other regions (see page I-3). This is exemplified
by this artist's reworking of the visible and x-ray renditions of Eta Carinae
in the Milky Way galaxy. The Chandra view shows an outer ring of high energy particles
not having any obvious counterpart in the HST image.
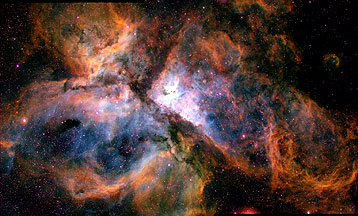
When the Carina nebula
is imaged using narrow band filters, it looks like this. The blue image used
to construct a color composite results from excitation of oxygen in the nebular
gases; green represents hydrogen in this rendition; red is associated with sulphur
ions.
We emphasize these points
with these three views: Visible (top); X-Ray (middle); Radio Wave (bottom) segments
of the EM spectrum, for a exploded star in the nearby Large Magellanic Cloud
(a nebular satellite galaxy)
Because Chandra measures
x-radiation from its targets over a range of wavelengths, individual elements
which give off x-ray spectra at specific wavelengths can be detected and mapped.
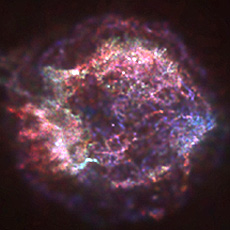
This has been done for the supernova Cassiopeia A. An HST optical image of this
exploding star looks like this:
Here is a four panel set of
Chandra images of Cassiopeia A (see also page 20-6). The upper left
is color density map of the broad band radiation from Cassiopeia A. The upper
right focuses on Silicon emission lines; the lower left on Calcium; and the lower
right on iron. Thus Chandra is an adept tool for determining the distribution
in the expelled material of various elements that were produced by nuclear burning
in the star.
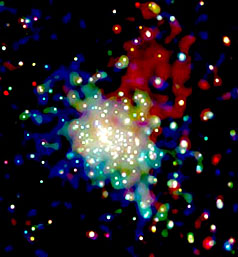
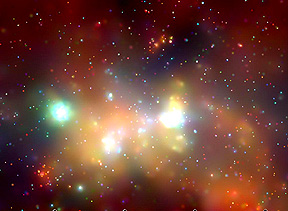
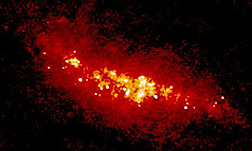
Chandra has explored our
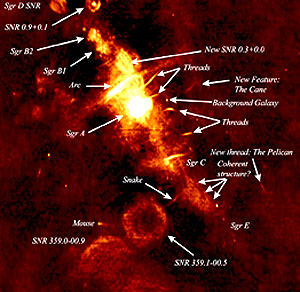
Milky Way galaxy as well. This next image shows part of the central core region
of the galaxy (about 400 light years wide) in which a number of very bright
objects, seen in x-radiation, correspond to high energy emissions where interstellar
gases are drawn into white dwarfs, neutron stars, and possible black holes.
becoming continuously "ignited".
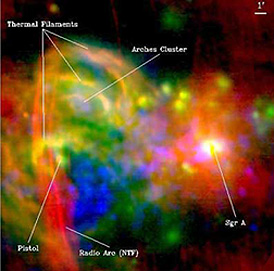
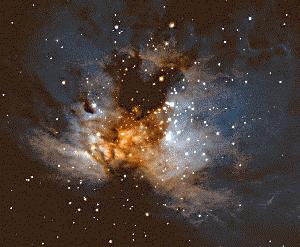
A spectacular image of
part of this central region was made by the Advanced CCD Spectrometer on Chandra:
In December of 1999, the
European Space Agency launched an even more powerful x-ray telescope known as
XMM-Newton (XMM stands for X-ray Multi-Mirror). Here are two colorized images,
the first showing the variations in x-ray intensities in several of the Hickson
group of stars and the second showing details of a supernova explosion in the
nearby Large Magellanic Cloud:
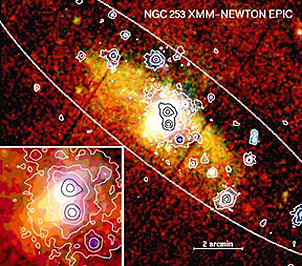
XMM-Newton has demonstrated
that large x-ray energy bursts also associate with the starbursts that mark
development of young stars. Here is an image of NGC253, some 8 million light
years from Earth; the inset on the left is a closer look at its center.
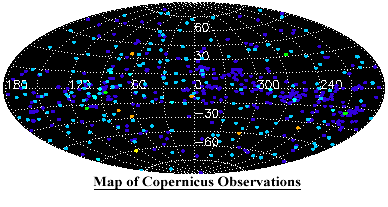
Satellites began to examine
the UV region of the sky with the OAO series (OAO-3 was named Copernicus) in the
late 1960's. The follow-on International Ultraviolet Explorer (IUE) program began
in 1978. Copernicus led to maps of bright UV stars such as this:
The ultraviolet (UV) region
of the spectrum, from 70-2000 (0.007 - 0.2 µm) (Far) to 2000-4000 Angstroms
(0.2 - 0.4 µm) (Near), has provided interesting images of stellar bodies, including
the Sun. It also contains many diagnostic spectral lines helpful in determining
elemental composition. This next image shows the Earth as imaged by EUVE (Extreme
UltraViolet Explorer, launched in 1992 and operating until February, 2001; imaging
from 70 to 760 Angstroms). It shows excited helium (yellow) and hydrogen (orange)
in an auroral field extending well beyond the solid Earth.
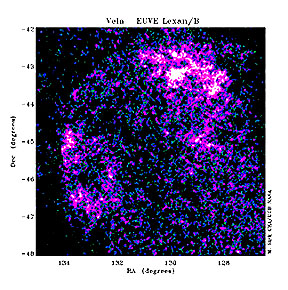
Looking outward into space,
the EUVE provided this image of the Vela Supernova:
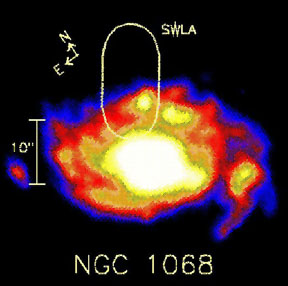
One of the first UV telescopes
is the IUE (International Ultraviolet Explorer) launched jointly by ESA and
NASA in 1978; it operated into 1996. This is a UV image of the galactic source
NGC1680:
The Ultraviolet Imaging
Telescope (UIT) was flown as part of Astro-1 and Astro-2 lab packages on Shuttle
STS-35 and STS-67 in the mid-1990s. The telescope covers the UV range between
1200 and 3200 Angstroms. It is particularly adept at recognizing hot, young
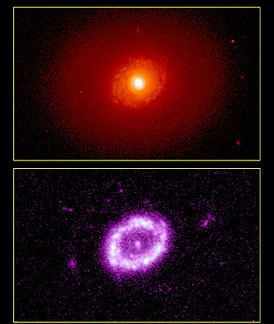
stars which give out strong UV radiation. The difference in appearance between
visible and ultraviolet images is pronounced in this UIT view of the galaxy
M94:
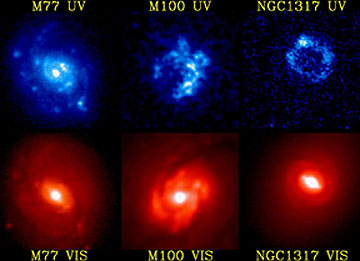
This next image shows three
galaxies in UV (top) and Visible (bottom); note the structure of the spiral arms
as brought out by molecular hydrogen excitation
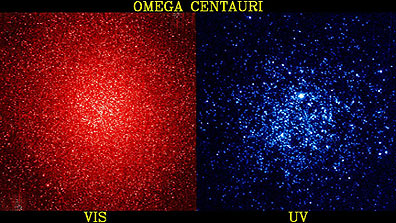
In this UIT image, the
globular cluster Omega Centauri in visible light appears to consist of mainly
red to orange stars, typical of older stellar bodies. But, the UV on the right
shows that there are also many younger, hotter stars.
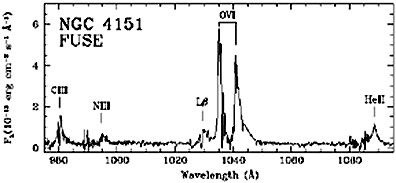
Launched on June 24, 1999,
FUSE (Far Ultraviolet Spectroscopic Explorer) gathers spectra in the interval
910 - 1180 Angstroms. Excitation of molecular and elemental species in a star's
atmosphere or a galaxy en masse in this interval provides valuable information
about stellar processes. Here is a typical spectral plot obtained by FUSE from
observing a galaxy.
Observations through the
FUSE telescope can be converted to images, such as this:
FUSE's primary goal has
been to trace the history of the early Universe by monitoring the distribution
of hydrogen, deuterium, and helium in the intergalactic medium. Preliminary
results indicate that helium, formed in the first minute of the Big Bang, and
then dispersed during the expansion, will prove a sensitive indicator (it is
also well monitored by FUSE) of the inhomogenieties in the expanding Universe
following the initial explosion. Thus, the UV is proving
to be an optimum segment of the EM spectrum to study conditions in the so-called
empty space which actually contains hot interstellar gas. CHIPS (Cosmic Hot
Interstellar Plasma Spectrometer) is an astronomy satellite to be launched in
December 2002. It will measure the diffuse extreme ultraviolet glow that will
better define the properties and physical processes associated with the interstellar
medium. The UV carries to the Visible
spectral range. Just beyond the Visible is the Infrared, extending from about
1 to 1000 µm. Much of the interval coincides with the thermal IR which you studied
in Section 9. Hot stars are strong emitters in the IR and can be studied both
as images and from their spectra. Other astronomical features amenable to IR
observations include properties of accretionary disks and interstellar clouds,
the structure of the H II type stars (those in an early stage of development
that contain significant ionized hydrogen in the inner part of the hydrogen
gas cloud that is the source of their nuclear fuel), and the dynamics of the
Milky Way.
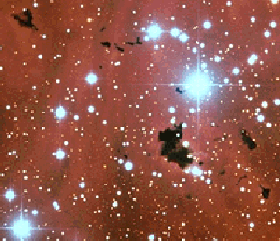
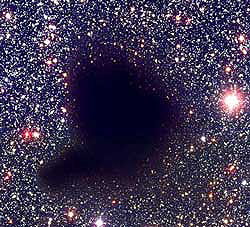
Small dark interstellar dust
that obscures stars in the Visible are called Bok Globules (discovered by a Dutch
astronomer of that name. They represent nebular gas and dust nearing the protostar
phase (see page 20-5); such molecular hydrogen clouds are very cold (-263°C) and
generally because of their small size (about a parsec) produce only one to several
stars. These globules (some of which can be nearly spherical) stand out best in
images that extend into the Near IR, as exemplified by this photo taken through
the Anglo-Australian Telescope (AAT):
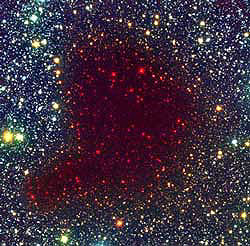
These two photos (acquired
by ESA's New Technology Telescope) show details of a Bok Globule in Barnard
68. The left image is made from three bands in the visible; the right image
consists of bands at 1.25 µm = Blue; 1.65 µm = green; and 2.16 µm = red, which
renders the cloud now transparent so that stars behind it become visible.
A galaxy (NGC2024) that
is still largely shrouded by dust looks much like a visible image in this version
made by the NICMOS camera on HST. The color composite consists of Blue = J band
(1.6 µm); Red = K band (2.2 µm); and Green = J and K combined.
One of the first infrared-dedicated
satellites was IRAS (Infrared Astronomical Satellite) launched in January of
1983. Its sensors were tuned to the 12, 25, 60, and 100 µm IR wavelengths. During
its lifetime, IRAS discovered more than 350,000 previously undetected IR objects
in the sky. This color composite of the interstellar "cirrus" clouds made up
of gas and dust grains in the Milky Way that occupy a wide field centered on
the North Celestial Pole is constructed from Blue = 12; Green = 60; Red = 100
µm.
On a grander scale, look
at this IRAS image of the now familiar neighbor, the Andromeda Galaxy, with
color-codes indicating variations in thermal emission at 12 µm.
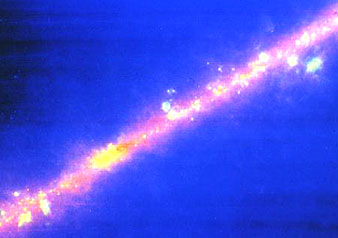
IRAS obtained IR imagery
of the Milky Way. In this next image, the central part of the galactic plane
is displayed. Much of the yellows and oranges is thermal radiation from dust
that obscures individual stars.
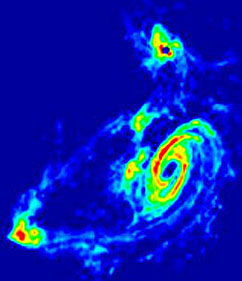
Other IR observatories
have since been placed in space. ISO, the Infrared Space Observatory, was operated
by ESA from November '95 until May '98. The instruments include an IR camera,
a spectrometer, and a polarimeter. The spectral range was 2.5 to 240 µm. This
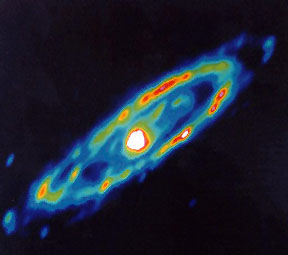
is a colorized image of the Whirlpool Galaxy.
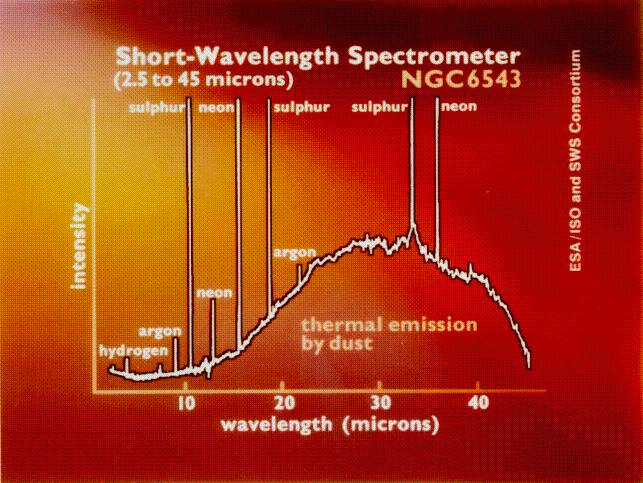
A short IR wavelength plot
of radiation received from NGC6543 shows peaks correlated with argon, neon,
hydrogen, and sulphur which occurs in the dust and gas nebula associated with
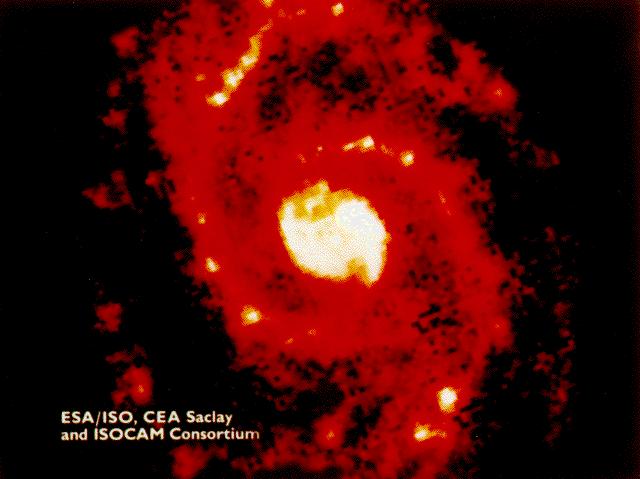
this, the Antennae galaxy.
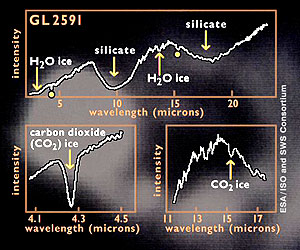
The star GL2591 is surrounded
by a dense cloud. Spectra in the Short Wave IR interval sampled by IS0's spectrometer
disclose water ice, carbon dioxide ice and silicate particles in the dust grains
within the enclosing material.
Infrared observations have
also yield new information about very distant galaxies in the outer reaches
of the Universe. This IR image shows, in the upper right, a glowingly-intense
large galaxy located far out into the early Universe. The radiation intensity
is believed to be related to energy released around a Black Hole (perhaps a
quasar).
Astronomical objects, in particular
galaxies and supernovae, emit the gamut of radiation across the spectrum. Galaxies
are usually strong emitters of microwave radiation, in particular in the radio
region. Radio waves are generated by excitation of neutral hydrogen. A good general
review of radio astronomy has been prepared by the Haystack group at MIT.
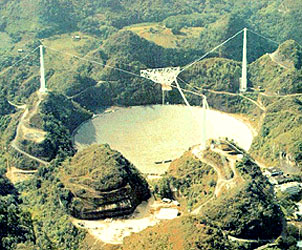
The specialized field of
radio astronomy utilizes large "dish" antennas to capture the long wavelength
radiation. One of the first radio wave monitors is the famed Arecibo site in
Puerto Rico, in which the parabolic receiver is embedded in a limestone sink
in the jungle. The dish, 305 meters (just over 1000 ft) wide, is fixed in orientation
and must use the rotation of the Earth to examine parts of the astronomical
heavens.
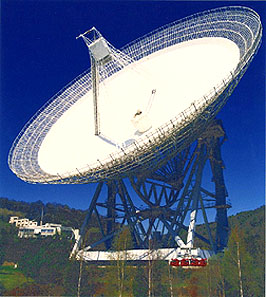
The largest movable telescope
in the world is the 100 meter radio antenna facility at Effelsberg in Germany.
It can both rotate and swing up and down.
Resolution of 00000000000celestial
targets from which radio waves emanate can be improved by developing a synthesized
aperture by means of electronically hooking together individual radio telescopes.
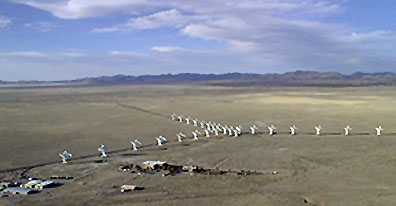
A major facility in the National Radio Astronomy Observatory group is the Y
shaped array of 27 radio telescopes, each 25 m (81 ft) in diameter, located
in the flats 70 miles west of Socorro, New Mexico. This creates an effective
resolution of 36 km (22 miles). This Very Large Array (VLA) mode uses principles
of Interferometry to process the signals from each telescope as a unit.
More background information
on radio interferometry can be found at these Australian
and Canadian
Web sites. In essence, the same signals are received almost simultaneously at
different receivers; when added together these may be out of phase and may cancel
out or reenforce at specific wavelengths; computer processing allows a new interference
signal to be produced. Radio telescopes separated
by hundreds and even thousands of kilometers can be tied together by electronic
wiring or radio signals to each other to produce an array called VLBI (Very
Long Baseline Interferometry). The effect of integrating the telescoope signals
is to increase the resolution significantly, so that smaller features in radio
objects can be discriminated. One of the major tasks
of radio astronomy was to survey the sky at 21 cm to pick up the distribution
of neutral hydrogen in the Milky Way and the halo around our galaxy. Here is
the result:
More details about the
central region of the Milky Way appear in this radio telescope image made at
90 cm.
Whole galaxies are imaged
at the 21 cm H wavelength. Here is M81:
In the early days of radio
astronomy, many radio sources in deep space were discovered but when the same
region was examined by optical telescopy often no obvious galaxy or other stellar
body was found at first. Later observations at non-radio wavelengths have now
detected the astronomical feature, usually a galaxy (many galaxies are very strong
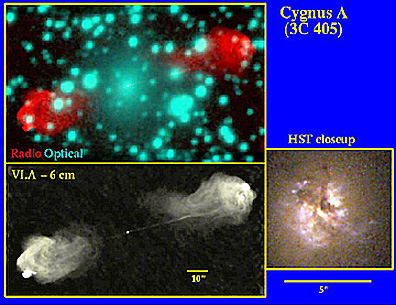
radio wave emitters). One of the best examples of powerful energy emitters in
which visible images do not detect any obvious sources is Cygnus A, from a galactic
center about 700 million light years away. Cygnus A is the strongest radio wave
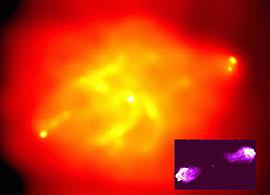
emitter in our part of the Universe. Consider these images:
In the above image, the
upper left shows a visible light image (star groupings in bright blue) but with
no obvious galactic shape; however as colorized in red are two distant lobes
representing radio wave signals associated with Cygnus A. The lower left image
is another radio wave rendition of signals received at 6 cm. The lower right,
made by HST, reveals some strong radiation coming from the central region of
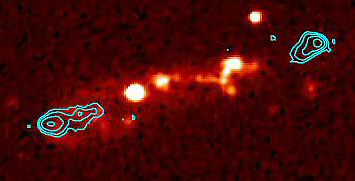
Cygnus A. When that region is examined
through a ground-based x-ray telescope, again it shows below as an expanded
area of matter giving off high amounts of energy at short wavelengths. The inset
at the lower right is another radio wave image (note that there is a corresponding
area for each lobe in the x-ray image.
Here is a galaxy seen in
the Infrared, on which is superimposed the intensity contours associated with
two radio sources in the limbs that once seemed isolated from this distinct
galaxy.
This next image shows an
L-Band image of the Starburst Galaxy; this was made at the Jodrell Bank Radio
Telescope Observatory near Manchester, England, one of the premier facilities
in the field. The signals were obtained from the MERLIN (Multi-Element Radio
Linked Interferometer Network).
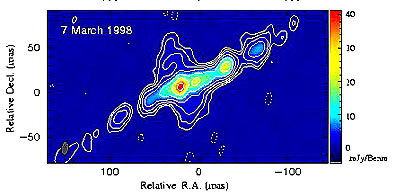
A longer wavelength radio
image acquired by the MERLIN VLBI system shows the binary star pair SS433. Contour
lines show the extent of radio wave activity outside the central region occupied
by the star pair.
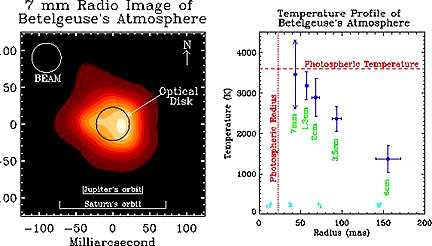
The Red Giant Star Betelguese
(see next page) has been imaged within the microwave region (outside the main
radio interval) at 7 mm. Under these conditions it was possible to measure a
temperature profile (right) in the expanded gas envelope (photosphere) around
the star.
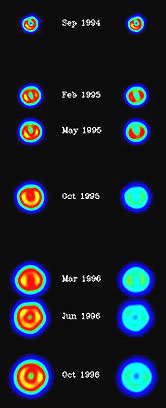
Supernovae (see page 20-6) are strong sources
of radio waves. They expand so rapidly that time lapse images taken months apart
can monitor their spread and the changes in shape of the radio wave field. Here
is such a sequence for Supernova SN1993J in the galaxy M81. The images on the
left were taken at 3.6 cm; those on the right at 6.0 cm.
The reader might have had
a thought during this review of radio astronomy: Why not put a radio telescope
in space? But, wouldn't the antenna be much larger than is commonly on satellites.
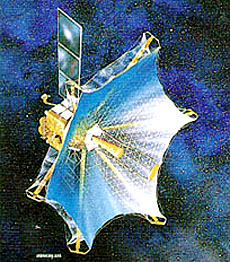
The answer is "No" if the VLBI concept (above) is employed. The Japanese Space
Program has developed and launched HALCA (Highly Advanced Laboratory for Communications
and Astronomy) in February 1997 as the kingpin in their VSOP (VLBI Space Observatory
Project) program. The radio satellite has a 25 m antenna and looks like this:
HALCA's orbit is elliptical,
with its perigee (closest approach) at 1000 km and apogee (farthest) at 20000
km. When coupled electronically with one or more radio telescopes on the ground,
the effective diameter of the joint system is greater than that of the Earth
itself (12755 km). This creates a very high resolution radio wave detector (in
some applications, 1000x better than the HST) when used in the Interferometer
mode. Although HALCA experienced some trouble in 1999, it did send back considerable
data and proved the concept of using multiple integrated radio receivers to
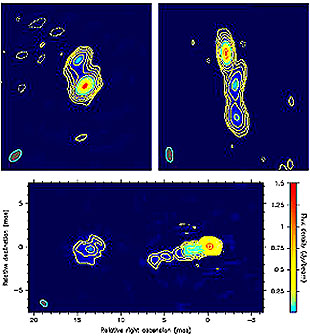
achieve exceptional resolution. Here are three images of quasars (see page 20-6) at considerable
distances from Earth that illustrate one of the ways in which HALCA data can
be displayed:
Plans to put other radio
telescopes in space are now active. Principles behind using multiple radio telescope
satellites, in formation flying, to increase resolution are examined on JPL's
Starlight
program site. Since we have introduced
the specialized technique of interferometry on this page, it is now appropriate
to revert back to imaging in the visible spectrum to mention the CHARA (Center
for High Resolution Astronomy; operated by Georgia State Univ. astronomers)
project which is now commencing operation at the famed Mt. Wilson Observatory
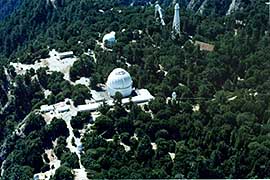
(in the mountains north of Los Angeles), shown here:
The large central observatory
dome houses the famed 100 inch Hooker telescope that Edwin Hubble used to track
down galaxies outside the Milky Way and to measure redshifts, laying the foundation
for the Big Bang model. In the above picture are several of the 6 auxiliary
optical telescopes tied to the main telescopes. Working in pairs, and later
in larger combinations, light from separate components of the array must be
combined and synchronized to produce interferometric images in which the waves
reenforce rather than cancel. This multiple system produces a baseline (at optimum,
1080 feet) that greatly increases the angular resolution of the central telescope,
thus providing images that are expected to exceed the Hubble Space Telescope
in sharpness. To get the signals from two or more telescopes into coincidence
(the light arrives at any two pairs at slightly different times), one beam is
sent through an optical pipe that contain movable mirrors mounted on rails (the
"delay line"). The mirror(s) are moved until the extra distance traveled by
light to the second telescope (relative to the first) is just compensated enough
(equalized) to bring the two signals into phase. This delicate adjustment is
made through a computer program that controls pathway adjustments. With this examination of
space observatories that collect data over different parts of the spectrum,
we now return to the exposition of aspects of Cosmology by looking at the origin
and evolution of individual stars.![]()
![]()
![]()
![]()
![]()
![]()
![]()
![]()
![]()
![]()