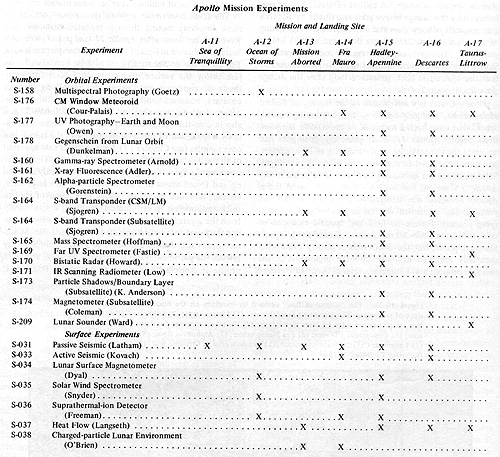
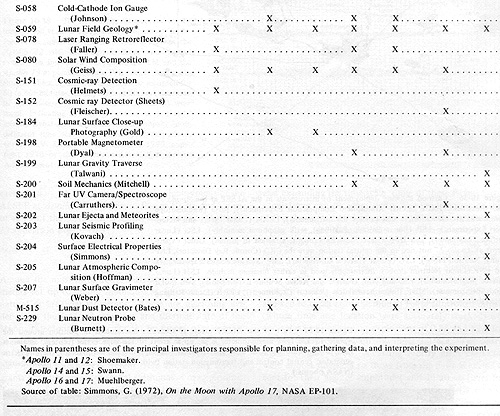
The top priority for Apollo 11 was just to get there (and back). Once successful, the principal effort was directed towards collecting rock/soil samples. But Apollo 11, and all of the subsequent 5 missions that touched down on the Moon, carried a wide variety of scientific instruments selected and designed to measure a diverse set of physical and chemical properties of the Moon - locally, internally, and in its external surroundings. These fell into two categories: equipment mounted in the SIM (Scientific Instruments Module) of the orbiting CSM (Command and Service Module) and surface-emplaced equipment . The instruments used in both activities and the missions on which they were employed are summarized in this table.
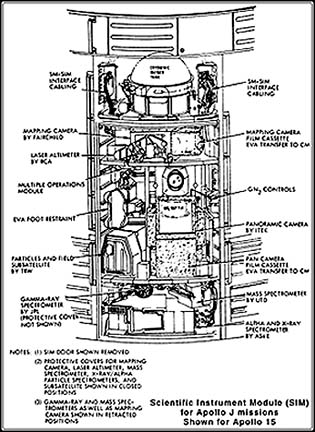
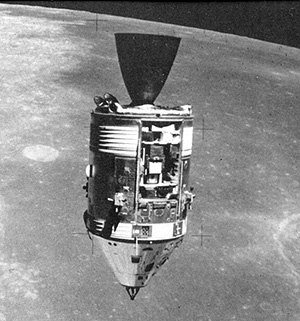
The CSM opens its SIM outer sheath to expose the instruments to the lunar surface, as seen in this photo:
The instruments for the Apollo
15 SIM are labeled in this diagram:
Many significant results have
stemmed from operating both the orbital and the ground instruments. But space
in this Tutorial limits the opportunity to go beyond just a few examples. First,
several orbital findings, shown as images with minimal comment.
The x-ray fluorescence
spectrometer is capable of determining fairly accurately the amounts of a number
of elements, including most of the major ones in rocks and some minor or trace
elements. This plot shows the variation in Al/Si ratio along paths traversed
by the Apollo 14 CSM.
The Moon has a weak magnetic
field. It may have a small metallic core but that is not now fluid, so an internal
field is probably ruled out. The present field is a "fossil" or paleomagnetic
one. The source of the field may be remanent magnetism in the lunar rocks themselves,
possibly induced by interactions with solar and/or terrestrial magnetic fields
or induced in the rocks when/if the lunar core was once fluid in the early history
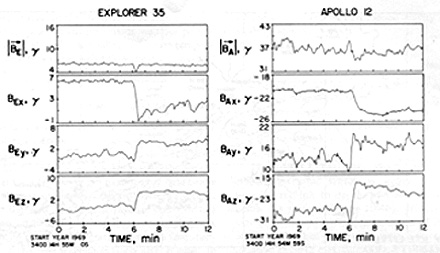
of the Moon. That the Sun's magnetic field plays a large role in the current state
of the Moon's field is demonstrated by the similarities (general correspondence)
in the Β magnetic field vector onboard an Earth-orbiting Explorer 35 and
simultaneous measurements on the ground at the Apollo 12 site.
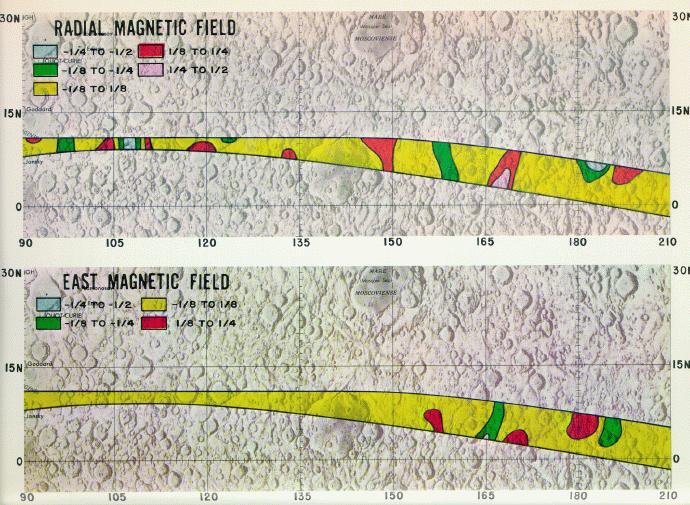
Magnetic field strengths
as low as 38 and high as 341 γ were measured at the Apollo ground stations.
Thus, there is notably variation from one area of the Moon to another. This
is what Apollo 16 measured from orbit using the SIM magnetometer to show surface
variations of two magnetic components:
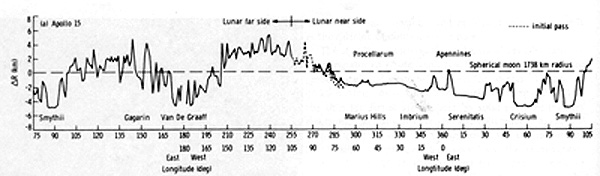
Laser altimeters operated
from several of the CSM's. Here is an Apollo 15 profile along one complete circumlunar
orbit, expressing differences in elevation as ΔR's, or variations in radius
from the mean lunar spheroid.
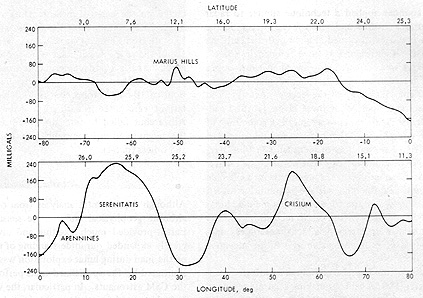
Variations in lunar gravity
were another important parameter to measure in detail. One way to do this is
to use radio tracking to determine changes in spacecraft speeds which result
almost entirely from fluctuations in gravitational pull. The S-band (radio)
Transponder on Apollo 15 was used to obtain these measurements, from which these
two profiles (and others) resulted:
The gravitational highs
over Mare Serenitatus and Mare Crisium correspond to features earlier identified
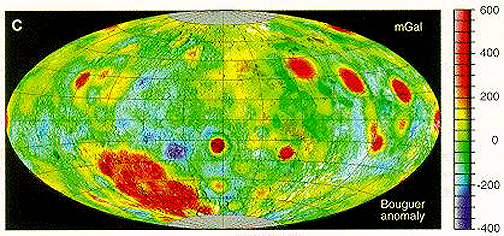
and named mascons (for mass concentrations). These gravity highs are
believed due to increases in rock densities at depths where pressure converts
the gabbro feeding the surface basalts into a denser rock called eclogite (see
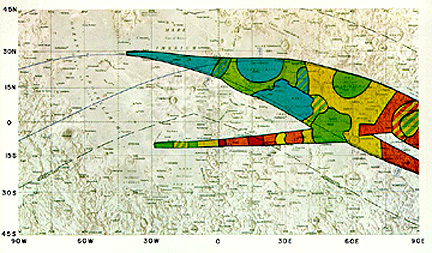
illustration at bottom of next page). This map covering the entire
Moon shows in red areas of mass concentration or mascons; these tend to be found
underneath major mare-covered basins:
Now, turrning to experiments
conducted on the lunar surface by the astronauts. Each Apollo LM carried a compact
package of ground-deployable instruments known by the acronym ALSEP (Apollo
Lunar Surface Experiments Package). Two good reviews of the ALSEP program are
found at these Internet sites (1) and (2).
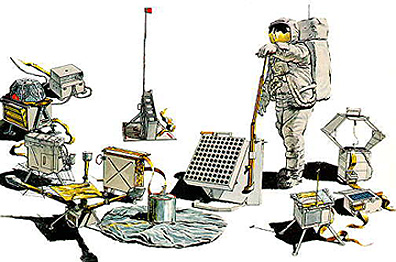
Several instruments were on most flights but individual Apollo missions usually
carried new ones, as evident in the table above. This next illustration, credited
to a 1970 article in the National Geographic Society magazine, shows some of
these instruments:
In front of the astronaut
is the Lunar Ranging RetroReflector (LRRR) (incredibly, there to reflect a laser
beam sent from Earth). Then, clockwise from his left are the Lunar Surface Gravimeter
(LSG), the Lunar Atmospheric Composition Experiment (LACE), The Lunar Ejecta &
Meteorite Experiment (LEAM) the Passive Seismic Experiment (PSE), the Charged
Particle Lunar Environment Experiment; the Lunar Surface Magnetometer (LSM), the
Suprathermal Ion Detector (SID), the Cold Cathode Ion Gauge, the Solar Wind Experiment
(SWE), the Heat Flow Experiment (HFE), and the Active Seismic Experiment (ASE).
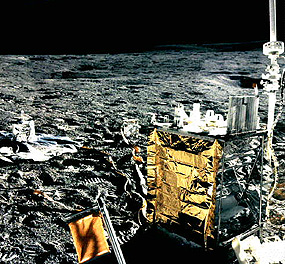
Some ALSEP instruments are stand-alone, with their own power source. Others are
tethered by cable to a central power source, the Radioisotope Thermoelectric Generator
(RTG), shown here at the Central Station point at the Apollo 14 site.
These many sophisticated
instruments (some costing in the $millions to insure their spaceworthiness)
have returned vast amounts of data that have enlarged our understanding of the
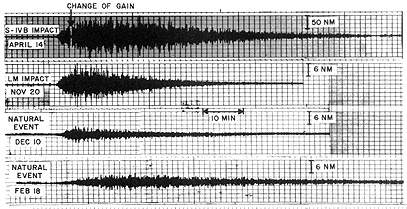
Moon's interior and surface environment. One experiment must suffice to illustrate
this versatility. Below are seismic records (seismograms) obtained by the Passive
Seismic Experiment. The top two are produced when a spent Saturn IV-B casing
was forced to crash on the Moon and when a LM (left behind as the CSM returns
to Earth) was allowed to decay in orbit and hit the Moon. The bottom two records
are of natural (and small; magnitudes of 2 or less) moonquakes from the interior.
All these records differ from
those associated with terrestrial earthquakes in lacking S (secondary or shear)
waves. They also last for much longer than earthquakes - up to an hour, as though
the Moon were "ringing" like a bell. The bulk of the moonquakes originate from
depths of 600 km or more (attributed to the seismic signals bouncing back and
forth in the low velocity surface layers [ejecta blanket]). They tend to occur
in swarms associated both with preferred spatial locations and specific time intervals
(probably accounted for by stresses induced by terrestrial tidal forces).
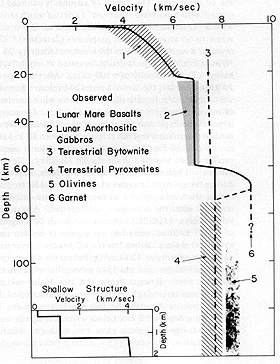
Seismometers at Apollo
12, 14, 15, and 16 continued to operate for years, providing a wealth of data
about the Moon's interior. One model for that interior is shown in this diagram:
Note the two velocity discontinuities
at about 20 and 60 km. Velocities within this interval are consistent with anorthosites.
The higher velocities deeper than 60 km are associated with a proposed pyroxene-olivine
upper mantle. Velocities between 4 and 20 km are indicative of a fractured basaltic
flow sequence responding to load pressure. The shallow velocities (lower left
inset) are attributed to the lunar ejecta blanket units discussed on the preceding
page, overlain by comminuted regolith. A final word: Heat probe
measurements showed a higher heat flow range, averaging 2.8 x 10⁻⁶
W/cm2, than was predicted before the landings (Earth's average is
~6.2 x 10⁻⁶ W/cm2). This implies a hotter interior than
expected, perhaps related to higher uranium (heat-producer through radioactive
decay) concentrations.