We embark now to further explore what GIS does, how it works, what software systems are available, and what typical end products and applications look like. Before moving on, you may wish to gain further insights into GIS by visiting sites on the Internet. One way is to work through some of the entries found through a Web Search Engine. We have picked out a few of the better ones whose links are given here. First, look at a site developed by an (unidentified; but the author is listed as Dr. Shunji Murai) Japanese source found at this Web mirror site. Geographers at the U.S. Geological Survey prepared the second site, which they call the GIS Tutorial. Another useful summary is found at the GIS Development site. The leading U.S. software providers are ERDAS with its Imagine and Leica Geosystems programs and ESRI, which also offers training courses. ESRI has produced a glossary appropriate to GIS, accessed here (Glossary). A general overview of GIS is found at GisPortal. Lists of GIS organizations and links can be accessed at GIS Resource List and GIS links. (Note: please recall from your own experiences in surfing the Net that many links become inactive - or just disappear. Six such links in an earlier version of this Tutorial has vanished. Those cited above were valid as of July 1, 2000. E-mail the writer if you find a link has failed.)
Perhaps the best way to
appreciate the power of GIS, even before examining the design and function of
the data handling system, is to introduce a typical case study * and the thinking
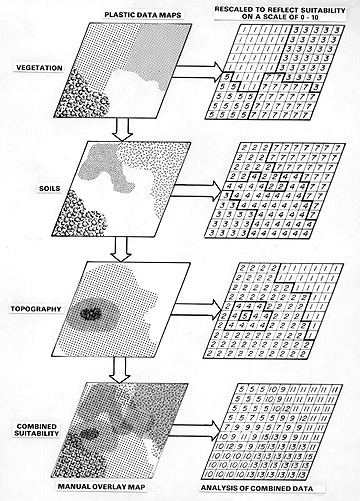
behind the steps in a site-suitability analysis. The following diagram summarizes
the rationale behind such an analysis:
Suppose that three factors or variables, among the attributes that describe a geographic area under consideration, are essential in determining best sites for, say, a land development venture: Vegetation, Topography, and Soils . A data element on a map represents each variable. In this case the map shows the characteristics and distribution of the members or classes within the element theme, e.g., different types of soils and their properties.
We usually designate one
map, often a cartographic map, as the base, over which we lay the others, (each
then constitutes a data layer) either manually or digitally. Now, some soils,
vegetation cover types, and elevations are more favorable than others in specifying
their role in the site-selection process. Thus, for a certain intended use,
we prefer high areas over low areas. So, we assign relative heights numerical
ratings, say from 1 to 5. We can mark soils with optimum drainage by higher
numbers in a scale of 1 to 8. We then subdivide a data element map into cells
in a grid. We assign each cell a value based on its thematic rating. We can
incorporate other kinds of data, e.g., tables representing some condition in
the cells, provided there is some spatial connection. When we combine the maps
sharing the same cells, each comprising a data layer, the values sum for each
cell (ranging from lowest numbers = worst suited to highest = best suited).
In a modern GIS, we do this digitally. The outcome is a map, in which we judge
areas with the highest resultant scores the most favorably suited.
15-8: The numerical data and their values
need to be assigned to each cell. This is called encoding. For the soils map,
as an example, suggest 5 ways in which this encoding can be done. ANSWER