Mapping the Extent of Flooding
This kind of information
was a factor in predicting the major flood in the northern Midwest, late in
the Spring of 1997. Satellite imaging gave a critical look at the great floods
on the Red River in North Dakota and Manitoba (Canada) that inundated Grand
Forks, Fargo, and other towns along the state's border with Minnesota.
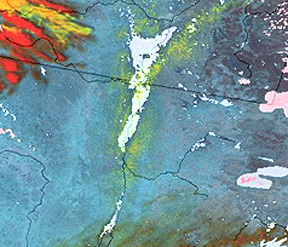
A color composite made
from three NOAA AVHRR bands imaged the flood on April 27, with light gray
representing the water and orange depicting clouds:
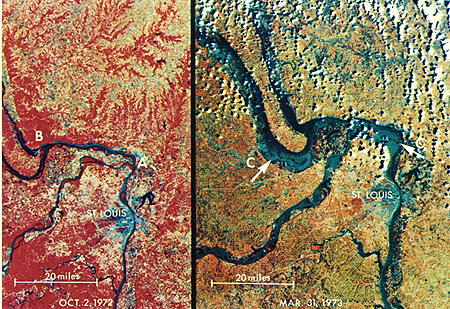
Spring flooding is
frequent in parts of the Mississippi River basin. A hundred-year flood,
i.e., largest expected statistically in a 100-yr span resulted from snow
melt and rain in late March of 1973. This Landsat-1 subimage (with an earlier
pre-flood view) captured the extent of flooding on a cloud free day, showing
St. Louis, Missouri (protected from downtown flooding), and the flood plains
of the Mississippi, Missouri (joined at A), and Illinois (at B) rivers:
Twenty years later, the
Midwest again flooded, worse than before. After several months of excessive
rain that saturated the soil, because of a blocking high pressure system that
kept the jet stream relatively stationary, in late July and August of 1993,
water levels rose well above flood stage. Areas hardest hit were from Iowa
to southern Illinois. Levees broke, inundating tens of thousands of acres.
The '93 flood became the costliest in U.S. history (some estimates approach
$15 billion). Satellite imaging played a key role in getting a number of good
images of the flooded area. An indication of how experts in the Weather Service,
the Corps of Engineers, etc. go about studying this flood and other floods
is found at this Earthsat
Web Flooding site.
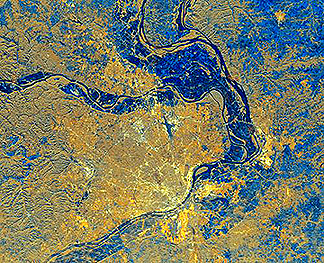
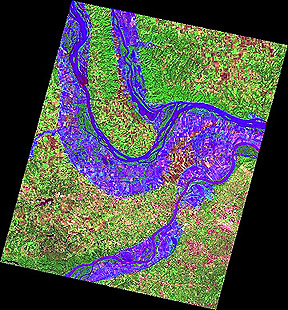
Once again we examine
the lowlands northwest of St. Louis. One image taken by Shuttle astronauts,
using SIR-C, appears on the top. On the bottom is an image of merged JERS-1
radar and a SPOT 3-band composite, which offers considerable detail (notice
how farmlands show through the water).
14-41:
Which year does the Mississippi flood seem worse?
Why isn't St. Louis flooded? ANSWER
Up river during the
same 1997, the SAR radar on ERS-2 showed the flood (mostly black tones)
near Dubuque, Iowa:
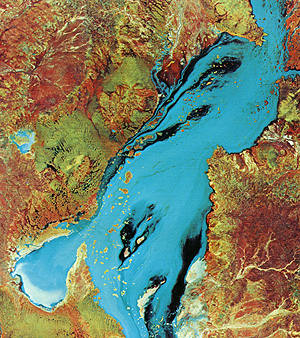
The next image is a
Landsat-1 subscene (February 6, 1974) of the Barcoo River in Queensland/South
Australia, flooded by Fall rains. The floodwaters have spread greater than
50 km (31 mi) wide in these low-lying plains, with low rolling hills.
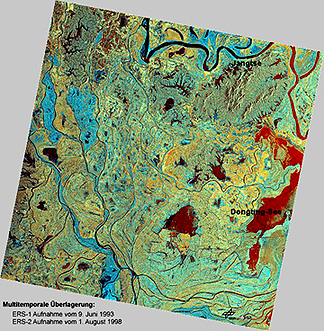
The Yangtse River in
China underwent a major flood in August of 1998. Millions were driven from
their lowlands homes. In this unusual image, an ERS-1 radar image taken
during June of 1993 is joined with an ERS-2 radar image taken on August
1, 1998, providing a multitemporal or change detection rendition. Both blue
and red associate with flood waters.
Finally, check this
map showing areas with high soil moisture, a condition that bespeaks of
water saturation from earlier heavy rainfall or from previous flooding.
This soil wetness map shows much of Asia; maps of all the continents plotting
this parameter are made by NOAA/NESDIS.
This lengthy Section
14 purports to convey that the principal use of remote sensing remains surveillance
of weather systems and oceans on local-to-global scales. We report this
because of the widespread occurrence of water on the Earth's surface (even
greater than the 70+% ocean surface area, stated on page 14-1, if we include
the Antarctic ice [which stores more than 80% of the world's {frozen} fresh
water] and Greenland. At this point in the
Tutorial, we have examined most of the specialized modes of remote sensing
(defined by the electromagnetic spectral regions we can use), the spacecraft
systems that mount the sensors, and the numerous applications to which these
sensors have contributed. In the next Section (15), on Geographic Information
Systems (GIS), we look at some systematic ways to integrate remote sensing
data into organization, correlation, interpretation, and management of geographically-referenced
information. Then, in Section 16, we look ahead to the next generation of
remote sensing programs, in which individual satellites will simultaneously
make meteorological, oceanographic, land surface, and biologic observations
to present a unified picture of Earth as a System.