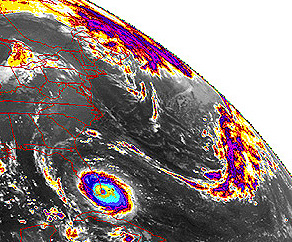
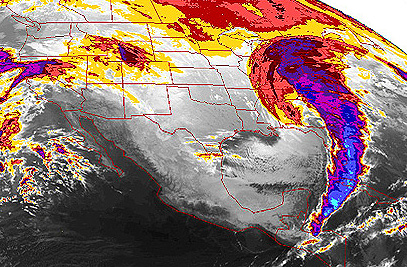
The top image from NOAA-7
shows the hurricane as it strikes land in Florida, with colorized tones representing
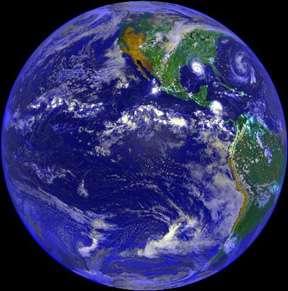
higher intensities. In the middle is a GOES-7 full-Earth, color view obtained
on August 25, 1992, in which Andrew approaches New Orleans. This perspective
indicates scale, showing the hurricane, while powerful as organized, was still
just another mass of clouds of no greater extent than some other storm systems.
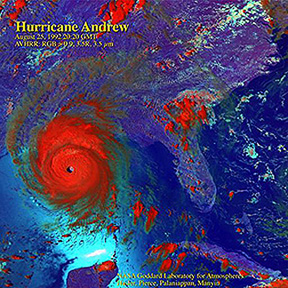
But, on close-up (bottom) in the AVHRR color version (RGB = 0.9; 1.5R; 3.5 µm),
the perfection of the eye and the well-developed structure of this counterclockwise-spinning,
low-pressure system are obvious.
14-25: What do you think happened to Andrew after it made its second landfall around the Mississippi Delta? ANSWER
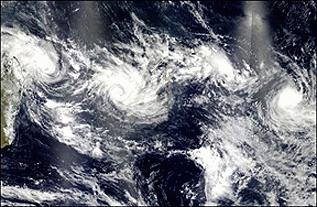
The Terra and Aqua programs are the subject of Section 16. These two satellites are not designed specifically as metsats but they do gather considerable data pertinent to weather and climate. Here is a Terra MODIS image of 4 hurricanes (typhoons in the eastern hemisphere) crossing the western Indian Ocean on February 12, 2003:
On March 13, 1993, the
"Storm of the Century", shown here in this GOES-7 image, with more intense clouds
(color-enhanced), struck the eastern U.S. with massive snow falls and high winds.
The writer (NMS) at the time was in Bloomsburg, Pennsylvania, preparing to leave the next day to give a paper on the Manson Impact Structure (see page 18-2) at the Lunar and Planetary Science Conference in Houston, TX, the first he was to attend since the original Conference on Apollo 11 moon rocks 23 years earlier. It was not to be. Snow locally exceeded 60 cm (24 in), driven into deep banks by winds. All Interstate highways within Pennsylvania closed for two days.
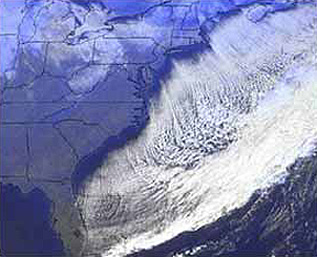
Metsats are excellent monitors of less violent, more conventional, but still interesting weather data. We are all familiar with the passage of cold fronts, followed by clear weather as a pressure high moves in. Commonly, moist, warm air is encountered by the front and develops into a broad area of clouds and often stormy weather. This next image shows the sharp leading edge of a front now off the Atlantic coast of the U.S. and out to sea. At its back edge is another sharp boundary beyond which cold, dry air is moving in.
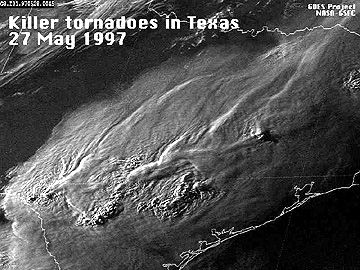
Lastly, tornadoes, while much more localized than hurricanes or subcontinental storms, can do incredible damage to the areas on which they touch down. Low pressures, and wind velocities that can exceed 200 mph, will flatten buildings (tornadoes have a special fondness for trailer parks), uproot trees, and carry objects for hundreds of feet to even miles from their spot of origin. The storms that brew them are effectively tracked by ground radar and by satellites (usually geostationary). On May 27, 1997 several lines of storm clouds bearing multiple funnel clouds crossed central Texas with deadly results. Here is a GOES-8 image of these advancing fronts.
When a storm has passed and
the sky clears, a passing satellite can often see the actual damage if conditions
are right. This was the case three days after a killer tornado touched down on
May 5, 1999 within Oklahoma City, OK., cutting a path through city and suburbs
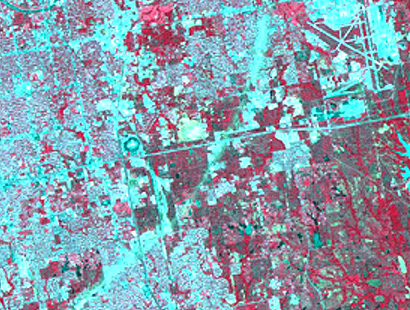
and just missing the airport. Look for the diagonal blue strip in this IRS-C LISS
false color composite - this marks the zone of heavy destruction.
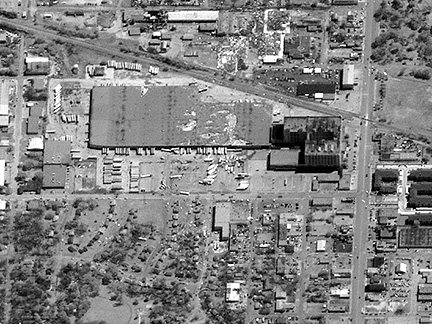
Now that IKONOS and other
high resolution sensors are operational, it is feasible to inspect damage from
tornadoes in considerable detail - equivalent to flying an aerial photo mission.
A tornado touched down in Fort Worth, TX, ripping off roofs from warehouses
and other buildings, as evident in this 1 m resolution IKONOS image.
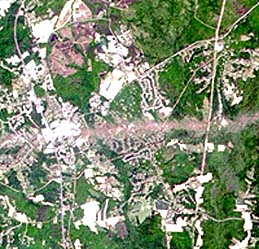
The first tornadic storm
of 2002 to produce multiple deaths (4) occurred on April 28 around La Plata,
Maryland, about 40 miles southeast of Washington. This may have been an F-4
tornado (the second highest wind category) and as such was the most powerful
ever to hit Maryland (and one of the strongest ever to hit the East Coast region).
Within just two days, the narrow path of destruction (that was, however, 6 miles
long) in which several hundred buildings were damaged was imaged by EO-1, as
seen here (the pink color was caused by destruction of vegetation [reducing
the natural green input]):
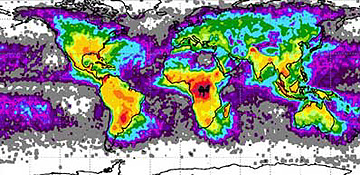
Still another hazard, and
sometimes a killer, associated with usually severe storms are lightning strikes.
Worldwide thousands of individual lightning discharges, including dramatic bolts,
occur each day.This next map shows the geographic distribution of the frequency
of strikes averaged over 5 years (1995-2000) of data collecting by NASA's Optical
Transient Detector and by the Lightning Imaging Sensor on TRMM. Note that the
central part of Africa has the most lightning strikes; almost all of South America
is prone to frequent electrical storm activity.