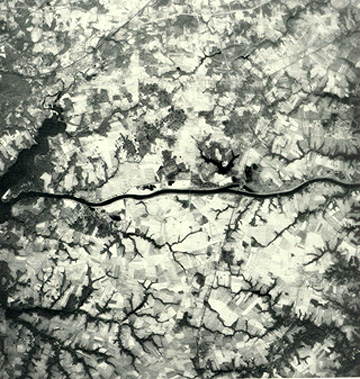
Next is a high altitude U-2 photograph of part of the above area; locate yourself using the canal.
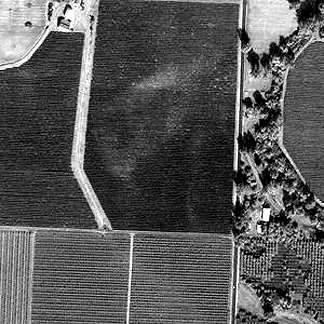
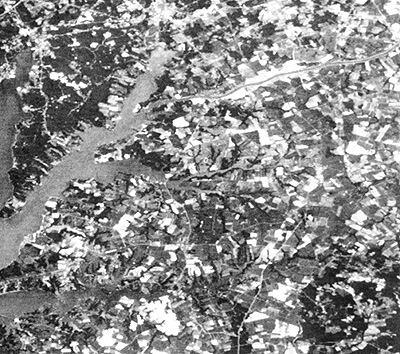
Now, to zoom in further, consider this medium altitude aerial photo which contains part of the canal.
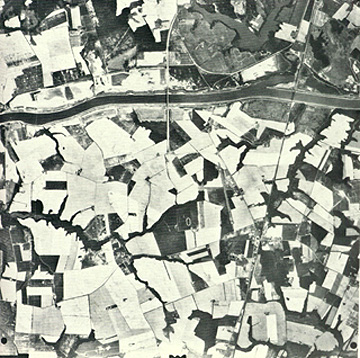
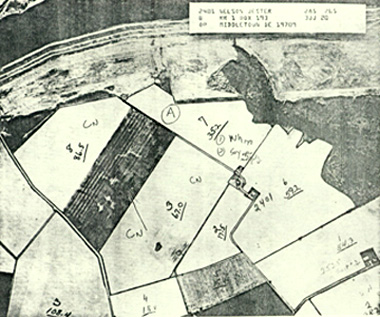
Finally, here reproduced is a paper print of a low altitude aerial photo that was actually taken into the Delaware test site. The Soil Conservation Service's field agent has made notations showing characteristics and yield for some of the crop acreage.
The writer (NMS) was a participant
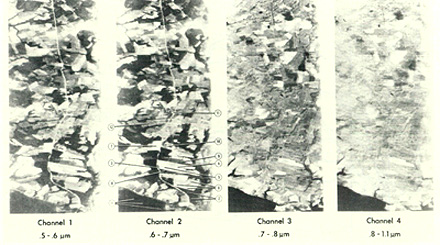
in this field study. As part of the preparation for the Landsat phase, NASA flew
an aircraft mission with a multispectral scanner over fields in the Delmarva Peninsula
to the south of the study site. Here are four images designed to simulate the
4 Landsat MSS bands:
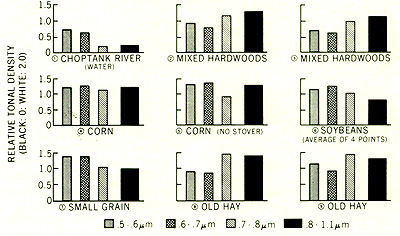
From the data, an analog
measure (using a photometer operating on a transparency) of the photo-density
of selected fields in each of the MSS-equivalent bands led to this plot of relative
darkness as a proxy for reflectance coming from the ground features and crops
indicated:
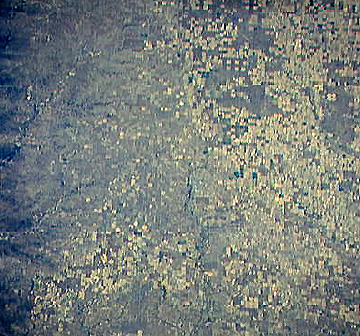
Let us turn from this specific
study to some more general examples. Many of the photographs taken from the Shuttle
by the astronauts have agricultural areas as their subject matter. Often these
photos are not particularly good owing mainly to atmospheric problems. But this
one covering the land around Enid, Kansas is one of the better.
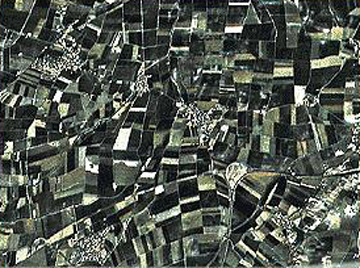
Other satellites produce
excellent near-natural images of farmlands, such as this SPOT scene: At higher resolution, here
are fields in California's Great Valley near Fresno imaged by the IKONOS-2 satellite.
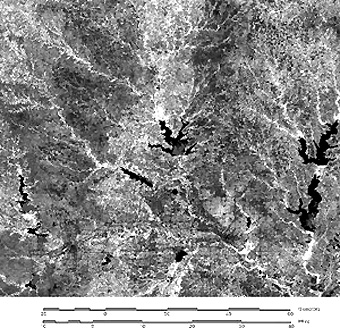
At the other extreme, the
AVHRR, as demonstrated on page
3-4, is quite adept at providing small-scale, large area indications of
crop and vegetation vigor, often expressed as NDVI. This next image is a black
and white plot of the NDVI values (using channels 1 and 2) for the land in and
around Dallas, TX. Light tones indicate high NDVIs.
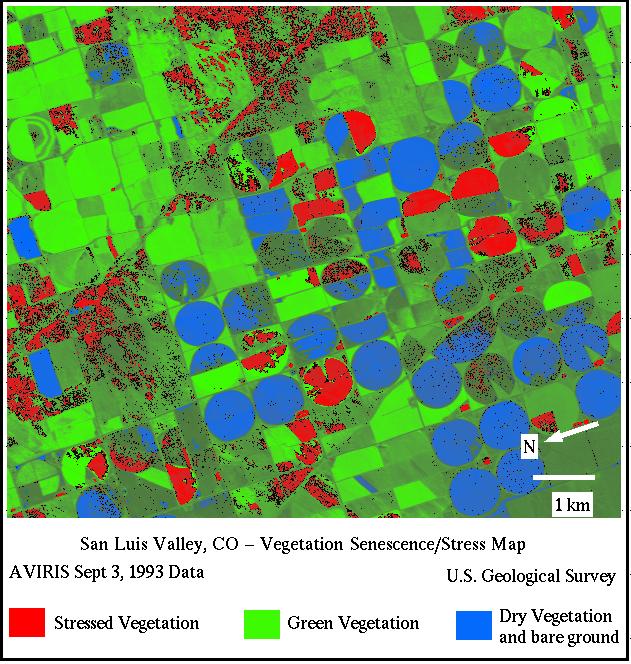
Crop stress results from
insufficient soil and/or crop water (drought), improper nutrients; plant disease,
insect infestations, and other factors. The next image is of cropland in Colorado's
San Luis Valley. It was made by the AVIRIS sensor that will be described in
detail on pages 13-9 and 13-10 of this Section. A classification of these Colorado
crops is treated on page 13-10. Here we
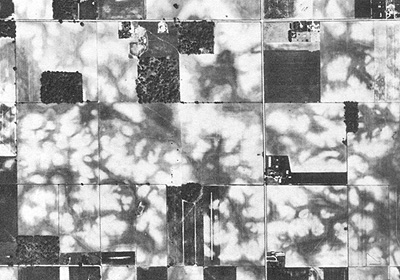
show AVIRIS hyperspectral data that use bands sensitive to crop moisture deficiency. Soil moisture is one of
the critical parameters a farmer needs to know in making decisions about planting
conditions and need for irrigation. It is often the precursor indicator of potential
or actual crop stress. This can be done through aerial photography, as shown
here for some Indiana farms, but the cost of flying for specific water inventory
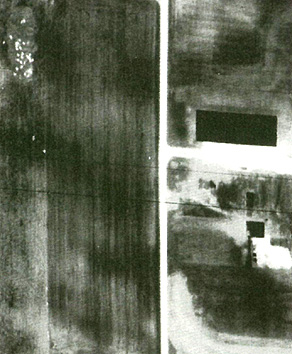
is high. Thermal scanners are also
good at detecting moisture, as indicated in this aerial image of a Wisconsin
farm, taken around 9 PM at night shortly after the setting Sun. The bright spots
in the upper left are a herd of (warm) cows. The black rectangle in the upper
right is a sheet metallic roof on a farm outbuilding, which shows "cool" because
of the very low emissivity of metal.
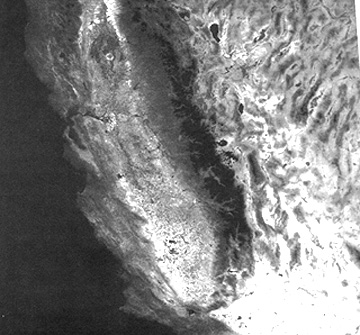
AVHRR thermal bands can
also provide useful agricultural information. And so did HCMM when it operated.
Here is a HCMM Day Thermal image of much of California, taken in May. Note the
farm patterns in the central Valley. Note also the very dark area in the High
Sierras - this is spring snow that will eventually provide water for the crops
during summer meltdown.
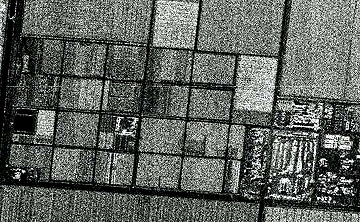
Radar is a good means of imaging
farmland, as seen in this low altitude aerial radar mission over the Maricopa
area near Phoenix, AZ:
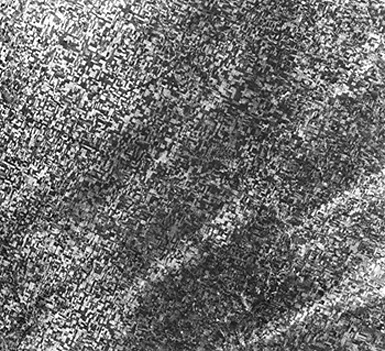
Seasat radar imaged this
next scene, in the Great Plains. Some fields are dark, others light, indicative
of the stages of growth (light areas reflect more of the radar beam to the receiver).
Of particular interest are the two dark patches which represent the effects
of soil moisture (reduces returns) following two local thunderstorms passing
over the plains.
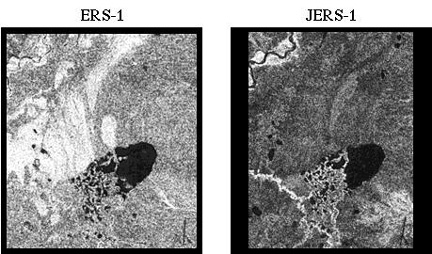
As was put forth in Section
8, radar images made from different bands disclose information in each not expressed
in the same way as in the other(s). Below is a pair of images of the Medicine
Lake area in Alaska west if Fairbanks that were fortuitously imaged 18 minutes
apart by two different satellites. On the left is a ERS-1 radar C-band image;
on the right is a JERS-1 L band image. Note that the ERS-1 image renders some
bogs in bright tones; the JERS-1 image highlights creek beds.
On the next two pages,
we will finish this "multi" survey, starting with the information obtained when
images from different sensors are merged and ending with multitemporal examples.