NASA JPL supplied the C-band instrument pair. The data from 159 orbits (at angles to the equator that allow monitoring the Earth between 65° N and 50° S), at a Shuttle altitude nominally at 233 km (145 miles), extend for each pass over a swath width of 225 km (141 miles), so that continuous operation for 10 days provided nearly total coverage (with some duplication) of the land traversed. Under these conditions, the radar image has a ground resolution of 30 x 30 m and a vertical (elevation) resolution of 16 m (absolute) and 10 m (relative).
Processing the data into a stereo-mode which, through the principle of interferometry, can be converted into elevation differences and then restructured as a DEM data set by incorporating bench marks (known elevation points), is summarized in this diagram (somewhat degraded by low Internet resolution):
In essence, radar holograms from both antennas are generated (and can be converted to images). Then, while still in digital mode, these utilize phase information to construct interferograms (again, displayable as images). After introducing known elevation points to the data set, a digital height model (DEM type) can then be used to contruct a relief or shaded relief image. That can be combined with other data types (e.g., Landsat imagery) or converted to other map forms.
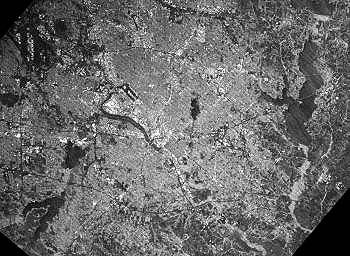
Let us look at a typical C-band image, of an area covering part of Dallas, Texas:
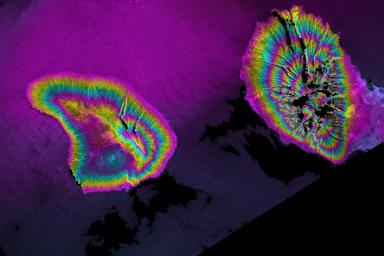
Next, examine this interferogram that shows the distinctive color banding such a data type presents. The two islands are West Maui and Lanai in the Hawaiian chain. Each cycle of colors (from pink to blue to pink) passes through an equal amount of elevation difference (400 m [1300]) in a manner similar to broad contour lines.
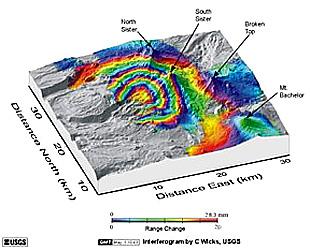
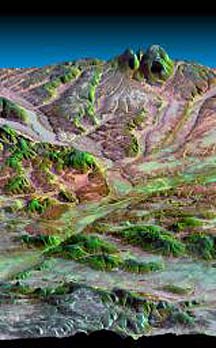
One of the practical uses of SRTM data resides in the monitoring of changes of elevation over time. This can be important as a tool for observing the swelling of a volcano with newly emplaced lavas. This causes the volcanic edifice to undergo upward swelling of the surface. This next illustration shows changes in the surface in and around the Three Sisters, volcanic stratocones in the Oregon Cascades near Bend, OR. To construct the change plot, data from several collection times over an extended period are used.
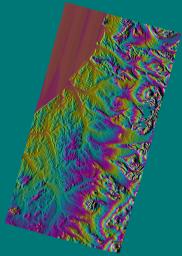
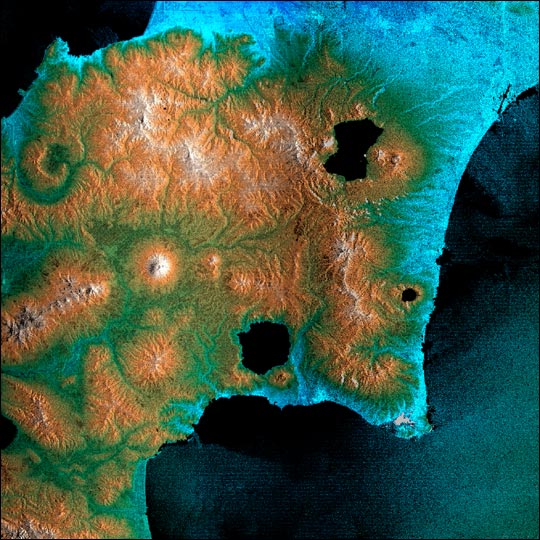
To illustrate some of the different image types derivable from SRTM data, we will display coverage of a pass across the Kamchatka Peninsula, a volcanic mountain chain in eastern Siberia. The first view is the interferogram whose color fringes suggest relief.
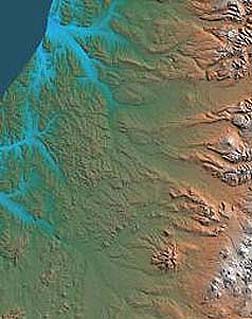
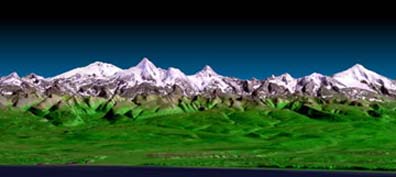
From that, a shaded relief (computer-generated artificial light imposes a pattern of shadow and light) and a shaded relief perspective view are derived:
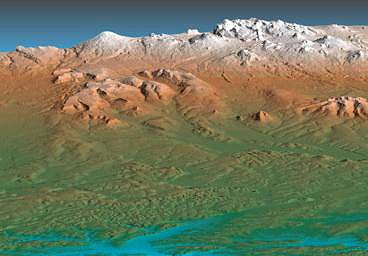
When SRTM data are combined with Landsat, these views of the Kamchatka mountains ensue:
Still another SRTM example from the same part of the World is Hokkaido Island in Japan, with its active volcano, USU.
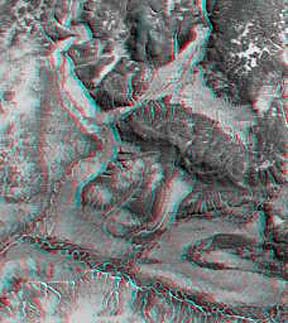
A special type of stereo image known as an analglyph is made by projecting one of the image pair through red and the other through blue filters to give the resulting superimposed image. To see relief in stereo, for this segment of the Kamchatka peninsula, a pair of glasses made usually of cardboard with the right eye opening covered by red cellophane and the left with blue are needed. A few users of this Tutorial may have one from a 3-D movie experience or can make the glasses in the obvious way.
The X-band radar on SRTM is
provided and managed by DLR - the Deutches Fernerkundungs-datenzentrum (the German
Aerospace Center). Its antenna setup is similar to JPL's C-band system, the difference
being that the antenna in the Shuttle Bay is fixed to look straight down, rather
than inclined. Thus its swath width is 50 km. Data processing to produce elevation
maps is essentially the same. Here is an X-band image of part of the Kamchatka
Peninsula; the highest point in the mountains is 4755 m (15690 ft):
For those interested in
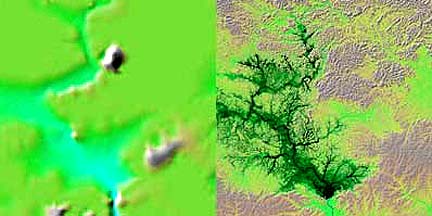
additional information and updates and more imagery, tie into the JPL and German Aerospace SRTM Web sites. How much of an improvement
in small-scale map quality in those parts of Earth where topographic maps are
lacking in details found in, say, coverage of the United States? This next image
is convincing: on the left is a colorized map of the Uatuma River Basin near
Manaus in eastern Brazil based on the best elevation data available; on the
right is a SRTM image processed to display the optimum topographic representation
extractable from the radar data. The black areas in the map on the right depict
the water buildup in Lake Balbina created by damming the river.
Follow-up programs are
"in the works" to use radar interferometry and laser profiling to continually
upgrade topographic/elevation mapping of the entire world.