
|

|

|

WATER QUALITY VARIATIONS IN THE LAKES OF MYSORE DISTRICT, KARNATAKA
S.M. Yamuna1 and A. Balasubramanian1

|
|
|
|
 ABSTRACT
INTRODUCTION
GEOLOGY
SOIL
CLIMATE AND RAINFALL
DRAINAGE
METHODS OF STUDY
TABLE 1: CHEMISTRY OF WATER ANALYSED FROM THE LAKES OF MYSORE DISTRICT
TABLE 2: QUALITY OF WATER IN SELECTED LAKES OF MYSORE DISTRICT AS COMPARED WITH THE WORLD STANDARDS
RESULTS AND DISCUSSION
CONCLUSION
ACKNOWLEDGEMENT
REFERENCES
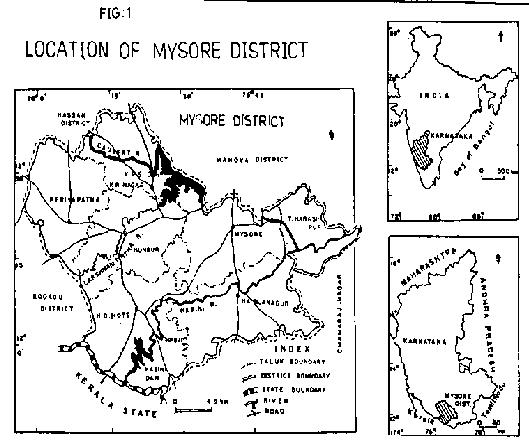
FIGURE-1: LOCATION OF MYSORE DISTRICT
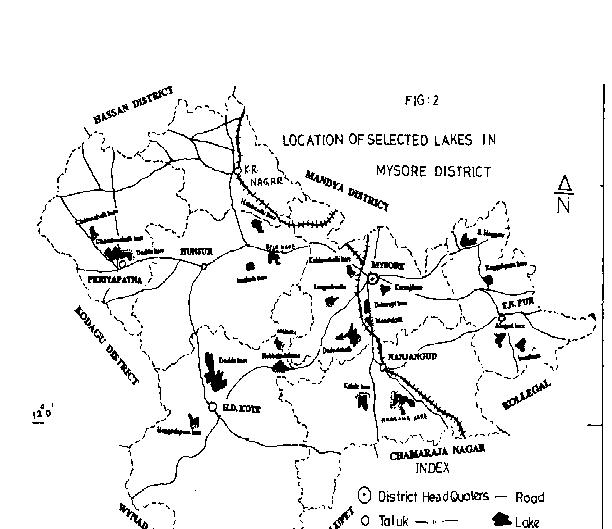
FIGURE-2: LOCATION OF SELECTED LAKES IN MYSORE DISTRICT
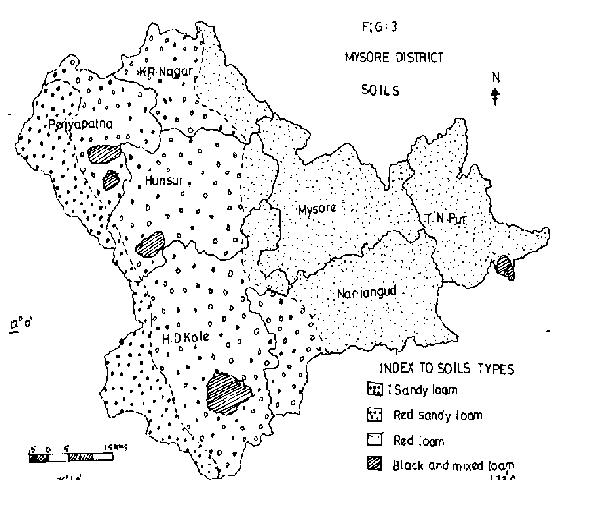
FIGURE-3: MYSORE DISTRICT SOILS
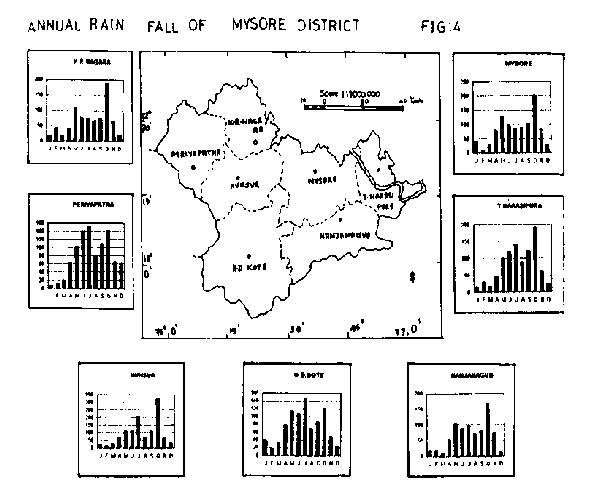
FIGURE-4: ANNUAL RAIN FALL OF MYSORE DISTRICT
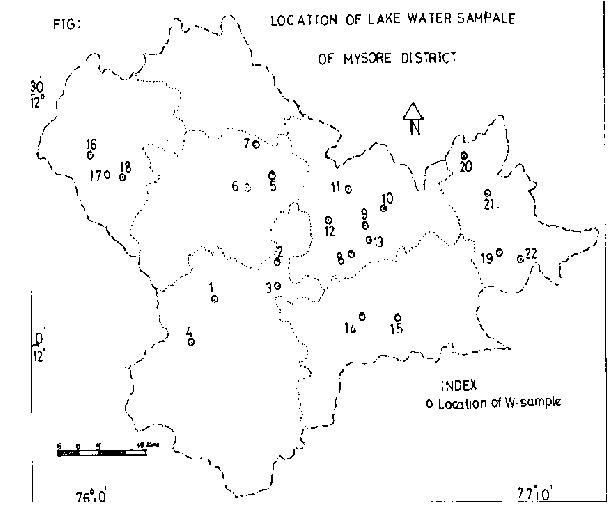
FIGURE-5: LOCATION OF LAKE WATER SAMPLE OF MYSORE DISTRICT
ABSTRACT
INTRODUCTION
GEOLOGY
SOIL
CLIMATE AND RAINFALL
DRAINAGE
METHODS OF STUDY
TABLE 1: CHEMISTRY OF WATER ANALYSED FROM THE LAKES OF MYSORE DISTRICT
TABLE 2: QUALITY OF WATER IN SELECTED LAKES OF MYSORE DISTRICT AS COMPARED WITH THE WORLD STANDARDS
RESULTS AND DISCUSSION
CONCLUSION
ACKNOWLEDGEMENT
REFERENCES
FIGURE-1: LOCATION OF MYSORE DISTRICT
FIGURE-2: LOCATION OF SELECTED LAKES IN MYSORE DISTRICT
FIGURE-3: MYSORE DISTRICT SOILS
FIGURE-4: ANNUAL RAIN FALL OF MYSORE DISTRICT
FIGURE-5: LOCATION OF LAKE WATER SAMPLE OF MYSORE DISTRICT
| ABSTRACT: |


|
The biological wealth of a lake is mainly dependent on its water quality. The chemical nature of pollutants and sediments entering into the system from various sources is the major problem of medium and minor lakes located in several parts of India. This study highlights the quality of water analysed with reference to various physico-chemical parameters in selected lakes of Mysore District, Karnataka. The major ions present in the lake water have been analysed. The lakes are found to be under the influence of major parameters like nitrate, pH, chloride, Total dissolved solids (TDS), calcium and magnesium. In many samples, two or more parameters have been reported above the permissible limit of drinking water. The conservation measures for maintaining the quality of water in these lakes have been discussed.
| INTRODUCTION: |
|
Mysore is one of the famous tourist centres of Asia, located between latitude 11�45' to 12�40' N and longitude 75�57' to 77�15' E. The district covers an area of about 6940 sq.km and is accessible from several parts of the world (Fig.1). It has many small and medium natural and artificial lakes. The lakes are the source for drinking, washing, irrigation, entertainment, etc. The continued anthropogenic activity in and around the lakes has not only caused environmental pollution but has also contributed to their rapid degradation. There are seven taluks in Mysore District, namely, Hunsur, K.R. Nagar, Periyapatna, Heggadadevana kote, Mysore, Nanjangud and T.N. Pur. Twenty-two lakes have been considered for the present study. They are Doddakere (H.D.Kote), Erekatte, Hbbalada katte, Heggadapura kere, Bili kere, Jinahalli kere, Halebeedu kere, Dadadahalli kere, Dalavayi kere, Karanji kere, Kukkarahalli kere, Mandakalli kere, Kalale kere, Arasana kere, Chittenahalli kere, Choudanahalli kere, Doddakere, Alagudu kere, Bannuru heggere, Kaggalipura kere and Kuruburu kere. "Kere" in Kannada means 'pond or a lake' (Fig.2).
| GEOLOGY: |
|
Karnataka State is a precambrian hard rock terrain encompassing major crystalline rocks like granites, gneisses, schists, amphibolites, limestone, pyroxenites and dunites. The schists, amphibolites etc. belong to Dharwar series and occur as thin bands and lenses. This series contains economically important minerals like magnesite, chromite, graphite, garnet, corundum and soapstones. Gneissic rocks cover a major part of the Mysore District. The gneisses are weathered, fractured and jointed. The gneisses are weathered up to a depth of 3 to 10 m (Radhakrishna B.P and Vaidyanandan R., 1994).
| SOIL: |
|
The district as a whole is characterised by red loamy soil. This soil is derived from granites and gneisses. The soluble salt contents are normal and the organic matter contents are high. The percentage of phosphorous is poor and soils contain variable amounts of potassium. The thickness of the soil varies from place to place, not exceeding 0.3m in some places. The valley portions are covered with rich black silty soil. Fig.3 shows the soil types of the district.
| CLIMATE AND RAINFALL: |
|
The annual rainfall is 580mm distributed over 42 rainy days. In a normal year, good showers can be expected in the months of May, September and October. The rainfall from December to March is negligible. The average annual rainfall recorded here from 1991 to 1999 is shown in the graph. April is the hottest month of the year with a mean maximum temperature of 35�C, while January and December are the coldest months with mean minimum temperature of 15.5�C and 15.8�C respectively. Fig.4 shows the distribution of rainfall observed in several parts of the district. Mysore district experiences the following seasons:
|
Months |
Season |
|
December-February |
Dry with clear bright weather |
|
March-May |
Hot |
|
June-October |
South-West monsoon |
|
November |
Post monsoon/retreating |
| DRAINAGE: |
|
The drainage comprises mainly a part of the Cauvery river basin with Kabini and Lakshmana theertha as its tributaries. All of them are flowing towards east. The outlets of the lakes considered here feed most of these major rivers.
| METHODS OF STUDY: |
|
Water samples were systematically collected at 44 locations using Nansen bottle. The characteristics of the surface water may be different from that collected from the bottom. Therefore the samples have been collected at a depth between the surface and the bottom. These samples have been subjected to chemical analysis following the ISI (1964) and APHA (1976) methods. The following physico - chemical characteristics were analysed: pH, Ec, TDS, SO4, Ca, Mg, HCO3, CO3, Na, K, COD, BOD, NO3 and Cl. The results are tabulated in Table 1. The chemical quality of water has been compared with the standards of WHO (1984).
| TABLE 1: CHEMISTRY OF WATER ANALYSED FROM THE LAKES OF MYSORE DISTRICT |
|
|
Sl.No |
Location |
pH |
Ec |
TDS |
SO4 |
Ca |
Mg |
HCO3 |
CO3 |
Na |
K |
COD |
BOD |
NO3 |
Cl |
|
H.D. Kote |
|
|
|
|
|
|
|
|
|
|
|
|
|
|
|
|
1 |
Dodda Kere |
8.64 |
544 |
394 |
8 |
74 |
166 |
264 |
20 |
111 |
2 |
24 |
5 |
3.0 |
40 |
|
2 |
Erekatte |
8.74 |
567 |
408 |
10 |
75 |
125 |
238 |
32 |
164 |
5 |
28 |
6 |
2.6 |
110 |
|
3 |
Hbbalada katte |
8.61 |
506 |
360 |
6 |
70 |
128 |
196 |
16 |
45 |
2 |
23 |
5 |
2.4 |
60 |
|
4 |
Heggadapura kere |
8.62 |
438 |
304 |
30 |
64 |
88 |
174 |
12 |
104 |
6 |
34 |
8 |
2.6 |
60 |
|
|
HUNSUR |
|
|
|
|
|
|
|
|
|
|
|
|
|
|
|
5 |
Bili kere |
8.22 |
102 |
70 |
4 |
22 |
34 |
50 |
Trace |
4 |
6 |
21 |
6 |
1.1 |
60 |
|
6 |
Jinahalli kere |
7.67 |
241 |
166 |
4 |
56 |
44 |
112 |
Trace |
16 |
13 |
239 |
48 |
1.4 |
55 |
|
7 |
Halebeedu kere |
8.8 |
263 |
182 |
4 |
58 |
66 |
138 |
12 |
29 |
2 |
12 |
2 |
1.4 |
65 |
|
|
MYSORE |
|
|
|
|
|
|
|
|
|
|
|
|
|
|
|
8 |
Dadadahalli kere |
8.93 |
871 |
630 |
8 |
114 |
204 |
358 |
48 |
118 |
11 |
26 |
4 |
3.9 |
70 |
|
9 |
Dalavayi kere |
9.44 |
728 |
548 |
12 |
24 |
36 |
228 |
120 |
206 |
14 |
248 |
56 |
3.3 |
68 |
|
10 |
Karanji kere |
8.81 |
300 |
216 |
11 |
56 |
60 |
120 |
12 |
31 |
15 |
29 |
5 |
1.8 |
75 |
|
11 |
Kukkarahalli kere |
8.1 |
155 |
106 |
6 |
32 |
28 |
64 |
Trace |
18 |
6 |
32 |
8 |
1.3 |
105 |
|
12 |
Lingambudhi kere |
8.71 |
865 |
638 |
41 |
58 |
208 |
262 |
24 |
134 |
8 |
35 |
9 |
3.3 |
98 |
|
14 |
Kalale kere |
8.42 |
80 |
52 |
1 |
24 |
14 |
40 |
Trace |
2 |
1 |
14 |
2 |
1.0 |
73 |
|
15 |
Arasana kere |
8.74 |
408 |
60 |
15 |
105 |
22 |
45 |
Trace |
26 |
7 |
23 |
15 |
3.7 |
81 |
|
|
PERIYA PATNA |
|
|
|
|
|
|
|
|
|
|
|
|
|
|
|
16 |
Chittena Halli kere |
7.77 |
632 |
452 |
44 |
84 |
120 |
226 |
Trace |
186 |
7 |
45 |
11 |
2.9 |
73 |
|
17 |
Choudana Halli kere |
8.3 |
517 |
370 |
9 |
72 |
122 |
192 |
4 |
103 |
6 |
20 |
3 |
2.3 |
55 |
|
18 |
Doddakere |
8.34 |
440 |
318 |
15 |
72 |
88 |
154 |
4 |
79 |
3 |
28 |
6 |
2.0 |
50 |
|
|
T.N. PUR |
|
|
|
|
|
|
|
|
|
|
|
|
|
|
|
19 |
Alagudu kere |
8.42 |
207 |
150 |
3 |
40 |
60 |
110 |
8 |
18 |
1 |
22 |
6 |
1.3 |
48 |
|
20 |
Bannuru heggere |
7.52 |
1030 |
758 |
Trace |
92 |
76 |
56 |
Trace |
31 |
4 |
30 |
7 |
3.4 |
40 |
|
21 |
Kaggalipura kere |
8.3 |
337 |
242 |
8 |
36 |
76 |
164 |
Trace |
95 |
3 |
25 |
6 |
3.0 |
61 |
|
22 |
Kuruburu kere |
8.12 |
258 |
180 |
5 |
64 |
46 |
152 |
Trace |
40 |
3 |
117 |
20 |
1.5 |
43 |
| TABLE 2: QUALITY OF WATER IN SELECTED LAKES OF MYSORE DISTRICT AS COMPARED WITH THE WORLD STANDARDS |
|
|
S.No |
Parameter |
Max |
Min |
Mean |
USPH Standard |
ISI Standard |
WHO Highest desirable |
Standard Maximum Permissible |
|
1 |
pH |
9.44 |
7.52 |
8.46 |
6-8.5 |
6-9 |
7-8 |
6.5-9.2 |
|
2 |
Eh |
1030 |
80 |
469.32 |
30 |
- |
- |
- |
|
3 |
TDS |
638 |
52 |
328.18 |
500 |
500 |
500 |
1500 |
|
4 |
SO4 |
44 |
1 |
11.59 |
250 |
Upto 150 |
200 |
400 |
|
5 |
Ca |
126 |
22 |
64.45 |
100 |
- |
75 |
200 |
|
6 |
Mg |
194 |
14 |
91.14 |
30 |
- |
30 |
150 |
|
7 |
HCO3 |
358 |
40 |
164.48 |
- |
- |
- |
- |
|
8 |
CO3 |
120 |
Traces |
16.72 |
- |
- |
- |
- |
|
9 |
Na |
206 |
4 |
76.36 |
- |
- |
- |
- |
|
10 |
K |
15 |
1 |
6.22 |
- |
- |
- |
- |
|
11 |
COD |
248 |
12 |
51.09 |
4.0 |
- |
10 |
- |
|
12 |
NO3 |
3.9 |
1 |
2.41 |
<10 |
- |
45 |
- |
|
13 |
BOD |
48 |
2 |
11.27 |
5.0 |
- |
6.0 |
- |
|
14 |
Cl |
110 |
40 |
63.77 |
250 |
- |
200 |
600 |
| RESULTS AND DISCUSSION: |
|
| CONCLUSION: |
|
| ACKNOWLEDGEMENT: |
|
| REFERENCES: |
|
| FIGURE-1: LOCATION OF MYSORE DISTRICT |
|
| FIGURE-2: LOCATION OF SELECTED LAKES IN MYSORE DISTRICT |
|
| FIGURE-3: MYSORE DISTRICT SOILS |
|
| FIGURE-4: ANNUAL RAIN OF MYSORE DISTRICT |
|
| FIGURE-5: LOCATION OF LAKE WATER SAMPLE OF MYSORE DISTRICT |
|
| Address: |
|
1.) Department of Studies in Geology,
Manasagangotri,
Mysore - 6
|
|
|