
|

|

|

IMPROVED SOLID WASTE MANAGEMENT SYSTEM IN THE CATCHMENT AREA
R. Sathiskumar1 and T.V. Ramachandra1

|
|
|
|
 ABSTRACT
INTRODUCTION AND BACKGROUND
STUDY AREA
NATURE OF WASTES
OBJECTIVE
METHODOLOGY
IDENTIFICATION OF SOURCES (DUST BINS) & MAJOR CONSTITUENTS OF THE WASTE:
TOTAL WEIGHT AND VOLUME OF WASTE PER DAY
BUILDING SPATIAL DATA
ESTIMATING TOTAL QUANTITY OF LITTER
FINDING SHORTEST ROUTE FOR COLLECTION VEHICLE
APT LOCATION, DESIGN AND SIZE OF BIN
RESULTS
TABLE 1: DISTRIBUTION OF DUSTBINS AND TYPES OF BINS
TABLE 2: DENSITIES OF MAJOR CONSTITUENTS OBTAINED FROM FIELD INVESTIGATION
TABLE 3: VISUAL EXPERIMENT RESULTS (OBSERVATION MADE FOR 123 BINS)
OBSERVED FIELD VOLUMES CONVERTED INTO WEIGHTS USING FIELD DENSITY
TABLE 4: DIRECT WEIGHING OF WASTE EXPERIMENT RESULTS (OBSERVATION MADE IN 25 BINS AND EXTRAPOLATED TO 140 LOCATIONS INCLUDING OPEN DUMPS)
TABLE 5: REGRESSION ANALYSIS RESULTS
TABLE 6: ZONEWISE QUANTITY OF DIFFERENT WASTES GENERATED PER DAY
TABLE 7: RESULTS OF LITTER QUANTIFICATION BASED ON TREE DENSITY
TABLE 8: RATE OF GENERATION/DAY IN ALL CONCRETE, STONE AND CUBIC BINS
SPATIAL OUTPUT RESULT
DISCUSSION AND CONCLUSIONS
REFERENCE
FIGURES-1 TO 4
FIGURES-5 TO 8
FIGURE-9 TO 12
ABSTRACT
INTRODUCTION AND BACKGROUND
STUDY AREA
NATURE OF WASTES
OBJECTIVE
METHODOLOGY
IDENTIFICATION OF SOURCES (DUST BINS) & MAJOR CONSTITUENTS OF THE WASTE:
TOTAL WEIGHT AND VOLUME OF WASTE PER DAY
BUILDING SPATIAL DATA
ESTIMATING TOTAL QUANTITY OF LITTER
FINDING SHORTEST ROUTE FOR COLLECTION VEHICLE
APT LOCATION, DESIGN AND SIZE OF BIN
RESULTS
TABLE 1: DISTRIBUTION OF DUSTBINS AND TYPES OF BINS
TABLE 2: DENSITIES OF MAJOR CONSTITUENTS OBTAINED FROM FIELD INVESTIGATION
TABLE 3: VISUAL EXPERIMENT RESULTS (OBSERVATION MADE FOR 123 BINS)
OBSERVED FIELD VOLUMES CONVERTED INTO WEIGHTS USING FIELD DENSITY
TABLE 4: DIRECT WEIGHING OF WASTE EXPERIMENT RESULTS (OBSERVATION MADE IN 25 BINS AND EXTRAPOLATED TO 140 LOCATIONS INCLUDING OPEN DUMPS)
TABLE 5: REGRESSION ANALYSIS RESULTS
TABLE 6: ZONEWISE QUANTITY OF DIFFERENT WASTES GENERATED PER DAY
TABLE 7: RESULTS OF LITTER QUANTIFICATION BASED ON TREE DENSITY
TABLE 8: RATE OF GENERATION/DAY IN ALL CONCRETE, STONE AND CUBIC BINS
SPATIAL OUTPUT RESULT
DISCUSSION AND CONCLUSIONS
REFERENCE
FIGURES-1 TO 4
FIGURES-5 TO 8
FIGURE-9 TO 12
| ABSTRACT: |


|
Day to day management of solid wastes produced by the community is one of the fastest growing problems in developing countries like India. Prevailing management strategies are inefficient, because of their complexity, cost and lack of technology, which ignore solid waste management's socio-economic and ecological characteristics. Improper management of these wastes lead to public health hazards, unaesthetic appearance, pollution of water bodies such as lakes, groundwater sources, etc. Most parts of India are not efficient in handling wastes when compared to developed countries. In order to improve the present practice and to avoid environmental degradation, an effort is made to arrive at optimal solid waste management strategy by incorporating spatial analysis tool (Geographic Information System). This study was carried out at the Indian Institute of Science (IISc) campus, Bangalore, India. The sprawling campus of 180 hectares forms a part of Sankey lake catchment. The interdisciplinary activities in the campus (40 departments, 400 faculty members, 800 supporting staff, 1500 students and 450 residential houses) generate various kinds of wastes ranging from paper, plastic materials, to metal, glass, construction debris, hazardous wastes, etc. Quantification of various wastes from different sectors was done through field investigations covering collection mechanism, primary constituents, rates of generation, etc. Apart from this, litter generated in vegetated areas has been quantified through landuse analysis. Land cover analyses revealed 45% of the total area under tree vegetation. In order to quantify the litter produced, stratified random sampling strategy was adopted with 1-sq. m study plots all over the study area. Optimal management strategy of all kinds of wastes is proposed with these attribute information and various layers of spatial information i.e., road network, distribution of bins, type of bins, land use, topography and drainage network. The proposed management strategy could be replicated to any population size.
| INTRODUCTION AND BACKGROUND: |
|
From ancient times, humans and animals have used the resources of the earth to support life and to dispose wastes. In the primitive society, disposal of human and other wastes did not pose significant problems, for the population was very small and the amount of land available for the assimilation of wastes was large. But these days the burgeoning problem of solid wastes is being given serious consideration everywhere. Rapid population growth and uncontrolled industrial development are seriously degrading the urban and peri-urban environment in many developing countries, placing enormous strain on natural resources, and undermining efficient and sustainable development (UNCHS, 1994).
The purpose of the solid waste management (SWM) exercise is to help improve the poor management practices prevailing in many low income countries where this subject has received scant attention compared to other aspects of infrastructure such as water supply and transport (B.B.Jana et al, 2000). It is a multi-disciplinary field embracing waste collection, transfer, haulage and disposal and its impacts are wide. It is therefore important to take a broad view and not to consider disposal options within the narrow confines of a particular technology. This work is drawn from the available literature and lays particular emphasis on the principle of building on existing capacity of waste managing authorities.
An effort was made to study and improve solid waste management practice of a small community (Indian Institute of Science, Bangalore) whose waste generation resembles a typical urban community, so that the proposed strategies could be replicated in large communities and townships. Optimal solid waste management strategies of many kinds of wastes are proposed by incorporating spatial analysis tools, (Geographic Information System), constituting a framework for efficient planning. Suggestions endeavoring source segregation, designing collection systems, usage of organic wastes for production of biogas and fertilizer, hazardous waste management, safe disposal options etc have been evolved.
| STUDY AREA: |
|
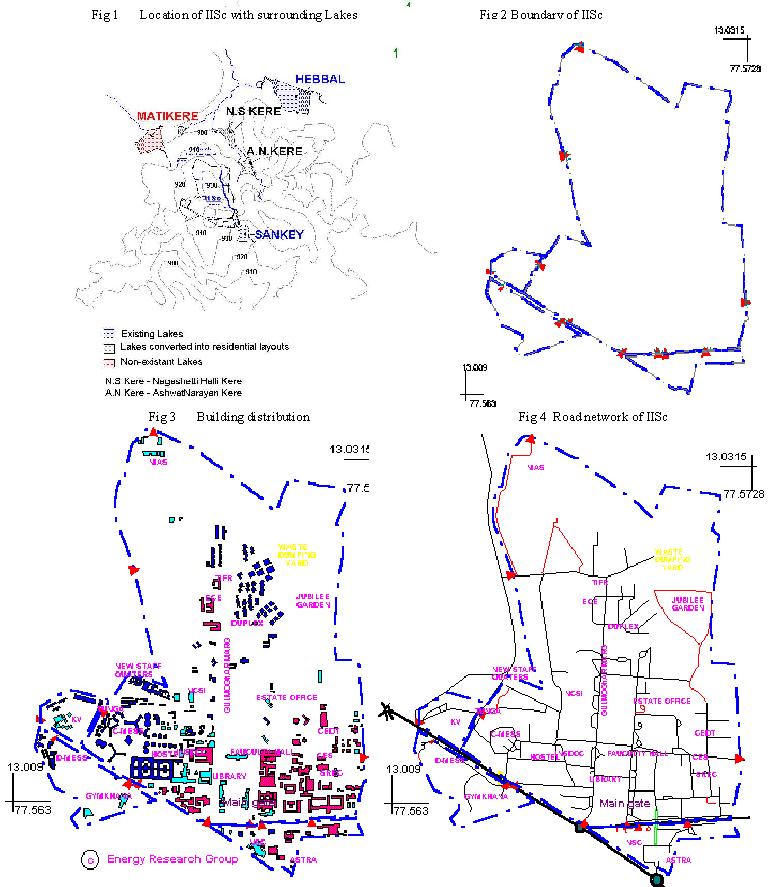
IISc (Indian Institute of Science) campus limits, identified for the present study, are enclosed within 13.010550 to 13.020830 E latitude and 77.559440 to 77.573880 N longitude. The area falls in the 57G/12 of Survey of India (SOI) toposheets of scale 1:50000 and 57/G scale 1:250,000. IISc is located in northern part of Bangalore city having lush vegetation and the campus has canopy of trees covering the buildings. The campus, consisting of five bounds, covers an area of 180 hectares. The main campus covers around 150 hectares. The altitude varies from 914 to 942 m (mean sea level). The natural terrain of the campus is rolling and provides good natural drainage. Eastern part of the campus forms the major portion of the catchment of Sankey lake located to the Southeast of the campus (Fig 1). A large drain running all along the eastern side of the campus forms the main feeder of the Sankey lake.
The study was taken up to explore the present waste handling practices within the campus with various interdisciplinary activities (40 departments, 400 faculty members, 800 supporting staff, 1500 students and 450 residential houses) representing a typical urban community. The institute has all kinds of wastes arising from residential, commercial, educational, open and vegetated areas.
| NATURE OF WASTES: |
|
The following nature of the wastes is generated in the campus.
| OBJECTIVE: |
|
| METHODOLOGY: |
|
The present study proposes the optimal management strategies of solid waste in the campus. In order to achieve the objectives listed above, the determination of the following parameters is vital.
| IDENTIFICATION OF SOURCES (DUST BINS) & MAJOR CONSTITUENTS OF THE WASTE: |
|
An exploratory field investigation was carried out to find the type and number of dustbins and bins were monitored for seven days. Numbers were assigned to all the dustbins and were written on the dustbin and approximate quantity and major constituents of dustbins were noted down by observing visually in order to arrive at the major constituents that were present regularly. This gave an idea of the bins and their dynamics (regularly cleared and filled bins). Table 1 lists number of bins, spatial distribution and types of dustbins. After repeating the experiments thrice, it was observed that the major constituents fell into four major classifications; paper and paper products, plastic and plastic products, leafy matter and domestic wastes.
| TOTAL WEIGHT AND VOLUME OF WASTE PER DAY: |
|
In order to quantify wastes collected at each bin both visual (volume estimation) and weighing experiments were carried out. In the visual experiment, daily variation of volume of dustbin and approximate percentage of constituents were noted. Initially this was done for seven days covering all types of bins spread over the campus. The quantum of wastes collected at green bins was very less; hence further investigations were carried out in 128 bins (excluding green bins) for 15 days. This was repeated thrice in order to take in to account daily, weekly and seasonal variation. Visual volumes observed per bin were later converted in to equivalent weights taking in to consideration the density of materials (composition of wastes - paper, plastic, etc.).
In order to verify the reliability of visual experiments (to quantify wastes), mass of constituent solid wastes were computed by actual measurements (using a balance of 100kg and sensitivity of 0.5 kg.) for five days in selected sample bins (25 bins spread all over the campus covering all communities and all activities). Sample bins were selected taking in to account the constituents and frequency of wastes generated in bins. Since there was a lot of variation in the visual and corresponding weighing experiments, this experiment was repeated again and was monitored for 15 days. This helped in arriving at the relationship among the variables (for each constituent) got from visual and weighing experiments. Based on correlation coefficient and standard error the best relationship was chosen. This relationship was used to quantify the wastes of all bins in the campus (bins monitored visually, considering volume of wastes).
| BUILDING SPATIAL DATA: |
|
Integrating spatial analysis tool with management issues is a vital part of this study. Geographical Information System (GIS) software Mapinfo5.5 was used to create various vector layers from the Survey of India (SOI) toposheets of scale 1:1000. Digitized vector layers include
1. The spatial information of base layers (boundary, road network, distribution of buildings and dustbins) is generated using SOI maps of scale 1:1000 and field data collection. The vector layers of boundary, road network, buildings and dustbins were overlaid for further analyses.
2. NDVI with IRS 1C multi-spectral data were computed for land cover analyses.
3. Land use is done with the mapping of trees, buildings, etc. on the campus with the help of Global Positioning System (GPS). The campus is divided in to one-hectare grids to carry out vegetation analyses. Various vegetation indices [such as species density, tree density, diversity indices (Shannon-wiener and Simpson's indices), evenness index] were calculated for each grid (Raja Raja Varma Murari, 1999).
4. By overlaying these vegetation indices layers with equal weightage per layer, the entire campus forms 15 zones. These zones correspond to the present land use pattern.
5. Distribution of bins in each zone and present collection routes was mapped.
6. Using the zone map and corresponding attribute data related to bins (such as total quantity and type of solid waste generated per day), a thematic map was created to get an overall idea of zones and their contribution in the total solid wastes generated in the campus.
7. With this spatial and attribute database the feasibility options of solid waste management and aspects of recycling were explored.
| ESTIMATING TOTAL QUANTITY OF LITTER: |
|
Usually, to estimate (Shailaja and Sudha, 1997) litter quantity, litter traps covering at least 10 percent of the total area should be taken as the study area. This litter trap method is not effective for larger area and not practical. In this study, a new approach is made to estimate the litter quantity for entire campus considering tree species density by stratified random sampling of sample plots of 1 sq. metre covering all vegetated area. The average value is computed for each study plot, which is extrapolated to entire IISc campus based on tree and species density. For this extrapolation tree density per hectare was computed and from the primary data of study plot, litter generated and number of trees in the study plot and litter quantity per tree was computed. Results are shown in Table 5. The leaf litter quantification was done taking into account the removal of moisture content and woody branches.
| FINDING SHORTEST ROUTE FOR COLLECTION VEHICLE: |
|
Efficient routing and rerouting of solid waste collection vehicles can decrease costs by reducing the labor expended for the collection. Routing procedures usually consists of two separate components: micro routing and macro routing (EPA, 1995).
Macro routing, also referred to as route balancing, consists of dividing the total collection area into routes sized in such a way so as to represent one day's collection for one crew. The size of each route depends on the amount of waste collected per stop, distance between stops, loading time, and traffic conditions.
Micro routing can define the specific route the collection vehicle should follow. The method selected for micro routing must be simple enough to use route balancing when system changes occur or to respond to seasonal variations in the rate of waste generation.
Theoretically provided optimal routing may not be apt for the local conditions. Consideration should be given to experienced collection vehicle drivers. In the IISc scenario, preference is given to collection of organic matter in order to avoid unaesthetic appearance, foul smell, animal problems and late transferring to biogas plant. Routing has been suggested in such a way that zones with more domestic wastes is attended first without overlapping and covering all zones. The corresponding micro routing for locations in each zone is left as it is, considering experience of collection workers.
| APT LOCATION, DESIGN AND SIZE OF BIN: |
|
In order to improve the existing collection system, it is necessary to rectify the problems associated with bins, which spoil the present management. All the bins in the campus are not handy for rapid and clean collection. Many of the concrete bins are currently broken, turned over and improperly used. The number of bins in a location is not uniform, and due to the inadequate volume of the bins, they are scattered here and there in a single location. The volume of existing bins is sometime insufficient and there is a need to arrive at a volume that suits all locations and all kinds of wastes.
Only concrete, cubic and stone bins were considered, as the generation pattern of these bins was similar. The maximum and average generation of waste between clearances is calculated for all concrete bins present in all zones, according to which the volume for all new bins could be generated. Table 8 shows the average rate of generation/day in all concrete, stone bins and cubic bins.
Presently, among all the bins, concrete, cubic and stone bins are open to problems of odour, nuisance due to animals and unaesthetic appearance. They need to be modified in such a way that they help in rapid collection system. Taking into account factors such as durability, compatibility, easy handling and reuse the bins made up of high-density polyethylene (HDPE) or polyvinyl chloride (PVC) would be preferable.
| RESULTS: |
|
Extensive field investigations of all locations were made to identify all sources (dust bins). Table 1 shows the spatial distribution of dustbins and types of bins. Four cycles of visual experiments and two cycles of weighing experiments enabled an accurate prediction of weight and volume produced in the campus. Table 2 shows the densities of the various constituents, which were obtained, directly from the field. Table 3 shows the results of four cycles of visual experiment using field densities. Table 4 shows the results of weighing experiments, which helped to derive a relationship between visual and actual weight. Table 5 depicts the regression analysis and results.
The results obtained from first three cycles of experiments show considerable variation between visual and weighing experiments. Consistency was achieved in the fourth cycle experiments, which coincided with the new academic year. Fourth cycle experiment results are listed in Table 5. This helped in arriving at average total weight produced per day and weight of each component, for further decision-making and comments. Table 6 shows the zone wise quantity of waste components, which explores the feasibility options of management and recycling aspects. Litter quantification with the new approach, explores available bio-resource in the form of litter and the results are shown in Table 7. Table 8 shows the rate of generation/day in all concrete, stone and cubic bins.
| TABLE 1: DISTRIBUTION OF DUSTBINS AND TYPES OF BINS |
|
|
ZONE NO |
CON |
SB |
HUT |
CUB |
STB |
OD |
OTHER |
TOTAL |
|
1 |
25 |
22 |
1 |
1 |
1 |
1 |
- |
50 |
|
2 |
28 |
19 |
5 |
1 |
3 |
5 |
- |
61 |
|
3 |
11 |
19 |
3 |
1 |
- |
- |
1 |
35 |
|
4 |
11 |
8 |
1 |
1 |
- |
- |
- |
21 |
|
5 |
10 |
2 |
- |
- |
- |
1 |
- |
13 |
|
6 |
2 |
0 |
- |
- |
- |
- |
- |
2 |
|
7 |
2 |
2 |
2 |
1 |
- |
- |
- |
7 |
|
8 |
27 |
- |
- |
- |
- |
- |
- |
27 |
|
9 |
0 |
- |
- |
- |
- |
- |
- |
0 |
|
10 |
0 |
- |
- |
- |
- |
- |
- |
0 |
|
11 |
0 |
- |
- |
- |
- |
- |
- |
0 |
|
12 |
8 |
17 |
- |
- |
1 |
- |
1 |
27 |
|
13 |
4 |
0 |
- |
- |
- |
- |
- |
4 |
|
14 |
4 |
1 |
- |
- |
- |
- |
- |
5 |
|
15 |
4 |
4 |
- |
- |
- |
- |
- |
8 |
|
141 |
95 |
12 |
5 |
5 |
7 |
2 |
267 |
| TABLE 2: DENSITIES OF MAJOR CONSTITUENTS OBTAINED FROM FIELD INVESTIGATION |
|
|
Sno |
Constituents |
Density |
|
Kg/m3 |
||
|
1 |
Paper |
90 |
|
2 |
Plastics |
65 |
|
3 |
Leafy matter |
60 |
|
4 |
Domestic waste |
300 |
| TABLE 3: VISUAL EXPERIMENT RESULTS (OBSERVATION MADE FOR 123 BINS) OBSERVED FIELD VOLUMES CONVERTED INTO WEIGHTS USING FIELD DENSITY |
|
|
S |
Parameter |
I cycle |
II cycle |
III cycle |
IV cycle |
|
No |
Period |
from 17/6 to23/6 |
from 28/6 to12/7 |
From 27/7 to 10/8 |
from 4/9 to 19/9 |
|
1 |
Total volume (m3/d) |
39 |
31 |
21 |
27 |
|
2 |
Total weight (kg/d) |
4900 |
3240 |
2220 |
3030 |
|
3 |
Weight/bin (kg/d) |
19 |
24 |
17 |
23.8 |
|
4 |
Paper (kg/d) |
1400 |
1147 |
582 |
556 |
|
5 |
Plastic (kg/d) |
620 |
598 |
398 |
136 |
|
6 |
Leaf (kg/d) |
405 |
240 |
320 |
761 |
|
7 |
Domestic waste (kg/d) |
2475 |
1255 |
920 |
1577 |
| TABLE 4: DIRECT WEIGHING OF WASTE EXPERIMENT RESULTS (OBSERVATION MADE IN 25 BINS AND EXTRAPOLATED TO 140 LOCATIONS INCLUDING OPEN DUMPS) |
|
|
Sno |
Parameters |
I cycle |
II cycle |
|
period |
from 8/8 to12/8 |
From 9/9 to23/9 |
|
|
1 |
Total weight (kg/day) |
433 |
595 |
|
2 |
Paper (kg/day) |
197 |
190 |
|
3 |
Plastics (kg/day) |
36 |
25 |
|
4 |
Leaf (kg/day) |
73 |
240 |
|
5 |
Domestic wastes (kg/day) |
91 |
130 |
|
6 |
Others (kg/day) |
36 |
20 |
|
7 |
Weight in kg/bin/day |
3.3 |
4.25 |
Correlating weights obtained by visual experiment and direct weighing experiments the following relationship was obtained by regression analysis.
Eg. PAPER
Actual weight of paper =0.2682*(visual weight of paper)+0.393
Using the above equation the actual weight of each component is known and final values are considered for further analysis.
| TABLE 5: REGRESSION ANALYSIS RESULTS |
|
|
S |
Constituents |
Weighing |
Visual |
Using |
|
No |
Period |
II cycle |
IV cycle |
regression |
|
from 9/9 to 23/9 |
from 4/9 to 19/9 |
analysis |
||
|
1 |
Paper (kg/day) |
190 |
556 |
170 |
|
2 |
Plastic (kg/day) |
25 |
136 |
89 |
|
3 |
Leaf (kg/day) |
240 |
761 |
317 |
|
4 |
Domestic wastes (kg/day) |
130 |
1577 |
364 |
| TABLE 6: ZONEWISE QUANTITY OF DIFFERENT WASTES GENERATED PER DAY |
|
|
Average weight generated in kg/day |
||||||||
|
Zone no |
Open dump |
Active bins |
Paper |
Plastics |
Leaf |
Dom. waste |
Total. weight |
|
|
1 |
1 |
23 |
47.46 |
20.25 |
31.48 |
9.67 |
108.86 |
|
|
2 |
5 |
31 |
35.28 |
20.67 |
108.88 |
120.54 |
285.39 |
|
|
3 |
0 |
14 |
31.46 |
10.64 |
18.20 |
26.78 |
87.10 |
|
|
4 |
0 |
11 |
18.80 |
7.42 |
7.15 |
7.27 |
40.39 |
|
|
5 |
1 |
0 |
0 |
0 |
0 |
0 |
0 |
|
|
6 |
0 |
4 |
3.09 |
2.14 |
9.39 |
18.40 |
33.03 |
|
|
7 |
2 |
22 |
17.28 |
18.63 |
105.56 |
141.14 |
282.12 |
|
|
8 |
1 |
0 |
0 |
0 |
0 |
0 |
0 |
|
|
9 |
1 |
0 |
0 |
0 |
0 |
0 |
0 |
|
|
10 |
0 |
0 |
0 |
0 |
0 |
0 |
0 |
|
|
11 |
0 |
4 |
6.53 |
3.10 |
18.83 |
2.77 |
31.24 |
|
|
12 |
0 |
1 |
0.87 |
0.50 |
1.29 |
3.11 |
5.79 |
|
|
13 |
0 |
5 |
4.01 |
3.00 |
9.72 |
18.41 |
35.15 |
|
|
14 |
0 |
4 |
1.32 |
0.79 |
1.60 |
5.69 |
9.41 |
|
|
15 |
0 |
4 |
3.49 |
2.17 |
5.30 |
12.64 |
21.60 |
|
|
11 |
123 |
169.63 |
89.34 |
317.43 |
364.48 |
940.11 |
||
| TABLE 7: RESULTS OF LITTER QUANTIFICATION BASED ON TREE DENSITY |
|
|
Density |
No of Trees |
No of |
Average litter |
Total quantity |
|
Category |
per ha |
Grids of |
Quantity in |
Category wise |
|
Size (1ha) |
gm/m2/day |
in kg/year |
||
|
1 |
362 to 622 |
12 |
5.35 |
234330.00 |
|
2 |
252 to 362 |
13 |
3.57 |
169396.50 |
|
3 |
176 to 252 |
28 |
6.91 |
706202.00 |
|
4 |
134 to 176 |
31 |
2.97 |
336055.53 |
|
5 |
102 to 134 |
29 |
3.57 |
377884.56 |
|
6 |
78 to 102 |
30 |
11.14 |
1219830.45 |
|
7 |
46 to 78 |
29 |
5.39 |
570531.59 |
|
8 |
1 to 46 |
8 |
10.71 |
312732.24 |
|
TOTAL |
- |
180 |
- |
3696262kg/year |
Total quantity of litter produced for the total area = 3926 t/year
Total quantity of litter produced after removing moisture = 1178 t/day
Totals quantify of litter produced after removing woody litter = 1001 t/year
Total quantity produced per day per 180ha = 2.74 t/day in the campus
Total quantity produced per hectare per day = 15.24 kg/ha/day or 5.546 t/ha/yr
| TABLE 8: RATE OF GENERATION/DAY IN ALL CONCRETE, STONE AND CUBIC BINS |
|
|
Bin |
Existing |
Volume in m3 |
Weight in kg |
||||
|
Type |
Volume in m3 |
Max |
Min |
Ave |
Max |
Min |
Ave |
|
Concrete |
0.4 |
0.8 |
0 |
0.176 |
33.66 |
2.35 |
7.19 |
|
Cubic |
0.4 |
0.8 |
0 |
0.172 |
33.66 |
2.35 |
7.28 |
|
Stone |
0.6 |
0.67 |
0 |
0.197 |
22.90 |
2.39 |
7.31 |
Maximum volume, the bin should have = 2 times the average volume = 2* 0 .2 m3 = 0.4 m3
Maximum weight could have been handled = 3*ave.weight = 3*7.5kg =22.5kg
| SPATIAL OUTPUT RESULT: |
|
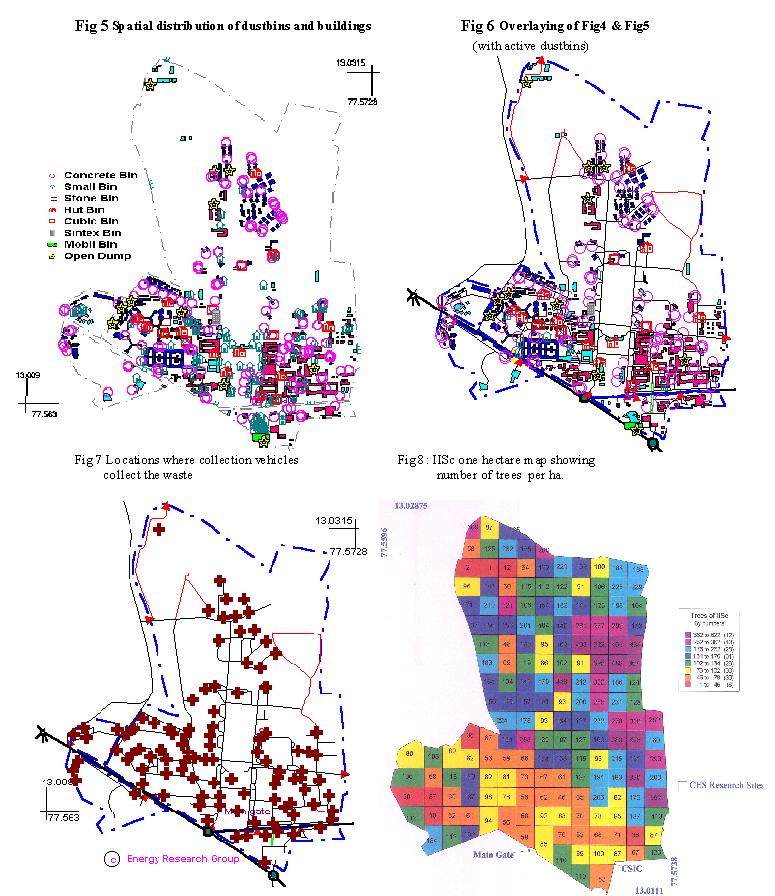
The base layers of IISc campus for the analysis were generated from the scanned maps of survey of India 1:1000 sheets. The boundary layer of IISc campus having four bounds is shown in Figure 1. IISc campus covers an area of 180 hectares of which the main campus occupies about 158 hectares. The road and building layers generated are shown in Figure 2 and 3 respectively. The road network depicts paved, unpaved, overhead bridge and subways. Buildings are classified based on usage as administrative, academic, and residential and buildings of dining facilities. The layer (Fig 5 & 6) with buildings, road network and dustbins show the spatial distribution of dustbins. Fig 7 shows the grids of size 1hec and tree density per hectare in IISc.
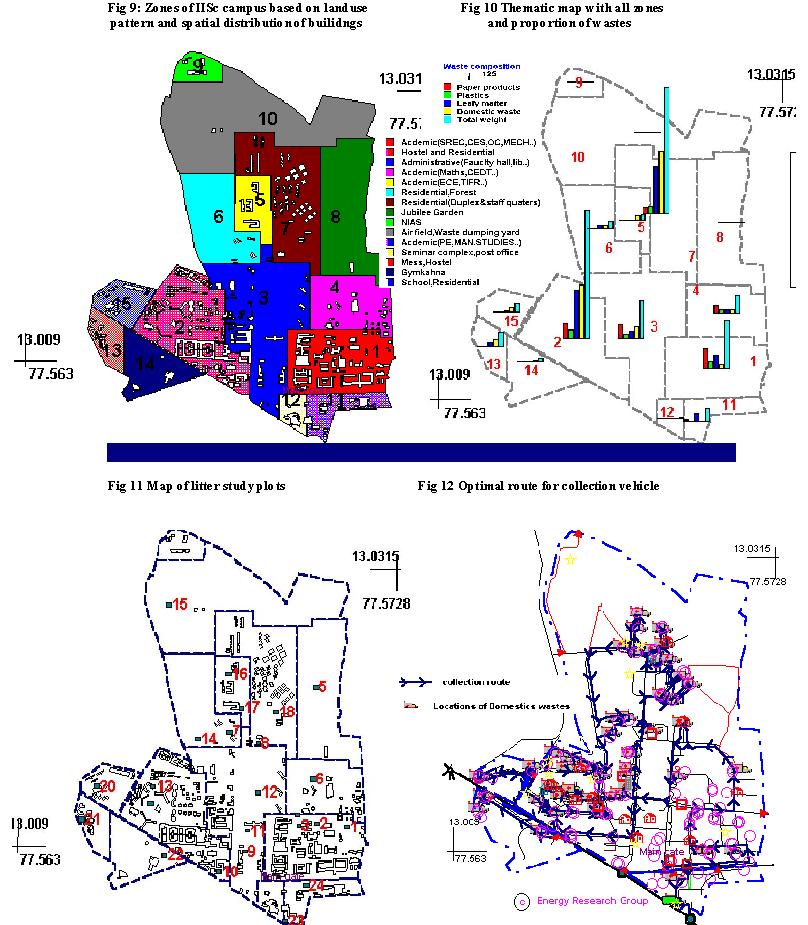
Figure 8 shows the various zones of the campus based on land use pattern. Figures 8 and 9 show the active dustbins where the experiments were carried out with land use zones. Fig 9 shows the thematic map with all zones and proportion of waste generated.
With these dustbin maps and road network, the collection system (Fig 6) was mapped. Figure 10 shows the litter study plots covering all vegetated areas. The plots were located in the map using Global Positioning System (GPS). Figure 11 shows the optimal route for the collection vehicle.
Spatial information output
Fig 1: Boundary of IISc with surrounding lakes
Fig 2: Boundary of IISc
Fig 3: Building distribution
Fig 4: Road network of IISc campus
Fig 5: Spatial distribution of dustbins and buildings
Fig 6: Overlaying of Fig 4 and Fig 5
Fig 7: Locations where collection vehicles collect the waste
Fig 8: IISc one-hectare map showing number of trees per hectare
Fig 9: Zones of IISc campus based on landuse pattern with spatial spread of buildings
Fig 10: Thematic map with all zones and proportion of waste generated
Fig 11: Map of litter study plots sprawling over campus
Fig 12: Optimal route for collection vehicle
| DISCUSSION AND CONCLUSIONS: |
|
| REFERENCE: |
|
| FIGURES 1 T0 4 |
|
| FIGURES 5 TO 8 |
|
| FIGURES 9 TO 12 |
|
| ADDRESS: |
|
1.) Energy and Wetlands Research Group,
CES,
Indian Institute of Science,
Bangalore 560 012,
India,
E-mail:cestvr@ces.iisc.ac.in
Energy@ces.iisc.ac.in
Fax: 91-080-3601428 / 3600085 / 3600683 [CES-TVR]
Tel: 91-080-3600985 / 309 250
|
|
|