|
| ||||
|
|
| 1 of 1 |
| This Document | ||
| SummaryPlus | ||
| Full Text + Links | ||
| PDF (377 K) | ||
|
| ||
| Actions | ||
| Cited By | ||
| Save as Citation Alert | ||
| E-mail Article | ||
| Export Citation | ||
Urban H. S. ![]() sprawl: metrics, dynamics and modelling using GIS
sprawl: metrics, dynamics and modelling using GIS
![]() Sudhira
Sudhira![]()
 , , , a,
T. V. Ramachandra
, , , a,
T. V. Ramachandra , , , a
and K. S. Jagadishb
, , , a
and K. S. Jagadishb
a Energy and Wetlands Research
Group, Centre for Ecological Sciences, Indian Institute of Science, Bangalore
560 012, India
b Department of Civil Engineering,
Indian Institute of Science, Bangalore 560 012, India
Received 22 April
2003; accepted 6 August 2003. ; Available online 23 October 2003.
![]() Urban
Urban![]() sprawl refers to the extent of urbanisation, which is a global
phenomenon mainly driven by population growth and large scale migration. In
developing countries like India, where the population is over one billion,
one-sixth of the world's population,
sprawl refers to the extent of urbanisation, which is a global
phenomenon mainly driven by population growth and large scale migration. In
developing countries like India, where the population is over one billion,
one-sixth of the world's population, ![]() urban
urban![]() sprawl is taking its toll on the natural resources at an alarming
pace.
sprawl is taking its toll on the natural resources at an alarming
pace. ![]() Urban
Urban![]() planners require information related to the rate of growth, pattern
and extent of sprawl to provide basic amenities such as water, sanitation,
electricity, etc. In the absence of such information, most of the sprawl areas
lack basic infrastructure facilities. Pattern and extent of sprawl could be
modelled with the help of spatial and temporal data. GIS and remote sensing data
along with collateral data help in analysing the growth, pattern and extent of
sprawl. With the spatial and temporal analyses along with modelling it was
possible to identify the pattern of sprawl and subsequently predict the nature
of future sprawl. This paper brings out the extent of sprawl taking place over a
period of nearly three decades using GIS and Remote Sensing. The study also
attempts to describe some of the landscape metrics required for quantifying
sprawl. For understanding and modelling this dynamic phenomenon, prominent
causative factors are considered.
planners require information related to the rate of growth, pattern
and extent of sprawl to provide basic amenities such as water, sanitation,
electricity, etc. In the absence of such information, most of the sprawl areas
lack basic infrastructure facilities. Pattern and extent of sprawl could be
modelled with the help of spatial and temporal data. GIS and remote sensing data
along with collateral data help in analysing the growth, pattern and extent of
sprawl. With the spatial and temporal analyses along with modelling it was
possible to identify the pattern of sprawl and subsequently predict the nature
of future sprawl. This paper brings out the extent of sprawl taking place over a
period of nearly three decades using GIS and Remote Sensing. The study also
attempts to describe some of the landscape metrics required for quantifying
sprawl. For understanding and modelling this dynamic phenomenon, prominent
causative factors are considered.
Author Keywords: ![]() Urban
Urban![]() sprawl; Urbanisation; GIS; Remote sensing;
sprawl; Urbanisation; GIS; Remote sensing; ![]() Urban
Urban![]() dynamics; Spatial and temporal analyses; Modelling
dynamics; Spatial and temporal analyses; Modelling ![]()
The process of urbanisation is a universal phenomenon taking place the world over, where humans dwell. All countries are prone to this bewildering phenomenon chiefly responsible due to the increase in population growth, economy and infrastructure initiatives. The extent of urbanisation or the sprawl is one such phenomenon that drives the change in land use patterns. The sprawl normally takes place in radial direction around the city centre or in linear direction along the highways. Usually sprawl takes place on the urban fringe, at the edge of an urban area or along the highways. The study on urban sprawl ([The Regionalist, 1997 and Sierra Club, 1998]) is attempted in the developed countries ( [Batty et al., 1999, Torrens and Alberti, 2000 and Barnes et al., 2001], [Hurd et al., 2001 and Epstein et al., 2002]) and recently in developing countries such as China ( [Yeh and Li, 2001 and Cheng and Masser, 2003]) and India ( [Jothimani, 1997, Lata et al., 2001 and Sudhira et al., 2003]). In India alone currently 25.73% of the population ( [Census of India, 2001]) live in the urban centres, while it is projected that in the next fifteen years about 33% would be living in the urban centres. This indicates the alarming rate of urbanisation and the extent of sprawl that could take place. In order to understand this increasing rate of urban sprawl, an attempt is made to understand the sprawl dynamics and evolve appropriate management strategies that could aid in the region's sustainable development. Understanding such a phenomenon and its pattern helps in planning for effective natural resource utilisation and provision of infrastructure facilities.
The built-up is generally considered as the parameter for quantifying urban sprawl ([Torrens and Alberti, 2000, Barnes et al., 2001 and Epstein et al., 2002]). It is quantified by considering the impervious or the built-up as the key feature of sprawl, which is delineated using toposheets or through the data acquired remotely. The convergence of GIS, remote sensing and database management systems has helped in quantifying, monitoring, modelling and subsequently predicting this phenomenon. At the landscape level, GIS aids in calculating the fragmentation, patchiness, porosity, patch density, interspersion and juxtaposition, relative richness, diversity, and dominance in order to characterise landscape properties in terms of structure, function, and change ( [ICIMOD, 1999 and Civco et al., 2002]). Modelling the spatial and temporal dimensions has been an intense subject of discussion and study for philosophy, mathematics, geography and cognitive science ( [Claramunt and Jiang, 2001]). Modelling of the spatial dynamics rests mostly with the land cover/land use change studies ( [Lo and Yang, 2002]) or urban growth studies. In order to predict the scenarios of land use change in the Ipswich watershed, USA over a period of two decades, [Pontius et al., 2000] predict the future land use changes based on the model validated for 1971, 1985 and 1991.
In urban growth modelling studies, the spatial phenomenon is simulated geometrically using techniques of cellular automata (CA). The CA technique is used extensively in the urban growth models ([Clarke et al., 1996]) and in urban simulation ( [Torrens and O' Sullivan, 2001 and Waddell, 2002]). The inadequacy in some of these is that the models fail to interact with the causal factors driving the sprawl such as the population growth, availability of land and proximity to city centres and highways. [Cheng and Masser, 2003] report the spatial logistic regression technique used for analysing the urban growth pattern and subsequently model the same for a city in China. Their study also includes extensive exploratory data analyses considering the causal factors. The inadequacies in their technique related to accurately pinpoint spatially where the sprawl would occur. This problem could be effectively addressed when neural network is applied to the remote sensing data especially for classification and thematic representation ( [Foody, 2001]). The neural spatial interaction models would relieve the model user of the need to specify exactly a model that includes all necessary terms to model the true spatial interaction function ( [Fischer, 2002]).
However, monitoring of urban land use change using the techniques of remote sensing and GIS and its subsequent modelling to arrive at a conventional approach is lacking in the context of India. The objective of this investigation is to analyse and understand the urban sprawl pattern and dynamics to predict the future sprawls and address effective resource utilisation for infrastructure allocation.
In order to quantify the urban forms such as built-up in terms of spatial phenomenon, the Shannon's entropy ([Yeh and Li, 2001]) and the landscape metrics (patchiness, map density) were computed for understanding the built-up dynamics. The landscape metrics, normally used in ecological investigations, is being extended to enhance the understanding of the urban forms. Computation of these indices helped in understanding the process of urbanisation at a landscape level.
Understanding the dynamic phenomenon such as urban sprawl requires land use change analyses, urban sprawl pattern identification and computation of landscape metrics. Drainage network (sea, rivers, streams and water bodies), roads and railway network and the administrative boundaries were digitised from the toposheets as individual layers. The highway passing between the two cities was digitised separately and a buffer region of 4 km on either side of the highway was created using MAPINFO 5.5, for detailed field investigations. Land cover and land use analysis for this region is done using IRS 1C data. Urban sprawl over the period of three decades (1972–1999) is determined by computing the built up area of all the settlements from the Survey of India (SOI) toposheets of 1971–1972 and comparing it with the area obtained from the classified satellite imagery for the built-up theme.
Urban sprawl is a process, which can affect even the smallest of villages; hence each and every village was analysed. Attribute information like village name, taluk it belongs to, population density, distance to the cities, etc. was extracted from census records (1971, 1981 and 1991) and from vector layers and were added to the database. The built-up area (for 1972) was computed and appended to this attribute database.
The multispectral LISS satellite imagery procured from NRSA, Hyderabad, India, was used for the analysis using Idrisi 32 ([Eastman, 1999]; http://www.sciencedirect.com/science?_ob=RedirectURL&_method=externObjLink&_locator=url&_cdi=7269&_plusSign=%2B&_targetURL=http%253A%252F%252Fwww.clarklabs.org). The image analyses included bands extraction, restoration, classification, and enhancement. The Gaussian maximum likelihood classifier (MLC) was employed for classification. The original classification of land-use of 16 categories was aggregated to vegetation, built-up (residential and commercial), agricultural lands and open, and water bodies. Area under built-up theme was recognised and extracted from the imagery and the area for 1999 was computed. Further, by overlaying village boundaries, village wise built-up area was calculated.
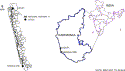
Mangalore, Udupi region in Karnataka state, was chosen based on the preliminary investigation where urban sprawl is prevalent. This region is located within co-ordinates of latitudes 12°49'35''N and 13°22'50''N and longitudes 74°42'5''E and 74°54'55''E surrounding the National Highway (NH 17) passing between Udupi and Mangalore, Karnataka, India (Fig. 1). The distance between the two urban centres is 62 km. A buffer region of 4 km on each side is marked as the specific area for detailed investigation.
Fig. 1. Location of study area: Udupi Mangalore segment.
The total study area is 434.2 km2. The annual precipitation in this area is approximately 4242.5 mm in Mangalore and 4128.1 mm in Udupi. The southwest monsoon during the months of June to October is mainly responsible for the precipitation. The next round of precipitation occurs in the months of November and December due to the northeast monsoon. The relative humidity is considerably high mainly due to the proximity of the region to the coast. Mean annual temperature ranges from 18.6 to 34.9 °C ([Census of India, 1981]).
Mangalore is the administrative headquarters of Dakshin Kannada district, southwestern Karnataka state, southern India. The modern port 10 km north of Mangalore, beside the highway towards Udupi, is India's ninth largest cargo handling port. Until 1997, Udupi was also in the Dakshin Kannada district, after which it has been bifurcated as a new district. There are 39 and 35 villages in Mangalore and Udupi taluks, respectively, falling under the study area, a shipbuilding centre. The region is a leader in more than one-way in banking, private entrepreneurship and in general awareness amongst people. Mangalore city has given birth to four nationalised banks apart from general insurance companies. Industrialisation has crept in along with the financial institutions, in the form of Iron Ore Pelletization Unit, Fertilizer, Refinery and Petrochemical and such numerous industries. The regions' economy is complemented by agricultural processing and port-related activities apart from the industrial and financial sectors. Apart from these this region has the distinction of having the highest number of literate. The other distinguishing factor is that the sex ratio, i.e. number of females per 1000 males is 1020. Thus, the entire region, which exhibits a host of vibrant economic activities as evinced from the growth of cities and infrastructure developments, was selected for investigation.
The data collection was done from both primary and secondary data sources. The primary data collected were the Survey of India toposheets of 1:50,000 scale for the corresponding region and the multispectral satellite imagery of the Indian Remote Sensing (IRS) satellite, LISS-3 dated 29 March 1999 from the National Remote Sensing Agency, Hyderabad, India for the corresponding path (97) and row (64). The secondary data collected included the demographic details from the primary census abstracts of all the villages in the study area for 1971, 1981, 1991 and 2001, from the Directorate of Census Operations, Census of India. The village maps of this region was obtained from the Directorate of Survey Settlements and Land Records, Government of Karnataka.
The standard image processing techniques such as, image extraction, rectification, restoration, and classification were applied in the current study. The image obtained from the NRSA in three bands, viz., band 2 (green), band 3 (red) and band 4 (near infrared), was used to create a false colour composite (FCC) as shown in Fig. 2. Training polygons were chosen from the composite image and corresponding attribute data was obtained in the field using GPS. Based on these signatures, corresponding to various land features, image classification was done using Gaussian MLC and the classified image is given in Fig. 3.
Fig. 2. False colour composite.
(34K)
Fig. 3. Classified image.
The rate of development of land in Udupi, Mangalore region, is outstripping the rate of population growth. This implies that the land is consumed at excessive rates and probably in unnecessary amounts as well. Between 1972 and 1999, population in the region grew by about 54% ([Census of India, 1971, Census of India, 1981 and Census of India, 1991]) while the amount of developed land grew by about 146%, or nearly three times the rate of population growth ( Fig. 4). This means that the per capita consumption of land has increased exceptionally over three decades. The per capita land consumption refers to utilisation of all lands for development initiatives like the commercial, industrial, educational, and recreational establishments along with the residential establishments per person. Since most of the initiatives pave way for creation of jobs and subsequently help in earning livelihood, the development of land is seen as a direct consequence of a region's economic development and hence one can conclude that the per capita land consumption is inclusive of all the associated land development.
Fig. 4. Rates of growth in population and built-up from 1971–1999.
Characterising pattern involves detecting and quantifying it with appropriate scales and summarising it statistically. There are scores of metrics now available to describe landscape pattern. The only major components that were considered for this study are composition and structure. The landscape pattern metrics are used in studying forest patches ([Trani and Giles, 1999 and Civco et al., 2002]). Most of the indices are correlated among themselves, because there are only a few primary measurements that can be made from patches (patch type, area, edge, and neighbour type), and all metrics are then derived from these primary measures. The landscape metrics applied to analyse the built-up theme for the current study are discussed next.
The Shannon's entropy ([Yeh and Li, 2001]) was computed to detect the urban sprawl phenomenon and is given by,
Hn=- Pi
loge(Pi) Pi
loge(Pi) |
(1) |
This value ranges from 0 to log n, indicating very compact distribution for values closer to 0. The values closer to log n indicates that the distribution is very dispersed. Larger value of entropy reveals the occurrence of urban sprawl. Table 1 shows the built-up area, population and Shannon's entropy for 1972 and 1999.
Table 1. built-up area, population and Shannon's entropy for the study area
(<1K)
Shannon's entropy was calculated from the built-up area for each village, considered as an individual zone (n is the total number of villages). The results show that the distribution of built-up in the region in 1972 was more dispersed than in 1999. However, the degree of dispersion has come down marginally and distribution is predominantly dispersed. The values obtained here, 1.7673 in 1972 and 1.673 in 1999, are closer to the upper limit of log n, i.e. 1.914, showing the degree of dispersion of built-up in the region.
Patchiness or number of different classes (NDC) is the measurement of the density of patches of all types or number of clusters within the n×n window. In other words, it is a measure of the number of heterogeneous polygons over a particular area. Greater the patchiness more heterogeneous the landscape is ([Murphy, 1985]). In this case the density of patches among different categories was computed for a 3×3 window. The computation of patchiness using 3×3 moving window revealed that two heterogeneous classes category was maximum (57.15%) and five heterogeneous classes category was the least (0.02%) in the study area (Table 2). This reveals that about 20.7% of the study area is homogeneous while the rest are heterogeneous with patch class ranging from two to five (Fig. 5).
Table 2. Percentage distribution of patchiness
(9K)
Fig. 5. Patchiness or number of different classes.
Map density values are computed by dividing number of built up pixels to the total number of pixels in a kernel. This when applied to a classified satellite image converts land cover classes to density classes, which is given in Fig. 6. Depending on the density levels, it could be further grouped as low, medium and high density (Fig. 7). Based on this, relative share of each category was computed (area and percentage). This enabled in identifying different urban growth centres and subsequently correlating the results with Shannon's entropy for identifying the regions of high dispersion.
Fig. 6. Map density.
(34K)
Fig. 7. Classification of built-up densities.
The computation of built-up density gave the distribution of the high, medium and low-density built-up clusters in the study area. High density of built-up would refer to clustered or more compact nature of the built-up theme, while medium density would refer to relatively lesser compact built-up and low density referred to loosely or sparsely spread built-up areas. The percentage of high-density built-up area was only 12.67% as against 25.67% of medium density and as much as 61.66% of low-density built-up area (Table 3). This revealed that more compact or highly dense built-up was a smaller amount and more dispersed or least dense built-up was larger in the study area. An important inference that could be drawn out of this was that high and medium density was found all along the highways along with the city centres. Most of the high density was found to be within and closer to the cities. However, medium density was also found mostly along the city periphery and on the highways. The distribution of low density was the maximum in the study area and this could be inferred as the higher dispersion of the built-up in the study area. This further substantiates the results of Shannon's entropy, which revealed a high dispersion of the built-up theme in the study area.
Table 3. different densities of built-up and their area
Defining this dynamic phenomenon and predicting the future sprawl is a greater challenge than the quantification of sprawls. Although different sprawl types were identified and defined there has been an inadequacy with respect to developing mathematical relationships to define them. This necessitates characterisation and modelling of urban sprawl, which will aid in regional planning and sustainable development.
Urban sprawl dynamics was analysed considering some of the causal factors. The rational behind this is to identify such factors that play a significant role in the process of urbanisation. The causal factors that were considered responsible for sprawl were:
 population (
 -population density (
 -population density (
annual population growth rate (
distance from Mangalore (
distance from Udupi (
-population density (
annual population growth rate (
distance from Mangalore (
distance from Udupi (The factor population has been accepted as a key factor of urban sprawl. The
percentage built-up is the proportion of the built-up area to the total area of
the village. The population density (![]() )
is the proportion of the population in every village to the built-up area of
that village. The population density (
)
is the proportion of the population in every village to the built-up area of
that village. The population density (![]() )
is the proportion of population in every village to the total area of that
village. The population density is often referred as
population density. Since the built-up area plays an important role in the
current study for the purpose of analyses, the percentage built-up, and population
densities are computed and analysed village-wise and categorised as a sub-zone.
The annual population growth rate (
)
is the proportion of population in every village to the total area of that
village. The population density is often referred as
population density. Since the built-up area plays an important role in the
current study for the purpose of analyses, the percentage built-up, and population
densities are computed and analysed village-wise and categorised as a sub-zone.
The annual population growth rate (![]() ) is computed from
the population data available from 1961 for all the villages. This growth rate
is used in predicting the population for 1999 and subsequent future populations.
The distance from the city centres, viz. Udupi and Mangalore to each village was
calculated. Thus, the effects of proximity of the cities on the urban sprawl of
these sub-zones were analysed. With these causal factors identified the
modelling studies were undertaken.
) is computed from
the population data available from 1961 for all the villages. This growth rate
is used in predicting the population for 1999 and subsequent future populations.
The distance from the city centres, viz. Udupi and Mangalore to each village was
calculated. Thus, the effects of proximity of the cities on the urban sprawl of
these sub-zones were analysed. With these causal factors identified the
modelling studies were undertaken.
In order to explore the probable relationship of percentage built-up
(dependent variable) with causal factors of sprawl (population, - and -population
densities, etc.), regression analysis was undertaken. Various regression
analyses (linear, quadratic, exponential and logarithmic) were carried out to
ascertain the nature of significance of the causal factors (independent
variables) on the sprawl, quantified in terms of percentage built-up. The
linear, quadratic (order = 2), and logarithmic (power law) regression analyses
were tried and the results are tabulated in Annexure. All these regression
analyses reveal the individual contribution by the causal factors on the sprawl.
The most significant relationships are outlined in (2),
(3),
(4),
(5)
and (6).
The linear regression analyses revealed that the population has a significant
influence, which is evident from the x coefficient. The quadratic regression
analyses for second order revealed that the -population density and distance from
urban centre (Mangalore) have a considerable role in the sprawl phenomenon. It
is evident from the result that the sprawl declines with increase in distance
from urban centres. The logarithmic (power law) regression analyses revealed
that the
population density has influenced the sprawl phenomenon, which is evident from
the value of exponent. Positive value of the exponent infers that built-up area
increases exponentially with increase in ![]() The probable
relationships are,
The probable
relationships are,
| (7) |
| (8) |
Likely increase in the built-up area is predicted using Eq. (9). To project built-up for 2020 and 2050, corresponding population was computed considering annual growth rate based on the historical population data of 1961–2001.
It is found that the percentage built-up for 2020 and 2050 would be 18.10 and 30.47%, respectively. This implies that by 2050, the built-up area in the region would rise to 127.7 km2, which would be nearly 106% growth in the change in built-up area to the current sprawl of 61.7703 km2 over the region. Thus, indicating that the pressure on land would further grow and the agriculture fields, open grounds and region around the highways would become prime targets for sprawl. This would also give a picture of the pressures on the land, which the planners have to address in their planning exercises. With an understanding of the land requirement under the current trend, the techniques of GIS and remote sensing can be applied for effective infrastructure facilities and resource utilisation.
With the population of India increasing as ever, the pressures on land and
resources are also increasing. The urban sprawl is seen as one of the potential
threats to sustainable development where urban planning with effective resource
utilisation and allocation of infrastructure initiatives are key concerns. The
study attempts to identify such sprawls, quantify by defining few metrics,
understand the dynamic process and subsequently model the same to predict for
future. The study was carried out along the Mangalore, Udupi highway using the
techniques of GIS and remote sensing to identify and quantify the sprawl. The
spatial data along with the attribute data of the region aided to analyse
statistically and define few of the landscape metrics. Further, the statistical
analyses helped in quantifying and modelling the same. It was found that the
percentage change in built-up over the period of nearly thirty years was 145.68%
and by 2050, the built-up area in the region would rise to
127.7 km2, which would be nearly 106% growth in the change in
built-up area to the current sprawl of 61.7703 km2 over the
region. ![]()
We thank Indian Space Research Organisation (ISRO), Indian Institute of
Science (IISc) Space Technology Cell for financial assistance to carry out field
investigations and National Remote Sensing Agency (NRSA), Hyderabad, India for
providing the satellite data required for the study. We are grateful to the
Ministry of Environment and Forests, Government of India and Indian Institute of
Science for infrastructure support. We thank Mr. Joshua David for assistance in
editorial corrections and Mr. Sanjeev Kumar Jha for field assistance and proof
reading that helped in fine tuning the document. ![]()
Barnes et al., 2001. Barnes K.B., Morgan III, J.M., Roberge, M.C., Lowe, S., 2001. Sprawl Development: Its Patterns, Consequences, and Measurement. Towson University, Towson. (http://www.sciencedirect.com/science?_ob=RedirectURL&_method=externObjLink&_locator=url&_cdi=7269&_plusSign=%2B&_targetURL=http%253A%252F%252Fwww.chesapeake.towson.edu%252Flandscape%252Furbansprawl%252Fdownload%252FSprawl_white_paper.pdf)
Batty et al., 1999. Batty M., Xie Y., Sun Z., 1999. The dynamics of urban sprawl. Working Paper Series, Paper 15, Centre for Advanced Spatial Analysis, University College, London. (http://www.sciencedirect.com/science?_ob=RedirectURL&_method=externObjLink&_locator=url&_cdi=7269&_plusSign=%2B&_targetURL=http%253A%252F%252Fwww.casa.ac.uk%252Fworking_papers%252F)
Census of India, 1971. Census of India, 1971. District Census Handbook – South Kanara District. Series 14. Directorate of Census Operations, Mysore.
Census of India, 1981. Census of India, 1981. District Census Handbook – Dakshin Kannada District. Series 9. Directorate of Census Operations, Karnataka.
Census of India, 1991. Census of India, 1991. (http://www.sciencedirect.com/science?_ob=RedirectURL&_method=externObjLink&_locator=url&_cdi=7269&_plusSign=%2B&_targetURL=http%253A%252F%252Fwww.censusindia.net)
Census of India, 2001. Census of India, 2001. (http://www.sciencedirect.com/science?_ob=RedirectURL&_method=externObjLink&_locator=url&_cdi=7269&_plusSign=%2B&_targetURL=http%253A%252F%252Fwww.censusindia.net)
Cheng and Masser, 2003. Cheng, J., Masser, I., 2003. Urban growth pattern modelling: a case study of Wuhan City, PR China. Landscape Urban Plan. 62, 199–217.
Civco et al., 2002. D.L. Civco, J.D. Hurd, E.H. Wilson, C.L. Arnold and M. Prisloe, Quantifying and describing urbanizing landscapes in the Northeast United States. Photogrammetr. Eng. Remote Sens. 68 10 (2002), pp. 1083–1090. Abstract-Elsevier BIOBASE | Abstract-GEOBASE | $Order Document
Claramunt and Jiang, 2001. C. Claramunt and B. Jiang, An integrated representation of spatial and temporal relationships between evolving regions. J. Geograph. Syst. 3 (2001), pp. 411–428. Abstract-EconLit | $Order Document | Full Text via CrossRef
Clarke et al., 1996. Clarke, K.C., Hoppen, S., Gaydos, L., 1996. Methods and techniques for rigorous calibration of a cellular automation model of urban growth. In: Proceedings of the Third International Conference/Workshop on Integrating GIS and Environmental Modelling, Santa Fe, New Mexico, January 21–25, 1996.
Eastman, 1999. Eastman, J.R., 1999. Idrisi32: Guide to GIS and Image Processing, vols. 1 and 2, Clark Labs, Clark University, USA.
Epstein et al., 2002. J. Epstein, K. Payne and E. Kramer, Techniques for mapping suburban sprawl. Photogrammetr. Eng. Remote Sens. 63 9 (2002), pp. 913–918. Abstract-Elsevier BIOBASE | Abstract-GEOBASE | $Order Document
Fischer, 2002. M.M. Fischer, Learning in neural spatial interaction models: a statistical perspective. J. Geograph. Syst. 4 (2002), pp. 287–299. Abstract-EconLit | $Order Document | Full Text via CrossRef
Foody, 2001. G.M. Foody, Thematic mapping form remotely sensed data with neural networks: MLP, RBF, PNN based approaches. J. Geograph. Syst. 2001 3 (2001), pp. 217–232. Abstract-EconLit | $Order Document
Hurd et al., 2001. Hurd, J.D., Wilson, E.H., Lammey, S.G., Civco, D.L., 2001. Characterisation of forest fragmentation and urban sprawl using time sequential Landsat Imagery. In: Proceedings of the ASPRS Annual Convention, St. Louis, MO, April 23–27, 2001.(http://www.sciencedirect.com/science?_ob=RedirectURL&_method=externObjLink&_locator=url&_cdi=7269&_plusSign=%2B&_targetURL=http%253A%252F%252Fwww.resac.uconn.edu%252Fpublications%252Ftech_papers%252Findex.html)
ICIMOD, 1999. ICIMOD, 1999. Integration of GIS, remote sensing and ecological methods for biodiversity inventory and assessment. In Issues in Mountain Development. (http://www.sciencedirect.com/science?_ob=RedirectURL&_method=externObjLink&_locator=url&_cdi=7269&_plusSign=%2B&_targetURL=http%253A%252F%252Fwww.icimod-gis.net%252Fweb%252Fpublications%252FIssues_Mountain_6_1999.pdf)
Jothimani, 1997. Jothimani, P. 1997. Operational urban sprawl monitoring using satellite remote sensing: excerpts from the studies of Ahmedabad, Vadodara and Surat, India. Paper presented at 18th Asian Conference on Remote Sensing held during October 20–24, 1997, Malaysia.
Lata et al., 2001. Lata, K.M., Sankar Rao, C.H., Krishna Prasad, V., Badrinath, K.V.S., Raghavaswamy, 2001. Measuring urban sprawl: a case study of Hyderabad. GIS Dev. 5(12).
Lo and Yang, 2002. C.P. Lo and X. Yang, Drivers of land-use/land-cover changes and dynamic modelling for the Atlanta, Georgia Metropolitan Area. Photogrammetr. Eng. Remote Sens. 68 10 (2002), pp. 1062–1073.
Murphy, 1985. D.L. Murphy, Estimating neighborhood variability with a binary comparison matrix. Photogrammetr. Eng. Remote Sens. 51 6 (1985), pp. 667–674. Abstract-Compendex | Abstract-GEOBASE | $Order Document
Pontius et al., 2000. Pontius, Jr., R.G., Claessens, L., Hopkinson, Jr., C., Marzouk, A., Rastetter, E.B., Schneider, L.C., Vallino, J., 2000. Scenarios of land-use change and nitrogen release in the Ipswich watershed, Massachusetts, USA. Paper presented at 4th International Conference on Integrating GIS and Environmental Modelling (GIS/EM4): Problems, Prospects and Research Needs. Banff, Alberta, Canada, September 2–8, 2000. (http://www.sciencedirect.com/science?_ob=RedirectURL&_method=externObjLink&_locator=url&_cdi=7269&_plusSign=%2B&_targetURL=http%253A%252F%252Fwww.colorado.edu%252Fresearch%252Fcires%252Fbanff%252Fpubpapers%252F165%252F)
The Regionalist, 1997. The Regionalist, 1997. Debate on Theories of David Rusk, vol. 2, no. 3. In http://www.sciencedirect.com/science?_ob=RedirectURL&_method=externObjLink&_locator=url&_cdi=7269&_plusSign=%2B&_targetURL=http%253A%252F%252Fscpp.ubalt.edu%252Fpublic%252Fregional%252Fdetail.htm#issue3v2
Sierra Club, 1998. Sierra Club, 1998. The Dark Side of the American Dream: The Costs and Consequences of Suburban Sprawl. (http://www.sciencedirect.com/science?_ob=RedirectURL&_method=externObjLink&_locator=url&_cdi=7269&_plusSign=%2B&_targetURL=http%253A%252F%252Fwww.sierraclub.org%252Fsprawl%252Freport98%252F)
Sudhira et al., 2003. Sudhira, H. S., Ramachandra, T. V., and Jagadish, K. S., 2003. Urban sprawl pattern recognition and modelling using GIS. Paper presented at Map India, 2003, New Delhi. January 28–31, 2003.
Torrens and Alberti, 2000. Torrens, P.M., Alberti, M., 2000. Measuring sprawl. Working paper no. 27, Centre for Advanced Spatial Analysis, University College, London.(http://www.sciencedirect.com/science?_ob=RedirectURL&_method=externObjLink&_locator=url&_cdi=7269&_plusSign=%2B&_targetURL=http%253A%252F%252Fwww.casa.ac.uk%252Fworking_papers%252F)
Torrens and O' Sullivan, 2001. P.M. Torrens and D. O' Sullivan, Cellular automata and urban simulation: where do we go from here?. Environ. Plann. B 28 (2001), pp. 163–168.
Trani and Giles, 1999. M.K. Trani and R.H. Giles, An analysis of deforestation: Metrics used to describe pattern change. Forest Ecol. Manage. 114 (1999), pp. 459–470. SummaryPlus | Full Text + Links | PDF (206 K)
Waddell, 2002. P. Waddell, UrbanSim: modelling urban development for land use, transportation and environmental planning. J. Am. Plann. Assoc. 68 3 (2002), pp. 297–314.
Yeh
and Li, 2001. A.G.O. Yeh and X. Li, Measurement and monitoring of urban
sprawl in a rapidly growing region using entropy. Photogrammetr. Eng. Remote
Sens. 67 1 (2001), p. 83. Abstract-GEOBASE
| Abstract-Elsevier
BIOBASE | $Order
Document ![]()
.gif)
.gif)
.gif)
|
| ||||||||||||||||||||||||||||||||||
Article in Press, Corrected Proof | ||||||||||||||||||||||||||||||||||
| 1 of 1 |
|
Send feedback to ScienceDirect |
.gif)
.gif)
.gif)