Abstract
Land-use changes influence local biodiversity directly, and also cumulatively, contribute to
regional and global changes in natural systems and quality of life. Consequent to these, direct
impacts on the natural resources that support the health and integrity of living beings are evident
in recent times. The Western Ghats being one of the global biodiversity hotspots, is reeling under
a tremendous pressure from human induced changes in terms of developmental projects like
hydel or thermal power plants, big dams, mining activities, unplanned agricultural practices,
monoculture plantations, illegal timber logging, etc. This has led to the once contiguous forest
habitats to be fragmented in patches, which in turn has led to the shrinkage of original habitat for
the wildlife, change in the hydrological regime of the catchment, decreased inflow in streams,
human-animal conflicts, etc. Under such circumstances, a proper management practice is called
for requiring suitable biological indicators to show the impact of these changes, set priority
regions and in developing models for conservation planning. Amphibians are regarded as one of
the best biological indicators due to their sensitivity to even the slightest changes in the
environment and hence they could be used as surrogates in conservation and management
practices. They are the predominating vertebrates with a high degree of endemism (78%) in
Western Ghats. The present study is an attempt to bring in the impacts of various land-uses on
anuran distribution in three river basins. Sampling was carried out for amphibians during all
seasons of 2003-2006 in basins of Sharavathi, Aghanashini and Bedthi. There are as many as 46
species in the region, one of which is new to science and nearly 59% of them are endemic to the
Western Ghats. They belong to nine families, Dicroglossidae being represented by 14 species,
followed by Rhacophoridae (9 species) and Ranidae (5 species). Species richness is high in
Sharavathi river basin, with 36 species, followed by Bedthi 33 and Aghanashini 27. The impact of land-use changes, was investigated in the upper catchment of Sharavathi river basin. Species
diversity indices, relative abundance values, percentage endemics gave clear indication of
differences in each sub-catchment. Karl Pearson’s correlation coefficient (r) was calculated
between species richness, endemics, environmental descriptors, land-use classes and
fragmentation metrics. Principal component analysis was performed to depict the influence of
these variables. Results show that sub-catchments with lesser percentage of forest, low canopy
cover, higher amount of agricultural area, low rainfall have low species richness, less endemic
species and abundant non-endemic species, whereas endemism, species richness and abundance
of endemic species are more in the sub-catchments with high tree density, endemic trees, canopy
cover, rainfall and lower amount of agriculture fields. This analysis aided in prioritising regions in
the Sharavathi river basin for further conservation measures.
 Introduction
Land-use changes as an aftermath of ad-hoc decisions aimed at meeting the needs of human
population is considered to be a paramount factor in the decline of biodiversity all over the
world. They not only reduce biodiversity of a region, but over time and space, influence on
natural resources, hydrology, nutrition cycle, natural habitat, etc. In an area of rapid land-use
changes and in an era of mass extinctions, conservation and management of biodiversity is a
Herculean task, especially in the species rich tropical region, where the human dependencies on
the natural resources are also more.
Similar situation prevails in the Western Ghats of India, one of the tropical biodiversity hotspots
rich with fauna and flora. It forms about 6% of India’s landmass, but harbours more than 30% of
all vertebrate and plant species of India. It is a mountain belt having a spread of about 1600 km
in length, 100 km in width and with altitudes ranging from 300-2700 m above msl along the west
coast of India (8°N-21°N). The region has varied forest types from tropical evergreen to
deciduous to high altitude sholas. It is also an important watershed for peninsular India with as
many as 37 west flowing rivers, three major east flowing rivers and innumerable tributaries. The
richness and endemism in flora and fauna of this region is well established with over 4,000
species of flowering plants (38% endemics), 330 butterflies (11% endemics), 289 fishes (41%
endemics), 135 amphibians (78% endemics), 157 reptiles (62% endemics), 508 birds (4%
endemics) and 137 mammals (12% endemics). This mountain stretch has influenced regional
tropical climate, hydrology and vegetation and endemic plant species.
To a certain extent bringing in biodiversity rich regions under the protected area network viz.,
national parks and sanctuaries have helped in conservation, but most often they are ad-hoc
decisions and not based on systematic studies. In such situations, it becomes imperative that one
needs to look for biological indicator species that surrogate for other species and habitat of the
region, which ultimately helps in prioritising the conservation areas of a region. Amphibians, the
vertebrates with dual life stages are regarded as one of the best biological indicators due to their
sensitivity to slightest changes in the environment and they are used as surrogates in conservation
and management practices. The objectives of this paper are to:
- map the diversity and distribution of amphibian species of the region,
- understand the relationship of amphibian diversity with landscape variables,
- prioritise areas of conservation using this relationship.
Materials and methods
Study area
Three river basins, namely Bedthi, Aghanashini and Sharavathi in the Central Western Ghats
(between 12°-16°N) were considered for this study as depicted in Figure 1. These rivers are west
flowing rivers and form a part of Uttara Kannada, the district with highest forest cover (78%) in
Karnataka.
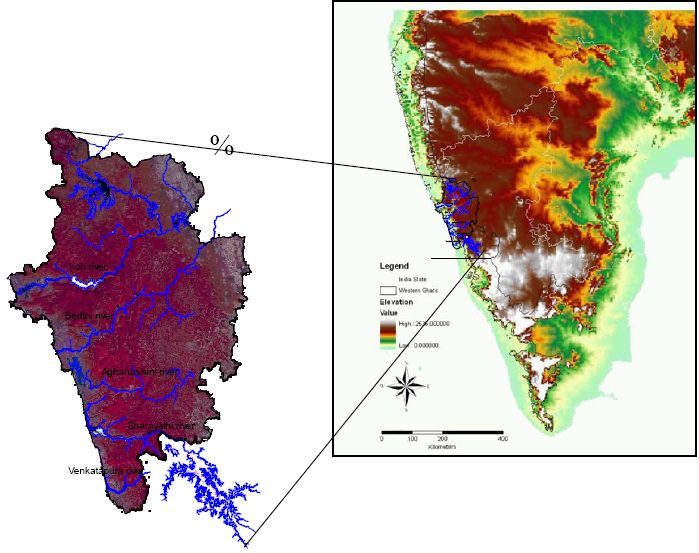
Figure 1. False colour composite image of Uttara Kannada district - study area in the Western Ghats.
River Bedthi originates at Dharwad District as Shalmala and confluences at Kalghatgi with
another stream from Hubli flowing westward for about 161 km to merge with Arabian sea. It has
a catchment of about 3878 sq. km. Similarly, river Sharavathi originates near Ambuthirtha of
Shimoga district, traverses for about 132 km and confluences at Honnavar to the Arabian sea.
The magnificent waterfall, Jog, is situated in the course of this river. The catchment area of this
river is about 3005 sq.km. These two rivers originate in neighbouring districts, but more than
60% of their drainage networks are within Uttara Kannada district. River Aghanashini having a
catchment of about 1390.52 sq.km traverses westward for about 121 km from the origin at
Manjguni of Uttara Kannada itself and confluences with Arabian Sea at Tadri. Though the
catchment of all these river basins have the influence of land-use change, it is more evident in the
catchments of River Sharavathi, where four hydel projects have came up since 1930s. Similar
situations are expected in Aghanashini as a thermal power plant is expected at Tadri and in
Bedthi, with numerous expansions of road networks, transmission lines, etc. To study the
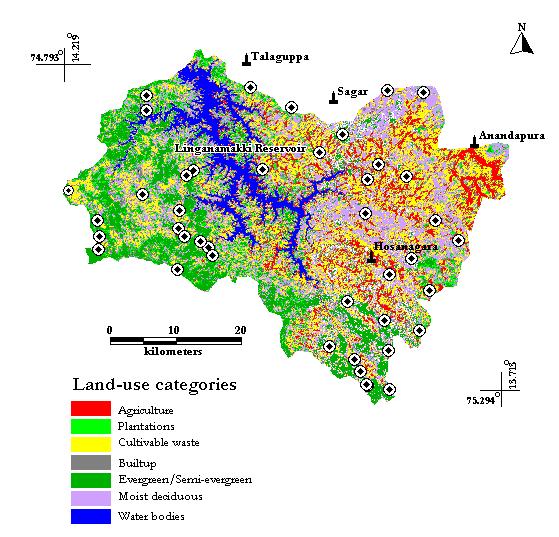
influence of land-use changes, upper catchment area of 1991.43 sq. km of Sharavathi River basin
is considered (Figure 2)

Figure 2. Classified image of Sharavathi upper catchment. Dark circles indicate sampling localities.
Sampling methods
Amphibian diversity and distribution: Systematic surveys of amphibians are being carried out in
the entire district in all seasons, since 2003. Visual encounters, calls, tadpoles, foam nests, spawn
are used to record the amphibians in the field. Two man hours of searching is made using torch
lights between 19:00-20:00 hr, by walking across the streams, forest floors, gleaning leaf litters,
prodding bushes, wood logs, rock crevices, etc. All the species encountered are identified up to
species level (if not up to genus level) using the keys of Bossuyt and Dubois (2001) and Daniels
(2005). Opportunistic encounters are also recorded to enlist the species of the region.
Environmental descriptors: Rainfall data are collected from the nearest rain gauge station for the
past twenty years. Mean annual rainfall for this period is considered for the analysis. For canopy
coverage, densio-meters are used. Stream flow is graded on the basis of water persistence in the
entire year. Vegetation sampling were carried out to calculate percentage tree endemics and
evergreenness of the sub-catchments.
Land-use and fragmentation metrics: Land-use classification was carried out using remote sensing
data through supervised classification technique based on Gaussian Maximum Likelihood
algorithm. Satellite imageries from IRS 1C MSS (Indian Remote Sensing Satellite 1C - Multi
Spectral Sensor of 23.5m resolution) of November 2000 were used for land-use analyses. The
land-use categories considered were evergreen to semi-evergreen forests, moist deciduous forests,
plantations, agricultural land and the open land. FRAGSTATS (McGarigal and Marks, 1995), a
landscape spatial pattern analysis software is used determine the total edge, edge density,
landscape shape index, contiguous forest patch and Shannon’s index. We used forest
fragmentation index of Hurd et.al., (2002) to measure the forest fragmentation in the region.
Statistical Analysis: Diversity indices were calculated for amphibian species abundance.
Correlation coefficients (r) were calculated to measure the relationships between various
environmental descriptors with the species data. A multivariate analysis, PCA was performed to
see the influence of these environmental descriptors in the sub-catchments of the study area.
Results
Amphibian diversity and distribution: There were as many as 46 species of amphibians recorded
from the entire study region. This is nearly 34% of observed amphibians from the Western
Ghats. Among these, one species is new to science and 59% are endemic to the Western Ghats.
Table 1 lists species belonging to nine families that were recorded from the study area. Family
Dicroglossidae and Rhacophoridae were represented by 14 and 9 respectively, followed by
Ranidae (5 species). Species richness is high in Sharavathi river basin, with 36 species, followed by
Bedthi 33 and Aghanashini 27.
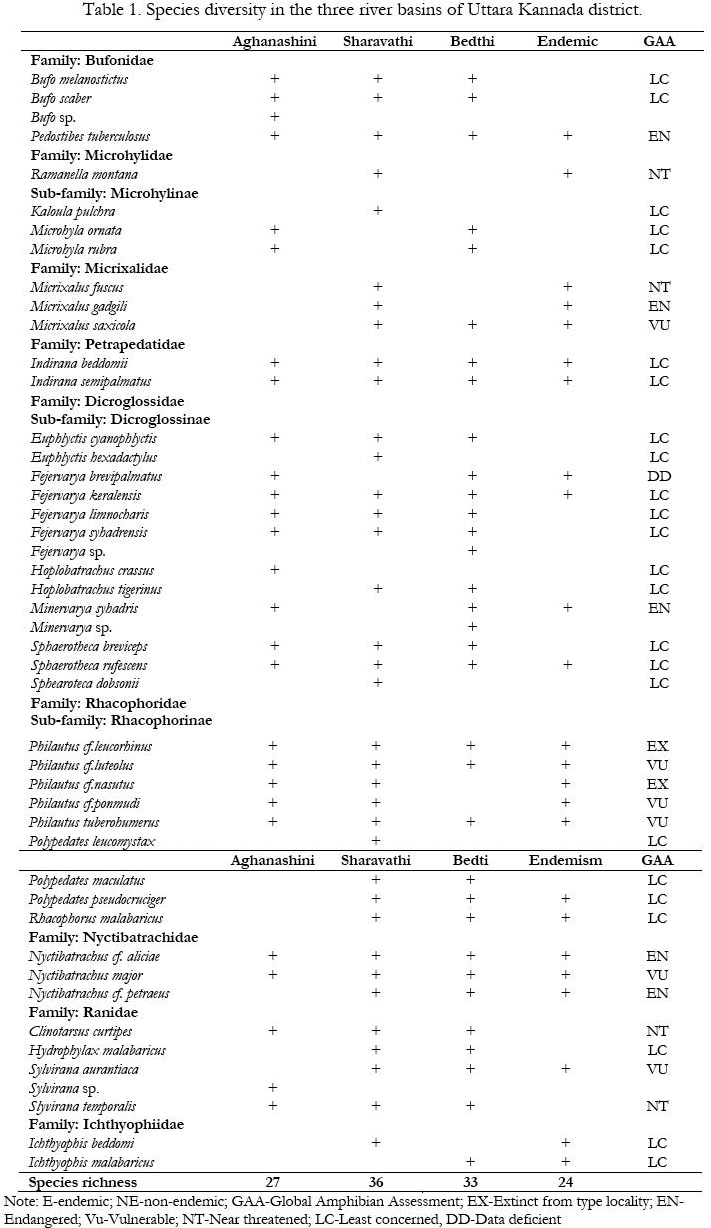
Number of endemic species varied among the river basins, highest being in Sharavathi with 21
species, followed by Bedthi with 24 and Aghanashini with 14 species. Overall 2 species are
extinct from the type locality, 5 species are endangered and 6 are vulnerable. Sharavathi and
Aghanashini harbour both extinct species, while Bedthi harbours only one. Four endangered and
all six vulnerable species are found in Sharavathi, whereas, in Aghanashini and Bedthi, this
amounts to 3, 4 and 4, 5 respectively.
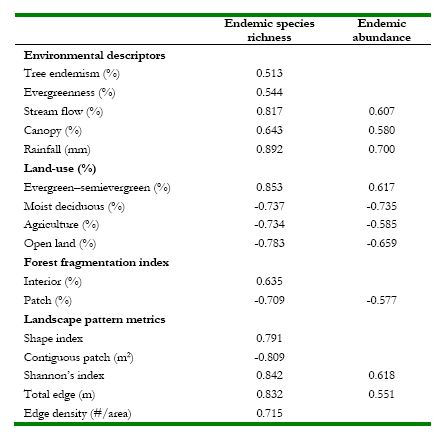
Environmental descriptors and amphibian diversity: Table 2 details the correlation coefficient (r)
at statistically significant level (P <0.05) for endemic species richness and abundance with
environmental descriptors, land-use, fragmentation and landscape metrics. Endemic species
richness is positively influenced by tree endemism; tree evergreenness; stream flow; canopy and
rainfall. Similar among the land-use categories, evergreen-semi-evergreen has exhibited positive
correlation with endemic species richness and abundance. The landscape metrics also have
influenced species richness. Among the negatively influencing factors, agriculture, open-lands and moist-deciduous categories reduce both endemic richness as well as abundance. Similarly, patch
forest negatively influences the richness and abundance.
Table 2. Correlation coefficient (r) at significance level (P<0.05) between endemic species
richness and abundance with environmental descriptors, land-use, fragmentation and landscape
metrics.
Relationships among the environmental descriptors
Table 3 details the correlation coefficient at statistically significant level between various
environmental descriptors. It is clear from the table that the variables that influence endemic
species and abundance also influence each other. In order to project the influence of all these
variables in reduced space, Principal Component Analysis, a multivariate analysis is run using
MVSP3.2. Figure 3 depicts the plot of Principal Axis 1 and 2, with the variables and subcatchments.
Principal Axis 1 explains for 86.13% of the variability and Axis 2 for 7.59%. Table 4
gives the Principal Component loading on Axis 1 and 2.
Table 3. Correlation coefficient (r) at significance level (P<0.05) among the environmental
descriptors. 1. Tree endemism; 2. Evergreenness; 3. Stream flow; 4. Canopy; 5. Rainfall; 6.
Evergreen-semievergreen; 7. Moistdeciduous; 8. Agriculture; 9. Open land; 10. Interior; 11.
Perforated; 12. Patch; 13. Shape index; 14. Contiguous patch; 15. Shannon’s index; 16. Total
edge; 17. Edge density
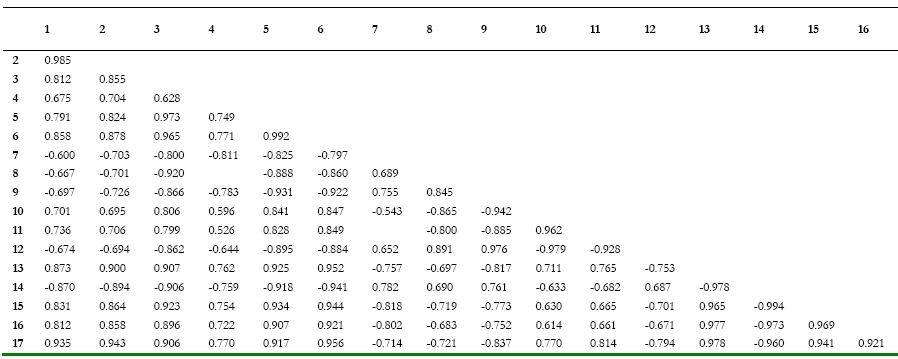
Table 4. Variable loadings of Principal Component Analysis performed for environmental
descriptors.
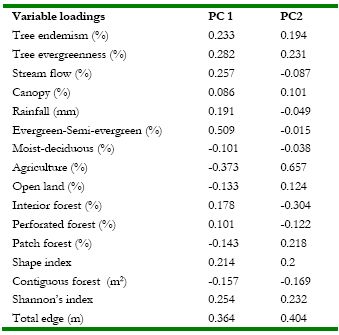
Figure 3. Biplot of Principal Component Analysis performed for environmental descriptors. 1.
Nandiholé, 2. Haridravathi, 3. Mavinholé, 4. Sharavathi, 5. Hilkunji, 6. Hurli, 7. Nagodi and 8.
Yenneholé.
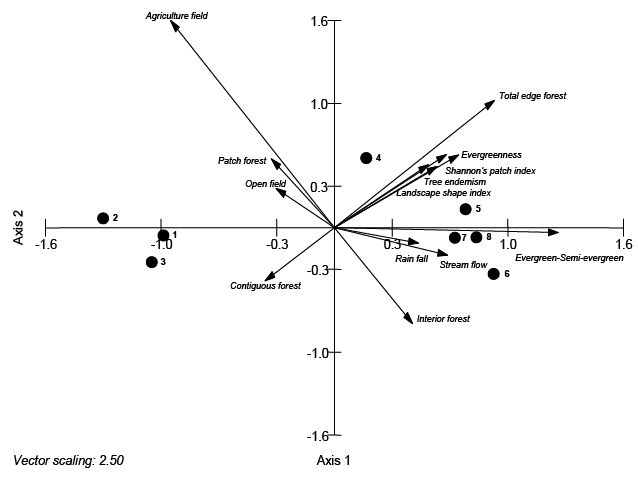
Figure 4. Conservation priority zones in Sharavathi river basin. 1. Muppane, 2. Vallur and 3.
Niluvase.
Based on the amphibian endemic species diversity, environmental descriptors, land-use and
fragmentation metrics, three important regions were identified as conservation priority regions
and are depicted in Figure 4. Region 1 falls in the protected area of Muppane reserve forest, 2 in
Vallur region where as 3 in Niluvase. It is evident from the study that regions with more human
induced changes in land-uses, canopy cover, hydrological regimes often provided shelter to
generalist amphibian species, whereas the remnant forest patches with higher amount of canopy
and vegetation had more endemic species. This again stresses the point that amphibian habitats
are being invariably fragmented and destroyed though many more species are yet to be described
from this region and whose future are really in danger, calling for intense research in Western
Ghats to conserve and understand them better.
Acknowledgements
We thank Karthick B, Vishnu D Mukri, Sreekantha, Shrikant, Lakshminarayana for their help in
the field. The Ministry of Environment and Forests, Government of India provided the research
grant for this study. We thank Karnataka Forest Department for necessary permissions to
carryout the research work.
References
- Bossuyt F, Dubois A (2001) A review of the frog genus Philautus Gistel, 1848 (Amphibia,
Anura, Ranidae, Rhacophorinae). Zeylanica, 6,1-112.
- Daniels, R.J.R. (2005). Amphibians of Peninsular India. Universities Press.
3. McGarigal, K., and Marks, B.J. 1995. FRAGSTATS Ver. 2.0. Spatial pattern analysis
program for quantifying landscape structure.
- Hurd, J. D., Wilson, E.H., Civco, D.L. 2002. Development of a forest fragmentation
index to quantify the rate of forest change. 2002 ASPRS-ACSM Annual Conference and
FIG XXII Congress April 22-26, 2002
|