 |
EVALUATION OF THE QUALITY OF DRINKING WATER IN KERALA STATE, INDIA |
Energy & Wetlands Research Group, Centre for Ecological Sciences, Indian Institute of Science, Bangalore – 560 012, INDIA
Citation: Karthick B., Boominathan M., Sameer Ali and Ramachandra T. V., 2010, Evaluation of the Quality of Drinking Water in Kerala State, India. Asian Journal of Water, Environment and Pollution, Vol. 7, No. 4, pp. 39 – 48.
Abstract
The quality of tap water from water supplies from 14 districts of Kerala state, India was studied. Parameters like pH, water temperature, total dissolved solids, salinity, nitrates, chloride, hardness, magnesium, calcium, sodium, potassium, fluoride, sulphate, phosphates, and coliform bacteria were enumerated. The results showed that all water samples were contaminated by coliform bacteria. About 20% of the tap water samples from Alappuzha and 15% samples from Palakkad district are above desirable limits prescribed by Bureau of Indian Standards. The contamination of the source water (due to lack of community hygiene) and insufficient treatment are the major cause for the coliform contamination in the state. Water samples from Alappuzha and Palakkad have high ionic and fluoride content which could be attributed to the geology of the region. Water supplied for drinking in rural areas are relatively free of any contamination than the water supplied in urban area by municipalities, which may be attributed higher chances of contamination in urban area due to mismanagement of solid and liquid wastes. The study highlights the need for regular bacteriological enumeration along with water quality in addition to setting up decentralised region specific improved treatment system.
Keywords: Tap-water quality, Drinking water quality, Kerala, Fluoride, Alappuzha, Palakkad
| * Corresponding Author : | |||
| Dr. T.V. Ramachandra Energy & Wetlands Research Group, Centre for Ecological Sciences, Indian Institute of Science, Bangalore – 560 012, INDIA. Tel : 91-80-23600985 / 22932506 / 22933099, Fax : 91-80-23601428 / 23600085 / 23600683 [CES-TVR] E-mail : cestvr@ces.iisc.ac.in, energy@ces.iisc.ac.in, Web : http://wgbis.ces.iisc.ac.in/energy |
|||
Introduction
The interactions between water and human health are indeed complex. Human health may be affected by the ingestion of contaminated water, either direct or through food, and by the use of contaminated water for purposes of personal hygiene and recreation. As per the recent estimates by the World Bank, 21% of communicable diseases in India are water related. With the importance of water supply and sanitation to health it is necessary to consider the status of these services globally and regionally. Those without access to an adequate and safe water supply and appropriate sanitation are those most at risk from waterborne diseases. Access to safe drinking water and adequate sanitation is a recognised universal human need. Population growth, industrialisation and agricultural development are leading to constantly increasing demands for water. Hence all countries are endeavoring to improve the evaluation of their water resources. Historically, civilizations in India, as around the world, have largely evolved and developed around water bodies as most human activities, including agriculture and industry depend on water. During the six decades of post independence, India has witnessed phenomenal development of water resources and has largely successfully met the demand of water for many of the diverse uses in the country. Infrastructure for safe drinking water has been provided to about 85 per cent of India’s urban and rural population. Water supply and sanitation were added to the national agenda during the first five-year planning period.
Drinking water system in Kerala is managed and maintained by the state government through the Kerala Water Authority (KWA) and local governments. The history of organized piped water supply in rural Kerala dates back to the beginning of twentieth century. KWA came into existence on 1st April 1984 in the place of the erstwhile Public Health Engineering (PHE). KWA is one of the main agencies for the design, construction, operation and maintenance of water supply and sewerage schemes in the whole state. KWA has been implementing piped water supply schemes based on surface and groundwater sources. It also executes water supply projects and accelerates rural water supply schemes on behalf of the government of India. In 2003, KWA were operating 63 urban and 1700 rural water supply schemes and 224 urban and rural water supply schemes were under different stages of implementation (State Planning Board, 2002). A survey conducted by Rajiv Gandhi National Drinking Water Mission revealed that in Kerala piped water reaches 20.4 million people, who constitute around 64 per cent of the total population as on July 2003, which includes 59 percent of the rural population and 79 per cent of the urban population. Alternative forms of water supply schemes existing in the state were community managed. Community management in drinking water supply recently emerged as an alternative to the prevailing institutional set up. All community managed schemes in the state are funded by either central government or external agencies like World Bank and Royal Netherlands Embassy. Jalanidhi is the community water supply schemes initiated in the state with the help of World Bank.
The water quality of ground water and surface water of Kerala state is continuously reported for high level of chemical and biological contamination. The Report of Fifth Five-Year Plan (Govt. of Kerala, 1974) of Government of Kerala revealed that 99 percent of the panchayats in Kerala faced drinking water scarcity of varying duration and intensity. Panikar and Soman (1984) studied the health status of Kerala and observed that diseases of gastro-intestinal system contribute to the largest proportion of diseases. Study by Aravindan and Kunhikannan (1987) in Alappuzha district revealed that diseases like diarrhea, dysentery, typhoid, worm infestations, and infectious hepatitis accounted for 50 percent of illnesses. Aravindan (1989) documented that Kollam district was one among the four districts with the highest rates of diarrhea mortality in the state. Abhayambika et al., (1989) observed that lack of protected water supply and inadequate toilet facilities were the major risk factors in the three southern districts of Kerala. Kannan et al., (1991) conducted a study in all the fourteen districts of Kerala on the health status of rural households and reported that the incidence of diarrhea cases was more among persons using public wells and public taps. An another survey (Anonymous, 1994) reported that Kerala is identified as the only place in the world with such large numbers of open dug-wells and by poor environmental conditions and unhygienic behavioural practices the drinking water sources get frequently contaminated; the incidence of water-borne diseases gets thereby aggravated. Radhakrishnan et al., (1996) on the bacteriological quality of water in the coastal Kerala showed that all the samples of dug-well water in the area were coliform positive. The MPN values ranged from 41 to 1200/100ml. It was further recorded that 20 wells out of 35 were located within a distance of 10 m from septic tank and 90 percent of the people in the area defecated in open places. A study conducted by Panicker et al., (2000) in Kottayam municipality on the bacteriological quality of various drinking water sources, indicated that almost all dug-well water samples had faecal coliform count much above the WHO standards. Pillai and Ouseph (2000) observed that more than half the Kerala population utilize dug wells as the sole source of drinking water and they also stated that outbreaks of water-borne diseases were due to consumption of contaminated water from poorly protected wells. Calvert and Andersson (2000) observed that sanitation is very poor in villages along the coast of Kerala. Over 80 percent of the households have no latrines and at least 50 percent obtained water from communal wells, which is heavily contaminated due to open-air defecation and nearby pit-latrines. Rahiman et al., (2003) examined the bacteriological quality of water from wells at Ponnani, revealed that most of the samples had human faecal pollution. All the strains of Escherichia coli encountered in the samples showed multiple antibiotic resistances. Panicker et al., (2000) studied in the bacteriological quality of Kottayam municipality on various drinking water sources, indicated that almost all dug-well water samples had faecal coliform count much above the WHO standard. A study on the bacterial quality of water in selected wells in Kerala jointly conducted by Kerala Water Authority and Kerala Pollution Control Board (KWA, 1991) showed that water in none of the open wells investigated was safe for drinking. This was a startling observation because more than 50 percent of the population of Kerala used dug-well water for drinking. The study also indicated the need for a detailed investigation for finding out the factors related to the deterioration of water quality in the state.
The scope of the present study is the evaluation of drinking water quality, based on a set of specific parameters, in all geographical regions of Kerala. No pertinent published data were found in literature, although scattered results may be found in unpublished reports of government agencies. Most of the parameters selected for analysis are obligatory from the Indian standard specifications for drinking water IS: 10500 (Reaffirmed 1993), comprising both physicochemical (i.e. pH, conductivity and total dissolved solids) and chemical properties which are related to the hardness (Cl-, Na+, K+, Ca2+ and Mg2+), ions (F ˉ, NO3ˉ, PO43, and SO42ˉ ) as well as coliform bacteria.
Study Area
Kerala State located in the south-western corner of India has a total geographic area of 38,863 km2 (Fig.1). According to the 2001 census Kerala's population is 31.84 million persons which included 15.47 million males and 16.37 million females. Although Kerala accounts for only 1 per cent of the total area of India, it contains about 3 per cent of the country's population. The population density of the state is about 819 people per square kilometer, three times the national average. Kerala is one of the densest states in the country and it recorded a decadal population growth of + 9.42% (2,740,101 persons). By year 2050 the population in Kerala is likely to grow to two times that figure i.e., 64 million. Hence, there is considerable pressure on all natural resources especially water and land resources. Concerted efforts to formulate proper plans for sustainable development of water resources in Kerala are therefore very important.
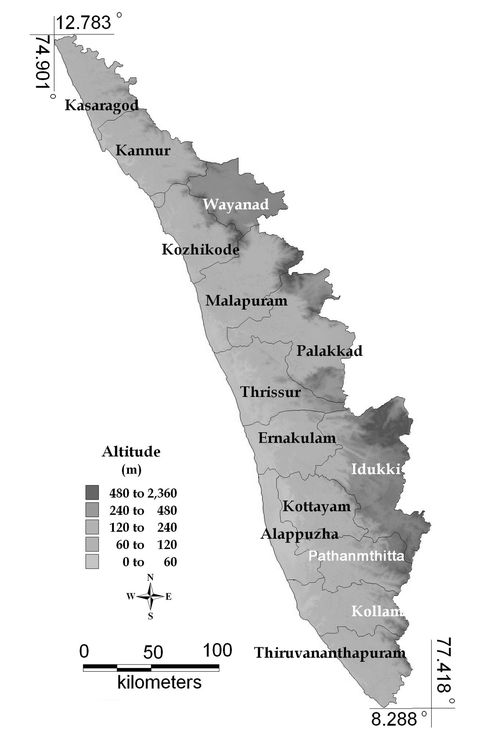
Fig 1. Kerala with district boundary and topography
Methods
A total of 87 sites scattered throughout Kerala was chosen, covering all 14 districts. At least four samples were collected from each district. For statistical purposes Kerala was divided into fourteen geographical regions (Fig. 2) to which the results presented herewith correspond. Samples were collected as per the established protocols and precise instructions, avoiding any contamination during sampling and transportation. The samples were collected from randomly selected frequently used municipal and/or communal water supply taps of a village or town during the pre-monsoon of 2007 (April and May). Samples were collected after clearing stagnant water in the tap (for about one minute). In addition, for each sample a detailed questionnaire was completed with information regarding its exact origin and nature of treatment.
Water samples were collected from each source in clean polythene containers of 2.5 L capacity. The sample containers were labeled with a unique code and date of collection. pH, water temperature, Total Dissolved Solids, Salinity and Nitrates were recorded on spot using EXTECH COMBO electrode and Orion Ion Selective Electrode. Other parameters like chloride, hardness, magnesium, calcium, sodium, potassium, fluoride, sulphate, phosphates, and coliform bacteria were analyzed in lab. All analyses were carried out as per methodologies in Standard Methods for the examination of water and wastewater APHA (1998). Detailed Methods are listed in Table 1. Coliform bacteria were estimated by using standard Multiple Tube Fermentation Technique (MTFT), nine multiple tube dilution technique using double and single strength Bromo-Cresol Purple MacConkey medium and Membrane filter techniques by using M-EC test agar and MPN Index was calculated from MPN table (APHA 1998). All analysis and plots of data in this article were carried out in the statistical and programming environment R (http://www.r-project.org).
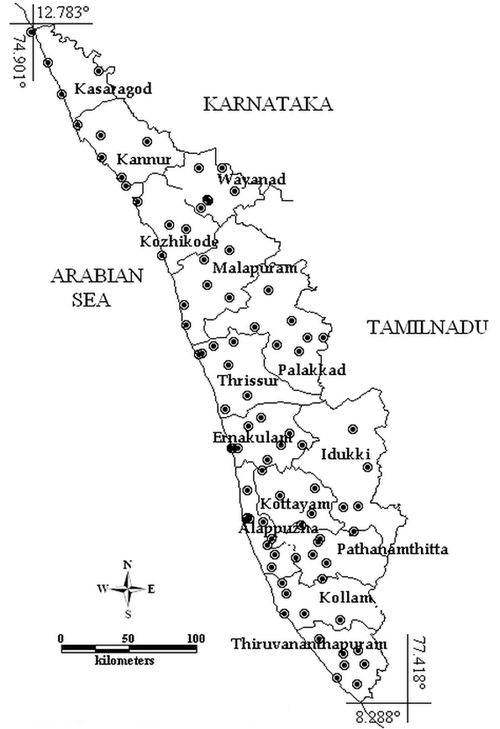
Fig 2. Tap water sampling points in Kerala districts
Parameters |
Units |
Methods |
Section no. APHA, 1998. |
| pH | - | Electrode Method | 4500-H+ B |
| Water Temperature | ºC | ||
| 2550 B | |||
| Salinity | ppm | ||
| 2520 B | |||
| Total Dissolved Solids | ppm | ||
| 2540 B | |||
| Electrical Conductivity | µS | ||
| 2510B | |||
| Dissolved Oxygen | mg/L | Iodometric method | 4500-O B |
| Alkalinity | mg/L | HCl Titrimetric Method | 2320 B |
| Chlorides | mg/L | Argentometric Method | 4500-Cl- B |
| Total Hardness | mg/L | EDTA Titrimetric Method | 2340 C |
| Calcium Hardness | mg/L | EDTA Titrimetric Method | 3500-Ca B |
| Magnesium Hardness | mg/L | Calculation Method | 3500-Mg B |
| Sodium | mg/L | Flame Emission Photometric Method | 3500-Na B |
| Potassium | mg/L | Flame Emission Photometric Method | 3500-K B |
| Fluorides | mg/L | SPADNS method | 4500-F- D |
| Nitrates | mg/L | Nitrate Electrode method | 4500-NO3- D |
| Sulphates | mg/L | Turbidimetric method | 4500-SO42- E |
| Phosphates | mg/L | Stannous Chloride Method | 4500-P D |
| MPN/100 | mg/L | Multiple Tube Fermentation Technique | 9221 B |
Results & Discussion
According to the data collected, drinking water sources in Kerala are distributed as follows: bore holes (12.79%) and, streams and rivers (87.2%). The range and mean value of each water quality parameter are listed in Table 2. In all drinking water samples examined in the present study, the parametric values set in accordance with Bureau of Indian Standards, Drinking Water Specification: IS: 10500, (Reaffirmed 1993) were exceeded by 12.79% of the samples examined for pH, followed by those examined for total dissolved solids (10.46%) and fluoride (8.13%), whereas regarding nitrates, alkalinity, chlorides, hardness, calcium, and magnesium, the violations correspond to less than 5% of the total number of samples analyzed (Table 3).
Table 2. Range and Mean value of water quality parameters recorded in this study
Parameters |
Range |
Mean±SD |
pH |
5.93-9.05 |
7.17±0.58 |
Water Temperature |
25.6-34.8 |
31.64±1.83 |
Salinity |
5.8-1380 |
159.05±184.12 |
Conductivity |
2.5-27700 |
597.00±2968.02 |
Total Dissolved Solids |
9.2-1920 |
222.34±256.89 |
Alkalinity |
4-304 |
51.35±57.86 |
Chlorides |
10.01-1751.92 |
60.00±187.92 |
Hardness |
12-500 |
61.16±76.94 |
Calcium |
1.28-440.88 |
19.89±47.95 |
Magnesium |
0.18-80.76 |
10.07±11.78 |
Sodium |
0.37-1259.6 |
34.75±138.43 |
Potassium |
0.39-53.9 |
5.68±7.17 |
Fluorides |
0.1-1.6 |
0.55±0.30 |
NO3- |
0.01-54.9 |
4.83±9.88 |
SO42- |
0.01-71.51 |
8.77±13.32 |
Phosphates |
0.01-0.40 |
0.09±0.08 |
MPN/100 |
2-350 |
32.09±64.00 |
Table 3. Percentage (%) of samples analyzed in the present study in which the parametric values are above desirable and above permissible limits of BSI, Drinking Water Specification: IS: 10500, (Reaffirmed 1993)
Parameter |
% of samples above desirable limits |
% of samples above maximum permissible limits |
pH |
12.79 |
No relaxation |
NO3- |
3.48 |
0 |
Alkalinity |
3.48 |
0 |
Chlorides |
1.16 |
1.16 |
Hardness |
2.32 |
0 |
Calcium |
2.32 |
1.16 |
Magnesium |
5.81 |
0 |
Fluorides |
8.13 |
3.48 |
SO42- |
0 |
0 |
Total Dissolved Solids |
10.46 |
0 |
Coliform |
67.44 |
No relaxation |
In terms of geographical distribution, most parameters were beyond desirable limits were recorded in 20% of the sites of Alappuzha district, followed by Palakkad (20%) and Thrissur districts (12%). It is also noteworthy that one fourth of the Kerala’s population resides in these three districts. Importantly the samples recorded above permissible values belong to Palakkad and Alappuzha districts for chlorides, hardness, calcium, and fluoride (Table 4).
Table 4. Percentage (%) of sites from each district studied in the present study in which the parametric values are above desirable and above permissible limits of BSI, Drinking Water Specification: IS: 10500, (Reaffirmed 1993) with the parameters
Districts |
% of sites |
Parameters |
Kasargod |
2 |
Coliform |
Pathanamthitta |
3 |
pH, Coliform |
Idukki |
4 |
pH, Coliform |
Kollam |
4 |
pH, Coliform |
Kozhikode |
4 |
Coliform |
Malappuram |
4 |
Coliform |
Kottayam |
6 |
Magnesium, TDS |
Thiruvananthapuram |
6 |
pH, F, Coliform |
Wayanad |
6 |
pH, F, Coliform |
Ernakulam |
7 |
Coliform |
Kannur |
8 |
pH, Coliform |
Thrissur |
12 |
pH, TDS, Colifrom |
Palakkad |
15 |
pH, Alka, Ha, Calcium, Magnesium, F, TDS, Coliform |
Alappuzha |
20 |
pH, NO3, Alkalinity, Chlorides, Hardness, Calcium, Magnesium, Fl, TDS,Coliform |
Physico-chemical parameters
In all samples pH values vary from 5.93 to 9.05, with an average of 7.17±0.58. In 68% of the study site it was in neutral state (Fig. 3). It is noted that water should be preferably slightly alkaline in order to assure protection of pipe work and metallic fittings from corrosion. Water temperature ranged from 25.6 to 34.8°C. The highest total dissolved solid values were detected in the Alappuzha district (1920 mg/L), followed by those determined in the Thrissur district (702 mg/L) and Palakkad district (611.4 mg/L) (Fig. 3).
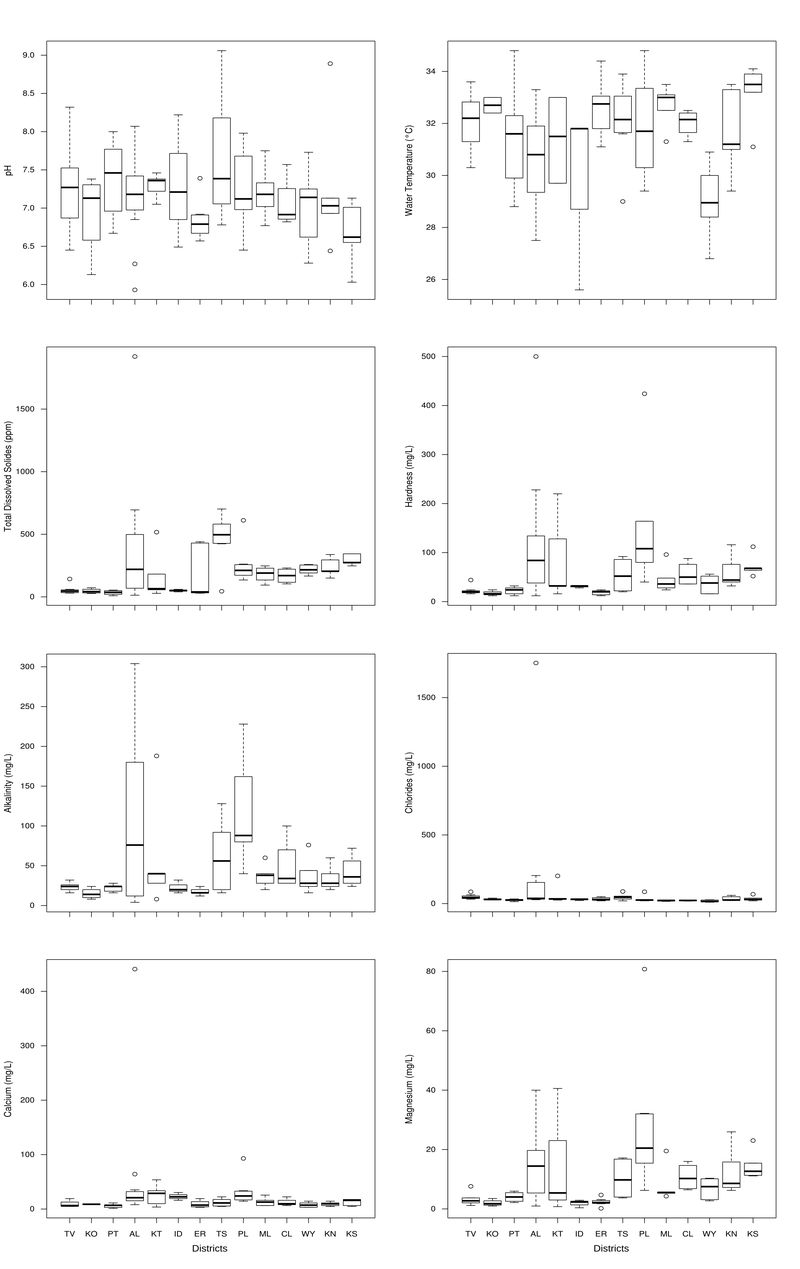
Fig 3 : Box plot of pH, water temperature, total dissolved solids, hardness, alkalinity, Cl-, Ca2+ and Mg2+ in drinking water from the fourteen districts in Kerala.(TV – Thiruvanthapuram; KO – Kollam; PT – Pathanamthitta; AL – Alappuzha; KT – Kottayam; ID – Idukki; ER – Ernakulam; TS – Thrissur; PL – Palakkad; ML – Malappuram; CL – Kozhikode; WY – Wayanad; KN – Kannur; KS – Kasaragod)
The highest concentrations of chloride, hardness, calcium, fluoride, sodium and potassium were found in Alappuzha districts (1751.92 mg/L – 500 mg/L – 440.88 mg/L, – 1.6 mg/L,– 1259.6 mg/L, – 53.9 mg/L, respectively), followed by the Palakkad district records 86.09 mg/L – 424mg/L – 92.99mg/L, – 1.4mg/L – 69.78mg/L, – 13.77mg/L, respectively. Higher level of ionic values are also observed in Thrissur and Kottayam districts (Fig. 3), indicating that in all these area the “parent” water is enriched with salt that occurs either naturally or due to over pumping, resulting in intrusion of marine waters in the ground water. Calcium and magnesium are known to occur naturally in water due to its passage through mineral deposits and rock strata and contribute to its total hardness. Their highest concentrations, particularly those of magnesium, recorded in Palakkad and Kottayam districts (80.77 and 40.58 mg/L respectively) (Fig. 3).
Concentration of NO3ˉ, PO43, and SO42ˉ
The highest concentrations of nitrates were found in samples from the Alappuzha district varying from 17.1 to 54.9, with an average of 33.26 mg/L), followed by those recorded in the Idukki (9.8; 11.4 mg/L), Kannur (7.61; 8.27 mg/L) (Fig. 4). Violations of the parametric value of Drinking Water Specification: IS: 10500, (Reaffirmed 1993) were detected exclusively in Alappuzha district. Nitrates originate from fertilizers of potassium nitrate and/or ammonium nitrate. Since these salts are very soluble and do not bind to soils, nitrates migrate easily to ground waters and more importantly this particular district’s water supply is mainly depend on the ground water. The highest concentrations of nitrates were indeed determined in the areas of Alappuzha which are characterized by intensive agricultural activity such as lowland rich cultivation. This district is also called as “rich bowl of Kerala”
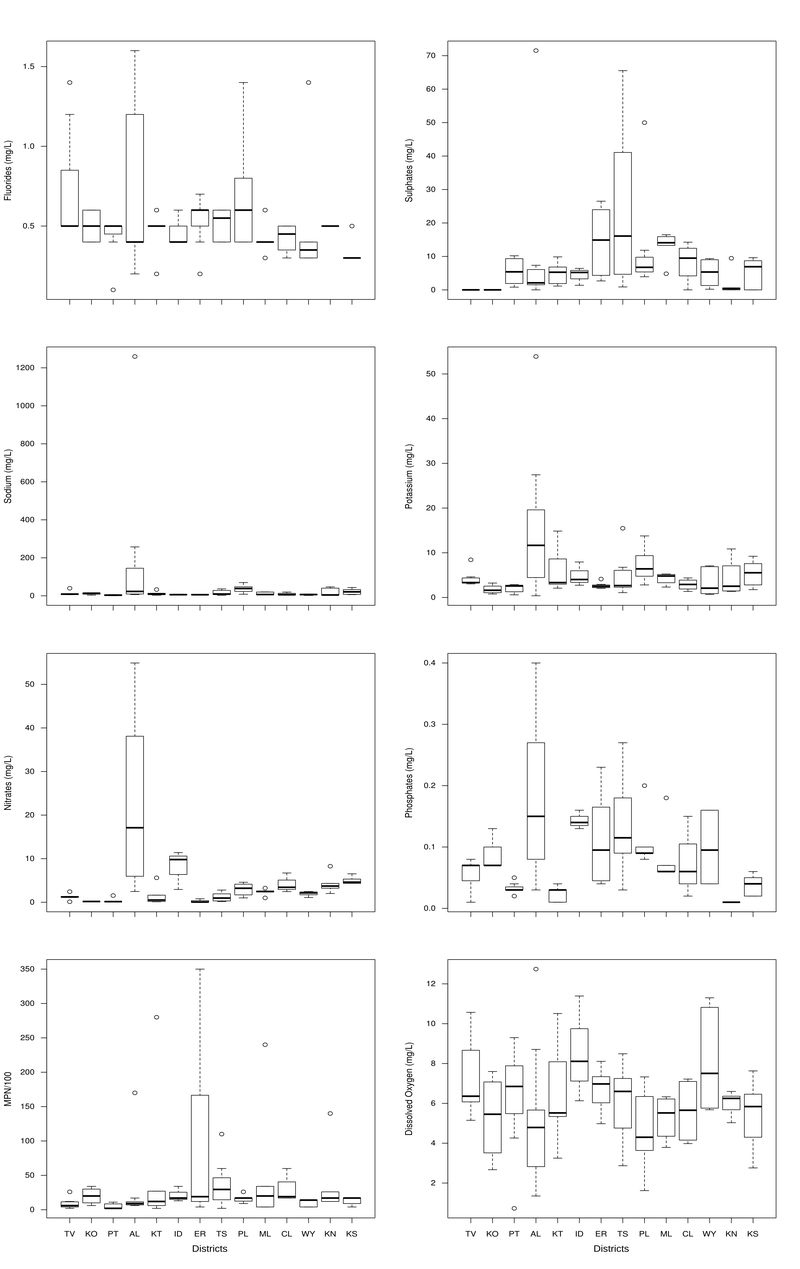
Fig 4: Box plot of Fˉ, SO42-, Na+, K+,NO3ˉ, PO43, MPN index and dissolved oxygen in drinking water from the fourteen districts in Kerala.(TV – Thiruvanthapuram; KO – Kollam; PT – Pathanamthitta; AL – Alappuzha; KT – Kottayam; ID – Idukki; ER – Ernakulam; TS – Thrissur; PL – Palakkad; ML – Malappuram; CL – Kozhikode; WY – Wayanad; KN – Kannur; KS – Kasaragod)
Regarding phosphates, their highest values were determined in Kannur (0.4 mg/L as P) followed by those found in Alappuzha (0.39 mg/L as P), whereas in the Ernakulam and Thrissur district relatively elevated value (0.23 and 0.27 mg/L as P respectively) was detected in single sample each. Elevated phosphate concentrations originate mainly from anthropogenic sources, which include domestic waste waters rich in sewage and detergents, agricultural run-off enriched in inorganic fertilizers, manure and sludge from cattle raising farms, wastes of pulp and paper industry, vegetable and fruit processing, as well as manufacturing of chemicals, fertilizers and detergents. Back waters in Alappuzha districts receive runoff from a surrounded agricultural area and sewage from the human habitation all around the back waters.
In the case of sulphates, the highest value (71.51 mg/L) recorded from a site at Alappuzha district and followed by samples from Thrissur district with parametric value of 65.53 and 51.39 mg/L (Fig. 4). Sulphates occur naturally in many source waters coming in contact with particular rock strata and mineral deposits (mainly gypsum) (Beamonte et al., 2007). Health concerns regarding sulphate in drinking water have been raised due to reports claiming that diarrhea may be associated with the consumption of water rich in sulphates.
The parametric value of fluoride was exceeded in drinking water samples from Alappuzha (1.6 mg/L), Palakkad (1.4 mg/L) and Thiruvananthapuram (1.2 mg/L) districts (Fig. 4). Fluoride occurs naturally in waters and the threat it poses to public health may be attributed to long-term consumption of water containing excess fluoride. Continuous consumption of fluoride are used up in excess (more than 1.0 ppm); it can cause different kinds of health problems which equally affect both young and old (WHO, 1984). The endemic fluorosis in India is largely of hydro-geochemical origin. It has been observed that low calcium and high bicarbonate alkalinity favor high fluoride content in groundwater. The high fluoride in these districts is primarily derived from the country rock, i.e. hornblende biotite gneiss, since no man-made pollution related to fluoride is noticed in the area. Higher fluoride concentration exerts a negative effect on the course of metabolic processes and an individual may suffer from skeletal fluorosis, dental fluorosis, nonskeletal manifestation or a combination of the above (Susheela and Kharb, 1990; Susheela and Kumar, 1991).
Coliform Contamination
All tap water samples showed the positive result for the presence of coliform bacteria, which records 100% of the samples contaminated with coliform contamination. The samples from Ernakulam districts showed high count of coliform bacteria (350 organisms/100 ml) followed by Kottayam, Malappuram and Alappuzha (280; 240; and 170 organisms/100 ml respectively). BSI Drinking Water Specification: IS: 10500, (Reaffirmed 1993) suggest that coliform organisms should not be more than 10 per 100 ml in any sample. According to the above said legislation about 67.44 % of samples are above permissible level. In all this cases the contamination of water takes place at the river before it get pumped in to the water supply reservoir. Central Pollution Control Board reported that the major water quality problem associated with rivers of Kerala is bacteriological pollution. Our own investigations shows more than 90% of surface water and ground water are contaminated with coliform.
The nature of the parameters studied in which violations were observed (Table 3) indicates that the elevated concentrations found may be attributed to the following: Excesses in nitrates and fluorides indicate many causes of pollution either of surface or ground water. Considering groundwater in particular, such substances may be associated with health risks. Groundwater is rarely treated (except for chlorination), due to the fact that it is presumed to be largely immune to these types of pollution that usually enter surface water. However, its contamination by anthropogenic, aboveground activities — domestic, agricultural, industrial etc is not uncommon. Furthermore, many groundwater wells contain naturally occurring pollutants, such as sulphates and fluoride at high concentration.
Excesses in chloride, sodium and total dissolved solids indicate intrusion of seawater into the related aquifers due to the excessive extraction of water by pumping. All cases of violation of the parametric values recorded in the present study correspond to samples collected from Alappuzha and Thrissur districts areas located near the seashore. It is noteworthy that the parametric values of legislation were exceeded in 20% of sites in the Alappuzha district and 15% of sites in the Palakkad district with scarce water resources (Table 5). Despite the fact that the mineralogical background of a region is importance, the quantitative and qualitative problems seem closely interlinked. Excesses in the Alappuzha and Palakkad districts are followed by Thrissur (12%) and those of the coastal districts Kannur (8%) and Ernakulam (7%).
Table 5. Percentage (%) of sites from each one of the geographical regions studied where the parametric values set in accordance with Drinking Water Specification: IS: 10500, (Reaffirmed 1993) are exceeded. The last column shows the parameters among those examined in which excesses were observed
Districts |
% contamination |
Parameters |
Alappuzha |
85.71 |
Chlorides, Hardness, Calcium, Fl |
Palakkad |
14.28 |
Hardness |
It should be underlined that maximum of violations of the parametric values took place in district which is the densely populated district in Kerala (1492/km²) and having the maximum floating population as tourists. The violations of the parametric values in hilly districts in Pathanamthitta, Wayanad and Idukki were detected less than 5%. In these places violations are observed in pH and coliform, which is acidic due to organic material leaching from forest floors and defecation in open respectively. The districts of Kasargod, Pathanamthitta, Idukki, Kollam, Kozhikode, Ernakulam and Malappuram recorded only coliform violations. Even though Ernakulam district samples violated only coliform, this district need a special attention because the maximum coliform count (350 organisms/100ml) recorded here. It is also important to make a note on the decades old poorly maintained pipe supply system, which can be good host for development of bacterial biofilm. The phenomena of treated water getting contaminated in pipe supply before it reaches the consumer’s tap are well documented (Percival et al., 2000). Moreover the proportion of waterborne disease outbreaks associated with the distribution system failures has been increasing over the years (Moe and Rheingans, 2006).
Among the samples collected from urban areas, 87.8% of the samples are beyond the permissible limit as per BIS standards, of which 65.85% of samples were with one parameter exceeding the permissible range, 19.51% of samples with two parameters and 2.44% of sites with more than two parameters. In case of rural samples 73.33% of samples exceed the desirable limit, of which 48.89% of sites were with one parameter exceed the permissible range, 20% of sites with two parameters and 4.44% of sites with more than two parameters. Even though, only 26.67% of rural samples are within the BIS drinking water permissible limit, it supplies good quality water than urban water supply systems, whose samples only 12.2% are within the BIS drinking water permissible limit. In general rural water supply schemes supply a better quality of water than the water supplied in the urban area. This could be attributed to less contamination in the source (river/bore well) in rural area and also to poor treatment facilities in urban water supply coupled with the high contamination in the river and groundwater in the urban area.
Conclusion
The present study investigates the drinking water quality of Kerala state with an aim to understand their potability. It is concluded that drinking water supplied all over the state is contaminated with coliform bacteria. The quality of water supplied in Palakkad and Alappuzha districts are not in the desirable limit prescribed by Bureau of Indian Standards Drinking Water Specification: IS: 10500. The most important deviations from good quality, reflected in excesses of the levels provided by BIS Drinking Water Specification, were found in water stressed low land, Alappuzha district. Their freshwater resources are scarce; the “parent” waters are frequently affected by marine water intrusion into the aquifers and the water distribution method (supply of water by boat with tank) is very unhygienic in condition. Community owned reverse osmosis units can be supplied to each island villages of this district, which can provide good-quality water. The next, which records violation of water quality standards, is Palakkad. This district receives very less rainfall (233cm/year), when comparing with all other districts of the state. In this district along with the improved water treatment facility rain water harvesting programs should be promoted to increase the depleted ground water table. The problems found in the rest of Kerala are mostly related to the contamination of source water (surface and ground waters) by agricultural run-off or percolation of waters laden with agrochemicals (e.g. nitrates, phosphates). Comparatively, water supplied in rural areas are better in water quality than the water supplied in urban area by municipalities, which may be attributed higher chances of contamination in urban area due to mismanagement of solid and liquid wastes..
A statewide water quality monitoring network should be established as soon as possible. Specifically, the state monitoring network should include at least the following important elements such as, measurement of a core set of variables at all water distribution centers, with regional flexibility to measure additional variables where needed, followed by technical coordination that establishes standard procedures and techniques with respect to the state local condition and periodic review of the monitoring water supply system. The treatment facilities observed all over Kerala confirms that the currently followed treatment is only chlorination without any scientific knowledge on the water quality of source. In most of the cases the chlorination is not sufficient enough to kill the bacteria.
Acknowledgement
This work was funded by Malayala Manorama as a part of “Palathulli” project. The authors are thankful to the Mr Ajith Babu, Mr Thomas Mathew and many local reporters of the Malayala Manorama newspaper for their assistance during the fieldwork. We are also thankful to Dr Ahalya, Dr K V Gururaja, Dr Sudhira K G Avinash and Ms Malvikaa for their help in fieldwork and laboratory analysis.
References
- Abhayambika, A., Devi, K.I., Nathan, N., Varghese, M.O., 1989. Epidemiological study of diarrhoeal diseases in Southern Kerala, Proceedings of Kerala Science Congress, pp. 237-238.
- Anonymous, 1994. “Jalasandesh”- Potwats Programme – promoting intensive chlorination of wells, Socio- Economic Units, Kerala. 6 (3).
- APHA, 1998. Standard Methods for the Examination of Water and Wastewater. American Public Health Association, Washington DC.
- Aravindan, K. P., 1989. A study of epidemic diarrhoeal deaths in Kerala, Proc. Proceedings of Kerala Science Congress, pp. 361-366.
- Aravindan, K.P., Kunhikannan, T.P. (Eds.), 2000. Health Transition in Rural Kerala: 1987-1996, Kerala Sastra Sahithya Parishad, Trivandrum.
- Beamonte, E., Bermuder, J.D., Casino A., Veres, E., 2007. A statistical study of the quality of surface water intended for human consumption near Valencia (Spain). J. Environmental Management. 83, 307–314.
- Calvert, P., Andersson, I., 2000. The compost toilet: A positive experience in Kerala, India, Global Environment Sanitation Initiative. Water Supply Sanitation Collaborative Council, Geneva.
- Government of Kerala, 1974. Fifth Five-Year Plan (1974-79), Trivandrum: State Planning Board.
- Indian Standard Specifications for Drinking Water - IS: 10500 http://www.indiawaterportal.org/blog/wp-content/uploads/2008/07/is-10500.pdf (Accessed on 25 October 2008)
- Kannan, K.P., Thankappan, K.R., Kutty, V.R., Aravindan, K.P., 1991. Health and development in rural Kerala, Kerala Sastra Sahitya Parishad. Kerala.
- Kerala Water Authority, 1991. The bacterial quality of water in selected wells in Kerala, Socio-economic Units, Kerala. Integrated water supply & sanitation programme.
- Moe, C., Rheingans, R., 2006. Global challenges in water, sanitation and health. Journal of Water Health 4, 41-57.
- Panicker, S., Basi, E., Alexander, P.K., Ravindran, P.C., 2000. Assessment of bacteriological quality of potable water and evaluation of water purification technique, Proceedings of 12th Kerala Science Congress. pp.75-76.
- Panikar, P.G.K., Soman, C.R., 1984. Health status of Kerala. (CDS), Thiruvananthapuram: Centre for Development Studies.
- Percival, S., Walker, J., Hunter, P.R., 2000. Microbiological aspects of biofilms and drinking water. CRC Press, Inc., Boca Raton, FL. pp.361-366.
- Pillai M.G., Ouseph, P.P., 2000. Water quality management in wells – a case study. Proceedings of the XII Kerala Science Congress (Ed.M.R. Das), STEC, Thiruvananthapuram, 17-22.
- Radhakrisnan, A., Dina, S., Shaji, C., Thankamani, V., Calvert, P., 1996. Bacteriological quality of water from a coastal village - Pulluvila (Kerala), Proceedings National seminar on rural water supply and sanitation. Trivandrum. pp. 147-148.
- Rahiman, K. M.M., Chandran, A., Hatha, A. A. M., 2003. Bacteriological quality of well water samples of Ponnani, a village at sea coast of Kerala. Indian Journal of Microbiology, 43 (2), 141-142.
- State Planning Board, 2002. Report on Kerala Water Authority, Trivandrum: Government of Kerala.
- Susheela A.K., Kumar A., 1991. A study of the effect of high concentrations of fluoride on the reproductive organs of male rabbits, using light and scanning electron microscopy. J Reproductive Fertility. 92(2), 353-60.
- Susheela, A.K., Kharb, P., 1990. Aortic calcification in chronic fluoride poisoning: biochemical and electronmicroscopic evidence. Experimental and Molecular Pathology. 53, 72–80.
- WHO, 1984. Guidelines for Drinking Water Quality. Vol.1. Recommendations, World Health Organisation. Geneva.