Abstract:
Much of the Bangalore sewage is treated in three streams namely Bellandur (K&C Valley),
Vrishabhavati and Hebbal-Nagavara stream systems. Among these it is estimated that a total of
about 500 MLD of partially treated sewage is let into the Bellandur tank. We estimate that a total of
about 77 t N non-industrial anthropogenic nitrogen efflux (mainly urine and excreta) originates in
Bangalore city. This is distributed between that handled by the sewage streams, soak-pits and land
deposition. About 17-24.5 t N enters the Bellandur tank daily. This has been happening over a few
decades and our observations suggest that this, approximately 380 ha, tank is functioning as a C
and N removal system with reasonable efficiency. The ammoniacal and nitrate nitrogen content of
the water at the discharge points were estimated and found that over 80% of the nitrogen influx
and over 75% of the C influx is removed by this tank system. We observed that there are three
nitrogen sinks namely bacterial, micro-algal and macrophytes. The micro-algal fraction is
dominated by Microcystis and Euglenophyceae members and they appear to constitute a
significant fraction. Water hyacinth represents the single largest representative of the macrophytes.
This tank has been functioning in this manner for over three decades. We attempted to study this
phenomenon from a material balance approach and showed that it is functioning with a reasonable
degree of satisfaction as a natural wetland. As the population contributes and as the concomitant
influx into this wetland increases, there is a potential for the system to be overloaded and collapse.
Therefore, a better understanding of its function and the need for maintenance is discussed in the
paper.
Keyword: Wetlands, Bellandur Lake, Wastewater, Carbon flow, Nitrogen flow
Introduction
In many cities of India the sewage streams are treated as natural and quasi-natural ecosystems
evolved at the location. For example, in Kolkata the tidal lakes, in Chennai two riverine systems
and in Bangalore man-made lake systems are responsible to a large extent for the treatment of
sewage. Each of these ecosystems displays unique interspecies balance that tends to take up
various amelioration functions in the removal of carbon, nitrogen and phosphate. Sewage transport
and treatment in Bangalore follow natural water courses along the three directions of
Vrishabhavaty, Koramangala-Challaghatta (K&C) and Hebbal-Nagavara valley systems. In the
case of Bangalore there have been attempts to provide primary treatment to sewage before it
enters a lake or other waterbodies. However, the capacities of the treatment plants have always
fallen short of the actual discharge. Thus, Bellandur tank (K&C Valley) has always been required to
provide the necessary remediation function for this man-made neglect. While assessing damage it
is important to note that urban ecosystems significantly differ from the rural crop ecosystems in
typical semi-arid zones such as Bangalore with regard to the C and N cycling. While rural crop
ecosystems usually function as C and N deficient systems, there is a far higher deposition of C and
N in urban soils, including a high degree of variations. They are limited by the rates of
mineralisation and return to the resource pool.
C and N Dynamics
The need for efficient C and N-cycling is best described by Janzen (2004) in which the probability
of each of us inhaling one molecule of N that has passed through Julius Caesar is estimated to be
close to 0.995. It serves as a powerful example to show how dependent we are in ensuring that the
carbon and nitrogen we use are returned and recycled quickly. In today’s context of sustainability
we also need to ensure that we do not compromise the ability of the future generations’ to re-use
this C and N resource. In Bangalore, with manifold increase in its population, much higher levels of
carbon and nitrogen use exists. Consequently, deposition is high and hence the cycling time needs
to be short and as the quantities involved are higher, the fluxes intensify. Today, when we use so
much more of the C and N resources, it is necessary to rephrase the question - how many times
does an average N molecule cycle through each one of us in our own lifetimes?
Currently there is very little knowledge about C and N dynamics of urban soils especially with
regards to the pool sizes and their relationships with transfers and losses from and to these pools.
Usually recourse is possible to taking up a well established mass-balance approach (Lauver and
Baker, 2000; Rodriguez and Macias, 2005. Chanakya and Sharatchandra, 2006). In the case of
semi-arid agriculture around Bangalore, typical land use and agronomic practices lead to soils and
crops being constantly in an N-deficit regime and consequently such soils function as N-sinks
(Muller, 2005). Urban soils suffer from large influxes of C and N in various forms. In a developing
country situation characterised by frequent C and N influxes brought about by open urination
and/or defecation, use of septic tanks, soak-pits, open sewerages, etc., it may said that there will
be a disproportionately large C and N influx into soils with few natural mechanisms that function as
a sink. From a soil perspective, it is similar to over-manured crop stands where plants accumulate
large quantities of photosynthetically inactive soluble proteins (functionless proteins- Bauera et al,
2004). Such phenomenon of C/N-accumulation in the absence of soil disturbance could mean
accumulation of C and N in soil with potential for very high N-leaching losses (Brye et al, 2003). In
a location where population depends to the tune of 25% on groundwater, high N-leaching potential
requires resource consuming interventions remediate high C and N in drinking water. Such efforts
require interdisciplinary knowledge driven decisions and trade offs between perceived damage,
actual damage and anticipated costs of efforts.
In the case of Bangalore, (at potential per capita deposition of 20 g N capita-1.d-1, Lauver and
Baker, 2000) a population density of 200 person.ha-1 this translates into a N-flux of 1.5 t.ha-1.yr-1.
Obviously the quantities are far too large for any soil-plant-water system to assimilate. However,
like in a cropping system it is important to disaggregate the various N-cycle processes for an urban
setting at a city level /settlement level and determine N-movement and problems. Typically N–pool
sizes may be determined as input-output mass balances (Rodriguez and Macias, 2005: Chanakya
and Sharatchandra, 2006)
Ndep + Nfix = Ni + Nu + Nad + Nfire + Neros + Nvol + Nle
(where dep=deposition, fix-microbial fixation, i-immobilization, u-uptake, eros-erosion, vol-volatilization and le-leaching).
In resource-constrained Indian ecosystems, where re-use and recycle have long been in practice,
we need to reexamine these issues and processes at a higher hierarchic level of sustainability
assessment. The cases of carbon and nitrogen are taken as an example for discussion in this
paper. The human wastes are deposited on land as well as discharged as sewage and within 15
km of flow it enters the Bellandur tank system. The N in sewage is an important N-resource that is
now appreciable in size and can be considered as a resource inadequately and improperly utilised.
Much of the urban soils could be compared to typical wastelands that have very tight C&N-cycles
that tend to deteriorate with abuse. When human wastes are deposited on land it significantly
influences the C&N-cycles making it favourable only to a few plant and animal species to thrive
typical ‘waste/barren lands’. C&N fractions that cannot be held by the soil system quickly enter the
groundwater system and causes quality deterioration. When human wastes are transported
through sewage systems, a significant decomposition occurs near the entry points of waterbodies
or where the flow slows down. Some of the C is released as methane and/or carbon dioxide
depending on the redox levels during its decomposition. We firstly estimate and validate the size
of C and N pool that enters the Bellandur lake system. We also examine how sewage abuse in
peri-urban agriculture can threaten water quality in terms of nitrate toxicity in drinking water. We
target resource recycling and to some extent environment and remediation objectives in a larger
perspective of sustainability goals.
Estimation of C and N
We first estimate the overall C and N deposited as excreta and urine (human and animal origin) in
the city of Bangalore. It has been previously estimated that about c.88% of this enters the overall
sewage systems. This sewage fraction may be either as underground drainage (UGD) sewage
systems or as household (HH) level septic tanks. About 40% of UGD sewage load in Bangalore is
estimated to reach Bellandur lake. From this we have estimated the total C and N input into the
lake. In volume terms, it is estimated that 384-500 million litres per day (MLD) enter this lake.
From the concentrations of water discharged from the lake, we attempt to estimate the overall
functioning of the lake to remove C and N from the waters. As the composition of sewage entering
the lake is highly variable, we take recourse to using deposition estimates as the extent of C and N
entering the lake.
Table 1: Estimates of carbon and nitrogen generated in Bangalore and that entering Bellandur
lake system (all values are in tons per day except percentage figures, extracted from Chanakya
and Sharatchandra, 2006)
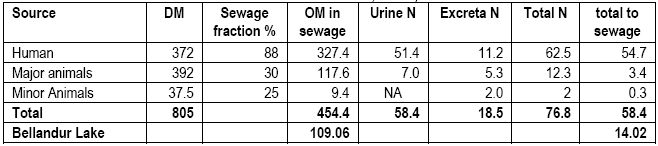
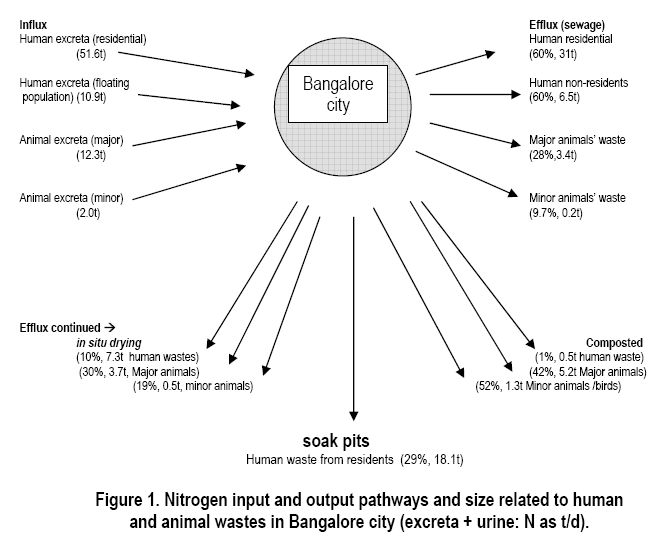
Chanakya and Sharatchandra (2006, Table 1, Figure 1) have determined the quantities of carbon
and nitrogen that enter the sewage systems from various human and animal sources in the city of
Bangalore. They also identified that human and animal excreta are subject to four different kinds of
treatment /disposal namely the fractions:
- entering the underground sewage lines to be disposed by Bangalore sewerage system,
- discharged as sewage but into household level soak-pits,
- subject to open discharge (open defecation in case of human beings) and
- subject to composting – more of animal wastes and very little of human waste
(experimental).
It is also important to note that while nearly 89% of human excreta enter the sewage system, only
about 28% of the milch and meat animal wastes enter the sewage system. A larger fraction of the
animal wastes is subject to composting. While the carbon fraction of sewage originates largely as
human excreta (@ 60 g TS/capita/d) the nitrogen is derived from two sources namely, human
excreta and urine. It was estimated that about 60% of the overall human waste and urine only
enters the conventional sewage system and a significant fraction is disposed through household
level soak pit systems or through open defecation /urination. In their study it has been estimated
that 40% of the overall sewage generated in the city reaches the K&C valley system (the Bellandur
tank). From this as indicated in Table 1, about 109 t of C and 14.02 t of N enter the sewage stream
that finally enters the Bellandur tank. This is the load on to the tank.
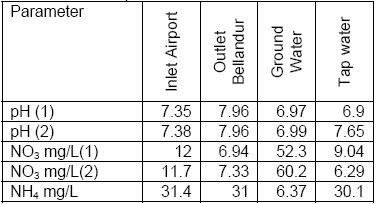
Table 2: Water composition of Bellandur lake 18 Nov 2006
It is estimated that between 384 (as per Lake Development Authority reports, 2006) and 500 million
litres per day (MLD) of sewage is received at the inlet of the lake. With a water spread area of 380
ha and an average depth of 2 m, this extent of sewage entering the lake provides a residence time
of 15.2 d [(380X10000X2)÷500000] at a high inflow of 500 MLD and 19.8 d at 384 MLD. As this
lake also receives a large quantity of storm water during rainy season, the residence time is
expected to be even lower than 7d. For an input of 109 t C and 14t N the expected BOD load is
between 218-280 mg/L and the N load is between 28-37 mg/L. The loading rate works out to be
14.34 and 1.84 g COD and N m-3d-1, respectively into the lake. While this is not a high loading rate
to a typical lagoon, it is important to note that the contents of the lake do not mix and could have
many high concentration pockets.
The water at the inlet and outlet of the tank (Table 2) and water at various points of the lake (Table
3) have been analysed for various chemical and biochemical parameters. The nitrate nitrogen
significantly reduces from the inlet to the outlet as well as at various points within the lake. The
rapid loss of nitrate may be ascribed both to denitrification as well as due to uptake. The fate of
urea-N and organic-N and their conversion to NH4 and NO3 (deamination, urease and nitrification
activities) brought about by various microorganisms has not been quantified adequately for
Bellandur lake. It is however clear that the high concentrations of ammonia-N remain unconverted
by nitrification to nitrate. The low dissolved oxygen concentrations suggest that it is not conducive
for efficient nitrification. While EC, chlorides, pH, temperature, DO and COD remain reasonably
similar at all locations within the lake (Table 3), there is appreciable variation in PO4 concentrations
around the lake and it needs further research to explain the same. Compared to the N content the
PO4 levels are low. The available data represent different time periods, yet the N:P ratio may be
considered low. This kind of high N and low P is conducive for unique ecological niches and
species domination, which is discussed later.
Table 3: Water composition of Bellandur lake 21-May-2005.
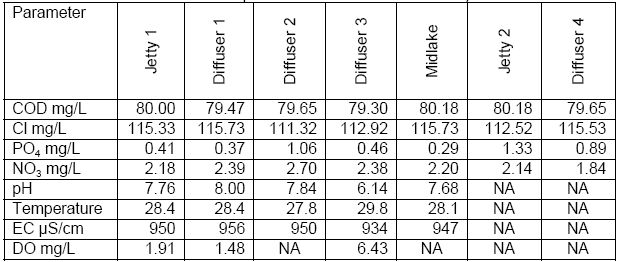
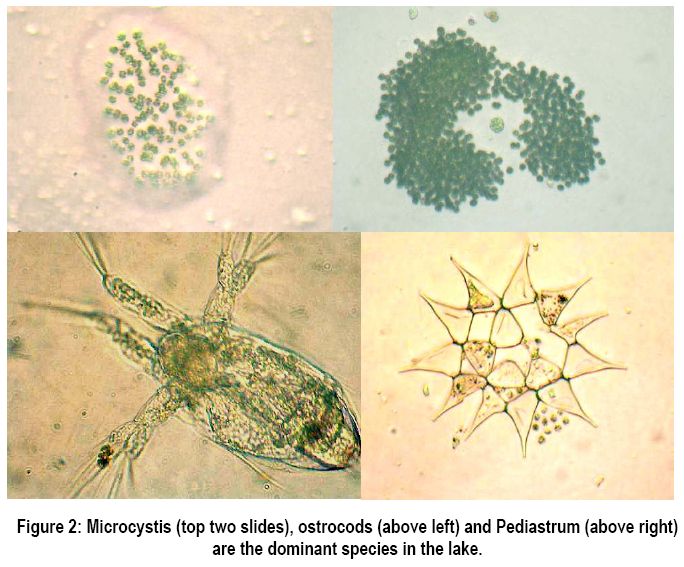
The high concentrations of N and low P are conducive for the proliferation of green algae and
macrophytes. The predominant alga was found to be Microcystis (Figure 2) followed by members
of Euglenophyceae. The algae consuming species were predominantly Ostrocods and Pediastrum
species. The presence of such high concentrations of N is usually conducive for growth and
proliferation of Microcystis that often comes up at the cost of diversity. It is also interesting to note
that even at the end of a 15.2 d HRT a significant proportion of the NO3 and NH4 is left unused in
the water and there are not adequate indices to understand the reason. It is found that in the
presence of such high numbers of Microcystis and Euglenophytes, it is not possible for other
species to compete. Such restriction on the biodiversity reduces the redundancy of the system to
very low levels and has a potential to go into total failure in case one of these species fail due to
other reasons. Therefore, a lot more research is required in this area such that the functioning of
the lake is made sustainable. There are also a significant number of macrophytes that have
colonised the lake and move freely in the blowing wind. It may be seen that from an estimated
COD in the range of 300 mg/L the COD was brought down to about 80 mg/L – approximately 70%
reduction. Further, if the COD estimate is corrected for microphytes it may be expected that COD
is quite low and there is an indication that the COD has been removed adequately by the lake.
Further estimates are needed to determine what are the types of COD that are left under-graded in
the discharge.
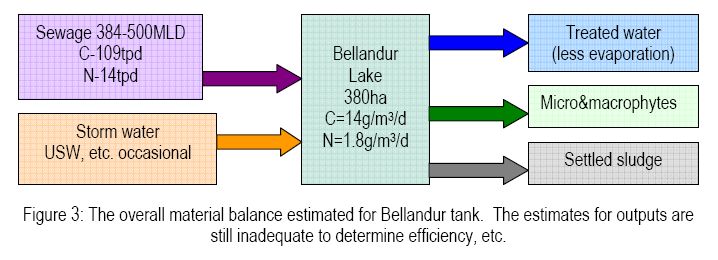
The overall balance determined for the lake is presented in Figure 3. It may be seen that there is
still inadequate estimate on the total discharge because evaporation and seepage losses have not
been estimated accurately. It is expected that there is very little seepage and groundwater
recharge from Bellandur tank. The groundwater level around the Bellandur tank is approximately
100-150m and the water quality is different in the groundwater (represented by nitrate above
permissible limits, Table 2). The COD is significantly reduced by about 75%. The EC levels are
high but not high enough for intermittent application on land. The nitrogen removal is poor and it is
suspected that in the absence of adequate P, growth of autotrophs – microphytes may be
restricted and attempts are required to enhance biodiversity and microphyte biomass. Further,
these microphytes are not harvestable and hence the N and P recovered as microphytes do not
represent economic products. Alternatives need to be found to provide economic viability to the
system. There is potential for a significant fraction of C to have formed sludge. This is expected to
gradually reduce the live storage of the tank and therefore its effectiveness as a C remover.
Mechanisms to frequently remove the sludge accumulated at the upstream end where most C is
removed is required to ensure sustainability of the system.
References:
- Bauera GA, Bazzaza FA, Minocha R, Long S, Magill A, Berntson GA. (2004). Effects of
chronic N additions on tissue chemistry, photosynthetic capacity, and carbon sequestration
potential of a red pine (Pinus resinosa Ait.) stand in the NE United States Forest Ecology
and Management 196:173–186
- Brye, KR, Norman, JM, Gower, ST, Bundy, LG. (2003). Methodological limitations and Nbudget
differences among a restored tall grass prairie and maize agroecosystems
Agriculture, Ecosystems and Environment 97:181–198
- Chanakya HN and Sharatchandra HC (2006). N-pool size, its reuse and sustainability
issues of a developing country city- Bangalore. Proc. Natl. Conf. Nitrogen in environment,
industry and agriculture. March 16-17, INSA, New Delhi (in print).
- Janzen HH (2004). Carbon cycling in earth systems—a soil science perspective (Review).
Agriculture, Ecosystems and Environment 104:399–417
- Lauver L and Baker LA (2000). Mass balance for wastewater nitrogen in the central
Arizona - Phoenix ecosystem. Wat. Res. 34(10): 2754—2760
- Muller F, Schrautzer J, Reiche E-W and Rinker A. (2005). Ecosystem based indicators in
retrogressive successions of an agricultural landscape Ecological Indicators (2005, in
print)
- Rodriguez L and Macias F (2005). Eutrophication trends in forest soils in Galicia (NW
Spain) caused by the atmospheric deposition of nitrogen compounds Chemosphere (2005,
in print)
|