5. MATERIALS AND METHODS
5. MATERIALS AND METHODS |
Out of the 81 existing lakes in Bangalore lakes (Lakshman Rau, 1986), 4 lakes were selected based on the current status and use values. The table 4 represents the lakes and their usage and present status.
Lakes |
Usage |
| 1. Sankey | Recreation, religious. |
| 2.Rachenahalli | Agricultural and washing of clothes. |
| 3. Ulsoor | Boat training to Madras Engineering Group (MEG). |
| 4. Tippagondanahalli | Drinking. |
SELECTION OF SAMPLING POINTS
The sampling points were selected so as the water samples represent the entire lake. The GPS location of all the sampling points was noted down. The maps of each lake were digitized using MAPINFO professional 6.0 to show the exact location of sampling points and other features. The parameters such as pH, Temperature (Water and Air), Electrical Conductivity, Total Dissolved Solids and Dissolved oxygen were analysed in the sampling spots. The water samples for both physico-chemical, phytoplankton and zooplankton analysis were collected simultaneously in all sampling points. The water for physico-chemical analysis was collected in 1-liter plastic cans.
The water quality analysis of the lakes gives the exact nature, cause and levels of the pollutants, if any. The physical parameters such as temperature and turbidity play an important role in lake productivity. The levels of chemical parameters including the pH, dissolved gases, dissolved minerals and nutrients decide the quality of lake water. The methods adopted for water quality analysis are listed in Table 5.
| PARAMETERS | METHOD USED | TOLERANCE LIMIT* |
|
Drinking |
Inland waters |
||
| Physical: | |||
| Turbidity, NTU | Turbidity tube method | 10 |
- |
| Water temperature, °C | Temperature sensitive probe | - |
40 |
| Air temperature, °C | Mercury thermometer | - |
- |
| EC, m S/cm | Electrometric method | - |
- |
| TDS, mg/L | Electrometric method | 500 |
200 |
| Chemical: | |||
| pH | Electrometric method | 6.5 to 8.5 |
5.5 to 9.0 |
| Free CO2 , mg/L | Titrimetric method | - |
- |
| DO, mg/L | Winkler's iodometric method | 6.0 |
3.0 |
| Chlorides, mg/L | Titrimetric method | 250 |
1000 |
| Total alkalinity, mg/L | Titrimetric method | 200 |
- |
| Total hardness, mg/L | Titrimetric method | 300 |
- |
| Calcium hardness, mg/L | Titrimetric method | 75 |
- |
| Magnesium hardness, mg/L | Titrimetric method | 30 |
- |
| Sulphates, mg/L | Spectrophotometric method | 150 |
1000 |
| Nitrates, mg/L | Spectrophotometric method | 45 |
100 |
| Phosphates, mg/L | Spectrophotometric method | - |
5 |
| Sodium, mg/L | Flame photometric method | - |
- |
| Potassium, mg/L | Flame photometric method | - |
- |
| Mercury, mg/L | Spectrophotometric method | 0.001 |
0.01 |
| Chromium, mg/L | Spectrophotometric method | 0.05 |
0.1 |
| Iron, mg/L | Spectrophotometric method | 0.3 |
- |
| Biological: | |||
| Coliforms | Hydrogen sulphide strip test | - |
- |
* - The tolerance limit is as prescribed by the Indian Standards Institution (IS 10500-1989). |
|||
The description of methods used for each physicochemical parameters and the significance of each parameter is discussed in the following section.
pH
pH is defined as the intensity of the acidic or basic character of a solution at a given temperature. pH is the negative logarithm of hydrogen ion concentration. pH = - log[H+]. pH values from 0 to 7 are diminishingly acidic, whereas values of 7 to 14 are increasingly alkaline. At 250C, pH 7.0 is neutral, where the activities of the hydrogen and hydroxyl ions are equal and it corresponds to 10-7 moles/L. The neutral point is temperature dependant and is pH 7.5 at 00C and pH 6.5 at 600C. The pH of natural water usually lies in the range of 4.4 to 8.5.
The basic principle of electrometric pH measurement is of the activity of hydrogen ions by potentiometric measurement using a standard hydrogen electrode and a reference electrode. Glass electrode is also used instead of hydrogen electrode. The electromotive force (emf) produced in the glass electrode system varies linearly with pH.
INSTRUMENT: Instrument for the measurement of pH, Temperature, Electrical conductivity and Total Dissolved Solids (Model: Combo) manufactured by Hanna Instruments (P) Ltd.
REAGENTS:
For the calibration of pH meter, buffer solutions were used.
• Potassium hydrogen phthalate buffer:
Dissolved 10.2 g of potassium hydrogen phthalate in water to prepare 1000ml of buffer. The pH of the buffer at 200C was 4.
• Phosphate buffer:
Dissolved 3.4 g of potassium dihydrogen phosphate and 4.45 g Na3HPO4.2H2O in water to prepare 1000ml of buffer. The pH of the buffer at 200C was 6.9.
• Borax buffer:
Dissolved 3.81 g of Na2B4O7.10H2O in water to prepare 1000ml of buffer. The pH value of the buffer at 200C was 9.22.
PROCEDURE: The pH meter was calibrated with buffer solutions and the instrument was immersed in a well-mixed sample and readings were noted down (Ramteke and Moghe, 1988).
TEMPERATUREMeasurement of temperature is an important parameter required to get an idea of self-purification of reservoirs and lakes. Water temperature plays an important role in aquatic ecosystem health. The temperature of drinking water has an influence on its taste.
Temperature is measured based on the rise in the mercury levels on a graduated scale. The electrometric method of temperature measurement is based on the temperature sensitive electrodes.
INSTRUMENT: Instrument for the measurement of pH, Temperature, Electrical conductivity and Total Dissolved Solids (Model: Combo) manufactured by Hanna Instruments (P) Ltd.
PROCEDURE: The instrument was immersed in a thoroughly shaken water sample and the readings (in 0C) were noted down (Ramteke and Moghe, 1988). Air temperature was obtained using Mercury thermometer.
CONDUCTIVITYConductivity is a numerical expression of the ability of an aqueous solution to carry electric current. This ability depends on the presence of ions, their total concentration, mobility, valence and relative concentrations and on the temperature of measurement. Conductivity measurements can be used to calculate total dissolved solids by multiplying conductivity (in µS/cm) by an empirical factor, which vary between 0.55 to 0.9, depending on the soluble components of the water and the temperature of measurement.
The instrument used for conductivity measurement consists of source for alternating current, a Wheatstone bridge, a null indicator and a conductivity cell. The conductivity cell measures the ratio of alternating current through the cell to the voltage across it.
INSTRUMENT: Instrument for the measurement of pH, Temperature, Electrical conductivity and Total Dissolved Solids (Model: Combo) manufactured by Hanna Instruments (P) Ltd.
PROCEDURE: The Electrical Conductivity (EC in µS/cm) of the water samples was obtained by immersing the electrodes in a well-mixed sample (Ramteke and Moghe, 1988).
TOTAL DISSOLVED SOLIDS
Total Dissolved Solids (TDS) are the infiltrable solids that remain as residue upon evaporation and subsequent drying at defined temperature. It gives the measure of ions dissolved in the water.
In the electrometric measurement of Total Dissolved Solids, the conductivity measurements are used to calculate Total Dissolved Solids by multiplying conductivity (µS/cm) by an empirical factor, which vary between 0.55 to 0.9, depending upon the soluble components and temperature of measurement.
INSTRUMENT: Instrument for the measurement of pH, Temperature, Electrical conductivity and Total Dissolved Solids (Model: Combo) manufactured by Hanna Instruments (P) Ltd.
PROCEDURE: The Total Dissolved Solids (in mg/L) of the water samples were obtained by immersing the electrodes in a well-mixed sample (Ramteke and Moghe, 1988).
TURBIDITYSuspension of particles in water interfering with the passage of light is called turbidity. Turbidity is caused by wide variety of suspended matter, which range in size from colloidal to coarse dispersion depending upon the degree of turbulence and also ranges from pure inorganic substances to those that are highly organic in nature. Turbid waters are undesirable from aesthetic point of view in drinking water supplies.
Turbidity measurement using turbidity tube method is based on the visual interpretation of the turbidity of water. The visual appearance of black cross mark at the bottom of the tube, through the open end is used for turbidity measurement.
INSTRUMENT: Turbidity tube - manufactured by Jal-Tara.
PROCEDURE: A well-mixed sample is poured into the cleaned turbidity tube that was placed above the white sheet placed on the floor. The open end of the tube was observed to visualize the black markings from the distance of 7 to 10cm. The level of water at which the black mark was seen was noted down.
DISSOLVED OXYGENDissolved oxygen (DO) in water affects the oxidation-reduction state of many of the chemical compounds such as nitrate and ammonia, sulphate and sulphite, and ferrous and ferric ions. It is extremely useful in self-purification of water bodies. The reduction in DO levels causes anaerobic condition in water and adversely affects the aquatic biota. Much of the DO in water comes from the atmosphere due to wind action. Algae and rooted aquatic plants also give out oxygen into water through photosynthesis. The oxygen content of natural water varies with temperature, salinity, turbulence, the photosynthetic activity of algae and higher plants and the atmospheric pressure. Variations in the amount of DO occur over a day. This is due to photosynthetic and respiratory processes of algae and higher plants.
When manganous sulphate is added to the sample containing alkaline potassium iodide, manganous hydroxide is formed, which is oxidized by the dissolved oxygen in the sample to basic manganic oxide. The basic manganic oxide liberates iodine equivalent to that of dissolved oxygen originally present in the sample. The liberated iodine is titrated with standard solution of sodium thiosulphate using starch as the indicator.
MnSO4+ 2 KOH |
2Mn (OH)2+ O2(Dissolved oxygen) |
[Basic manganic oxide] |
[Brown colour precipitate] |
MnO (OH)2 + 2H2SO4 |
[manganic sulphate] |
| Mn (SO4)2 +2KI |
| 2Na2S2O3+ I2 |
REAGENTS:
• Manganous sulphate solution:
Dissolved 100 g of manganous sulphate in 200ml of distilled water and heated to dissolve salt and filtered after cooling.
• Alkaline potassium iodide solution:
Dissolved 100 g of KOH and 50 g of KI in 200ml of preboiled distilled water.
• Sodium thiosulphate 0.025 N:
Dissolved 24.82 g of sodium thiosulphate in a preboiled distilled water and made up to the volume of 1 liter. Added a pellet of sodium hydroxide as a stabilizer. The concentration of the solution was 0.1 N. Diluted to 4 times to prepare 0.025 N standard solution.
• Starch indicator solution:
Dissolved 1 g of starch in 100ml of distilled water and warmed for complete dissolution.
• Potassium dichromate, 0.1 N:
Dissolved 1.2257 g potassium dichromate in distilled and made upto 250ml in a volumetric flask. The concentration of the solution was 0.1 N.
• Concentrated sulphuric acid.
PROCEDURE:
Standardization of sodium thiosulphate: About 100ml of boiled, cooled distilled water was taken in 500ml standard flask. Added 3 g of potassium iodide and 2 g of sodium bicarbonate and mixed well. Added 6ml of concentrated hydrochloric acid and pipetted out 25ml of 0.1 potassium dichromate solution. Covered the flask with a watch glass and kept in the dark for 5 minutes. Made up the volume to 250ml with boiled, cooled distilled water. Titrated against sodium thiosulphate until the solution changed yellowish green in colour. 1ml of starch was added. The titration was continued until the colour changes from blue to light green.
Determination of Dissolved Oxygen: The sample was collected in 125ml BOD bottle carefully without allowing air bubbles. Added 1ml of manganous sulphate and 1ml of alkali iodide azide reagent. A brown precipitate of basic manganic oxide formed was allowed to settle. Added 1ml of concentrated sulphuric acid and mixed well until the precipitate dissolved. About 25ml of the solution was taken and titrated against sodium thiosulphate until a straw yellow colour appeared. Few drops of starch indicator was added and titrated again until the blue colour disappeared (Manivasakam, 1997).
CALCULATION:

Where,
V1 = Volume of sample bottle
V2 = Volume of contents titrated
V = Volume of MnSO4 and KI added (2ml)
Free carbondioxide in the waters accumulates due to microbial activity and respiration of organisms. This imparts the acidity to the waters because of the formation of carbonic acid.
Free carbondioxide reacts with sodium carbonate or sodium hydroxide to form sodium bicarbonate. Completion of the reaction is indicated titrimetrically by the development of pink colour with phenolphthalein as the indicator.
REAGENTS:
• Sodium hydroxide, 0.05N:
Dissolved 40 g of sodium hydroxide in boiled CO2 free distilled water and made up the volume to 1 liter. The solution was filtered to remove Na2CO3 . This gave 0.1 N NaOH solution. Diluted the solution 20 times to prepare 0.05 N solution.
• Phenolphthalein indicator solution:
Dissolved 0.5 g of phenolphthalein in 50ml of distilled water. 0.05 N Sodium hydroxide solution was added dropwise until the solution just turned pink.
PROCEDURE: About 100ml of the sample was taken in a conical flask and added a few drops of phenolphthalein indicator. The solution was titrated against 0.05 N sodium hydroxide. The endpoint is the appearance of pink colour.
NOTE: The colour change to pink after the addition of phenolphthalein to the sample, but before titration indicates the absence of free carbondioxide (Trivedy and Goel, 1987).
CALCULATION:
![]()
Chloride anion is generally present in natural waters. The presence of chloride in natural waters can be attributed to the dissolution of salt deposits, irrigation drainage and sewage discharges. Human excreta, particularly urine also contributes to high amount of chlorides. A high chloride content also has a damaging effect on agricultural crops.
In a neutral or slightly alkaline solution, potassium chromate indicates the endpoint of silver nitrate titration of chloride. Silver chloride is precipitated quantitatively before sufficient quantity of silver chromate is formed.
Ag+ + Cl- ![]() AgCl (White precipitate)
AgCl (White precipitate)
Ag+ + CrO4- ![]() AgCrO4 (Brick red precipitate)
AgCrO4 (Brick red precipitate)
REAGENTS:
• Potassium chromate indicator:
About 5 g potassium chromate is dissolved in 100ml of distilled water.
• Silver nitrate 0.0141 N:
Dissolved 2.395 g silver chromate and diluted to 1000ml.
• Sodium chloride 0.0141 N:
Dissolved 824.1mg of predried sodium chloride and diluted to 1000ml.
1ml = 0.5mg of Cl-
PROCEDURE:
Standardization of silver nitrate: About 25ml of 0.0141 N sodium chloride was taken in a conical flask and 2ml of potassium chromate indicator was added. The solution was titrated against silver nitrate until a brick red precipitate of silver chromate appeared. The volume of silver nitrate consumed was noted down (Ramteke and Moghe, 1988).
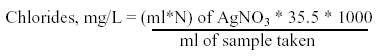
Determination of chlorides in the sample: About 25ml of water sample was taken in a conical flask and 2ml of potassium chromate indicator was added. The solution was titrated against standardized silver nitrate until a brick red colour precipitate of silver chromate started precipitating. The volume of silver nitrate consumed was noted down.
CALCULATION
: 
ALKALINITY
Alkalinity of water is its acid neutralizing capacity. Alkalinity of surface water is primarily a function of carbonate and hydroxide content and also includes the contributions from borates, phosphates, silicates and other bases.
Alkalinity is a measure of amount of strong acid needed to lower the pH of a sample to 8.3, which gives free alkalinity (phenolphthalein alkalinity) and to a pH 4.5 gives total alkalinity. Total alkalinity is the sum of hydroxides, carbonates and bicarbonates.
REAGENTS:
• 0.1 N sulphuric acid:
Diluted 2.8ml of concentrated sulphuric acid to 1L using distilled water to get 0.1 N sulphuric acid.
• 1 N sodium carbonate solution:
Weighed accurately 13.25 g of anhydrous sodium carbonate and dissolved in distilled water and made upto 250ml volumetric flask.
• Phenolphthalein indicator:
Dissolved 0.5 g of phenolphthalein in 50ml of 95% ethyl alcohol. Added 50ml of distilled water and 0.02 N sodium hydroxide dropwise till a faint pink colour appeared.
PROCEDURE:
Standardization of sulphuric acid: About 50ml of 1 N sodium carbonate solution was taken in a conical flask and added few drops of methyl orange. Titrated against 0.1 N sulphuric acid until the colour changed from yellow to orange.
Phenolphthalein Alkalinity: About 25ml of water samples was taken in a conical flask. Added 3-4 drops of phenolphthalein indicator. The solution remained colourless and hence indicated the absence of phenolphthalein alkalinity.
Total Alkalinity: Added 3-4 drops of methyl orange to the same sample. The solution turned yellow which was titrated against 0.02 N sulphuric acid until the colour changed to orange. The volume of sulphuric acid consumed was noted down (Sunil kumar and Shailaja, 1998).
CALCULATION:
![]()
HARDNESS
The hardness of water is the measure of the capacity of the water to react with soap. Calcium and magnesium are the principal cations that impart hardness. The total harness of water therefore reflects the sum total of alkaline metal cations present in it. Hardness caused by bicarbonates and carbonates of calcium and magnesium cations is called temporary hardness. Sulphates and chlorides of calcium and magnesium cause permanent hardness. Natural hardness of water depends upon the geological nature of the catchment area. Hardness plays an important role in the distribution of the aquatic biota and many species are identified as indicators for hard and soft waters. The degree of hardness of drinking water has been classified in terms of equivalent CaCO3 concentration as follows:
Soft 0 to 60 mg/L
Medium 60 to 120 mg/L
Hard 120 to 180 mg/L
Very hard more than 180 mg/L
In an alkaline condition, EDTA reacts with Ca and Mg to form a soluble chelated complex. Ca and Mg ions develop wine red colour with Eriochrome Black T. When EDTA is added as a titrant, Ca and Mg divalent ions gets complexed resulting in a sharp change from wine red to blue which indicates end point of the titration. At higher pH, about 12.0, Mg2+ ions precipitate and only Ca2+ ions remain in the solution. At this pH, murexide indicator forms a pink colour with Ca2+ . When EDTA is added Ca2+ gets complexed resulting in the change from pink to purple, which indicates end point of the reaction.
Metal + Indicator ![]() Metal Indicator (complex)
Metal Indicator (complex)
Metal Indicator + EDTA ![]() Metal EDTA + Indicator
Metal EDTA + Indicator
REAGENTS:
• Buffer solution:
Dissolved 16.9 g ammonium chloride in 143ml of ammonia solution. Added 1.25 g of magnesium salt of EDTA to obtain a sharp colour change of indicator and diluted to 250ml.
• Inhibitor solution:
Dissolved 4.5 g hydroxylamine hydrochloride in 100ml of 95% ethyl alcohol or isopropyl alcohol.
• Eriochrome Black T:
Mixed 0.5 g of the dye with 100 g sodium chloride to prepare a ground dry powder.
• Murexide indicator:
Prepared a ground mixture of 200mg of murexide with 0.2 g ammonium purpurate and 40 g potassium sulphate.
PROCEDURE:
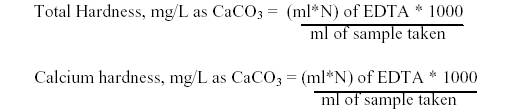
Total Hardness: To 25ml of the well-mixed sample taken in a conical flask, 2ml of buffer solution and 1ml of Sodium hydroxide was added. A pinch of eriochrome black T was added and titrated immediately against 0.01 M EDTA till the wine red colour changes to blue.
Calcium Hardness: To 25ml of the well-mixed sample taken in a conical flask, 1ml of sodium hydroxide was added to raise the pH to 12.0 and titrated immediately with EDTA till the pink colour changes to purple. The volume of EDTA consumed for total hardness and calcium hardness were noted down (Ramteke and Moghe, 1988).
CALCULATION
: 
SULPHATES
Sulphate ions usually occur in natural waters. They contribute to the permanent hardness. Sources of sulphates are mainly sulphate rocks such as gypsum (calcium sulphate) and sulphur minerals such as pyrites and also due to air and water pollution. Sulphates contribute to the total solids content and in a reduced and anaerobic condition produce hydrogen sulphide, which gives a rotten egg odour to the water.
Sulphate ions are precipitated as barium sulphate in acidic medium with barium chloride. The absorption of light by this precipitated suspension is measured spectrophotometrically at 420nm.
Ba2++ SO42- ![]() BaSO4(white precipitate)
BaSO4(white precipitate)
INSTRUMENT: Spectrophotometer PRIM Light and Advanced 70C10382 with LCD display manufactured by Secomam, France.
REAGENTS:
• Conditioning reagent:
Mixed 50ml of glycerol with a solution containing 30ml concentrated hydrochloric acid, 300ml distilled water, 100ml 95% ethyl alcohol and 75 g sodium chloride.
• Standard sulphate solution:
Dissolve 147.9 mg anhydrous sodium sulphate and diluted to 1000ml.
1ml = 100 mg SO4
• Barium chloride crystals.
PROCEDURE: About 100ml of the sample was taken in a beaker and 5ml of conditioning reagent along with a spatula of barium chloride crystals were added and mixed well in a magnetic stirrer for one minute. Spectrophotometer was calibrated with sulphate standard solution and blank prior to the estimation of sample. The sample concentration was noted down (Trivedy and Goel, 1987).
NITRATES
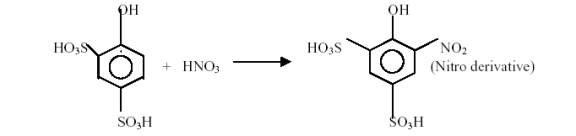
Nitrate is the most highly oxidized form of nitrogen compounds commonly present in natural waters, because it is a product of aerobic decomposition of organic nitrogenous matter. Significant sources of nitrates are fertilizers, decayed vegetable and animal matter, domestic and industrial effluents and atmospheric washouts. Unpolluted natural water contain usually only minute amount of nitrate. Excessive concentration in drinking water is considered hazardous for infants because their intestinal tract nitrates are reduced to nitrites, which may cause Methaemoglobinaemia or blue baby syndrome. Nitrate is also an essential nutrient for algal growth and hence when present in high concentration along with phosphates causes eutrophication.
Nitrate reacts with phenol disulphonic acid to produce a nitro derivative, which in alkaline condition develops yellow colour due to rearrangement of structure. The intensity of colour produced is directly proportional to the concentration of nitrates and measured spectrophotometrically at 410nm.
INSTRUMENT: Spectrophotometer PRIM Light and Advanced 70C10382 with LCD display manufactured by Secomam, France.
REAGENTS:
• Phenol disulphonic acid:
Dissolved 25 g of white pure phenol in 150ml of concentrated sulphuric acid and 85ml of concentrated sulphuric acid was added. The solution was heated for 2 hours in a steam bath and kept in a dark bottle.
• Standard Nitrate solution:
Dissolved 0.722 g of anhydrous potassium nitrate in 1 liter of distilled water. The solution, which had the concentration of 100 mg N/L, was diluted 100 times to prepare a solution of 1 mg N/L.
• Liquid ammonia, 30%
PROCEDURE: About 50ml of standard, samples and blank (distilled water) were taken in separate crucibles and heated to dryness and cooled. The residue was dissolved in 2ml phenol disulphonic acid and the contents were diluted to 50ml in a nessler's tube. Added 6ml of liquid ammonia to develop a yellow colour and mixed the solution thoroughly. The colour developed was read at 410nm spectrophotometrically. The concentration of nitrate was noted down (Trivedy and Goel, 1987).
INORGANIC PHOSPHATES
Phosphorus is a nutrient for plant growth and a fundamental element in the metabolic reaction of plants and animals. It controls algal growth and primary productivity. In most natural waters, phosphorus ranges from 0.005 to 0.020 mg/L. Algae require only small amounts of phosphorus. Excess amounts of phosphorus can cause eutrophication leading to excessive algal growth called algal blooms.
In acidic condition, orthophosphate reacts with ammonium molybdate to form molybdophosphoric acid. It is further reduced to molybdenum blue by adding reducing agent such as stannous chloride. The intensity of the blue coloured complex is measured spectrophotometrically at 690nm.
PO42-+ 12 (NH4)2 MoO4 + 24H+ ![]() (NH4)3 PO4.12MoO3 + 21 NH4+ + 12H2O
(NH4)3 PO4.12MoO3 + 21 NH4+ + 12H2O
(NH4)3 PO4.12MoO3+ Sn2+ ![]() (Molybdenum blue) + Sn4+
(Molybdenum blue) + Sn4+
INSTRUMENT: Spectrophotometer PRIM Light and Advanced 70C10382 with LCD display manufactured by Secomam, France.
REAGENTS:
• Standard phosphate solution:
Dissolved 439 mg of potassium dihydrogen phosphate in distilled water and made up the volume to 1000ml. This stock solution was diluted 100 times to obtain standard phosphate solution of 1 mg/L.
• Ammonium molybdate solution:
Dissolved 25 g of ammonium molybdate in 175ml of distilled water. Added 280 ml of concentrated sulphuric acid to 400ml distilled water and cooled. Both the solutions were mixed and made up to 1000ml.
• Stannous chloride:
Dissolved 2.5 g of stannous chloride in 100ml of glycerol by heating in a water bath.
PROCEDURE: About 50ml of samples, standard and blank (distilled water) were taken in a Nessler's tube. Added 2ml of ammonium molybdate solution and 5 drops of stannous chloride reagent. The tubes were mixed thoroughly and the intensity of blue colour obtained is proportional to the amount of phosphates and read spectrophotometrically at 690nm. The concentration of phosphates was noted down (APHA, 1985).
SODIUM AND POTASSIUM
Sodium is present in number of minerals, the major one being rock salt (sodium chloride). In surface water the sodium concentration may be less than 1 mg/L or exceed 300 mg/L depending upon the geographical area. Although sodium salts are usually non-toxic, excess intake of sodium chloride causes vomiting. The water containing high sodium content is not suitable for agriculture, as it tends to deteriorate the soil quality. The concentration of potassium is usually lower in natural waters than sodium. The chemical properties of both sodium and potassium are similar as both are alkali group metals.
The estimation of sodium and potassium is based on the emission spectroscopy, which deals with the excitation of electrons from ground state to higher energy state and coming back to its original state with release of energy in the form of light. In the flame photometer, the atomizer under controlled conditions sucks in the sample. The radiation from the flame enters a dispersing device in order to isolate the desired region of the spectrum. The intensity of isolated radiation can be measured by a phototube. After calibration of the photometer with solution of known composition and concentration, it is correlated with intensity of a given spectral line of the unknown with the amount of an element present that emits the particular radiation.
INSTRUMENT: Systronics Flame Photometer 128 with a compressor and a gas supply.
REAGENTS:
• Stock Sodium solution:
Dissolved 0.25 g of predried sodium chloride in 1000ml of distilled water.
1ml = 0.1 mg Sodium
• Working sodium solution:
A series of standards of concentration 10, 20, 40, and 60 mg/L of sodium were prepared by pipetting 5, 10, 20, 30ml of stock and diluted to 50ml with distilled water.
• Stock potassium solution:
Dissolved 0.1907 g predried potassium chloride in 1 liter of distilled water.
1ml = 0.1 mg K
• Working potassium solution:
A series of standards of concentration 10, 20, 40, and 60 mg/L of potassium were prepared by pipetting 5, 10, 20, 30ml of stock and diluted to 50ml with distilled water.
PROCEDURE: The compressor was switched on and the pressure of air was adjusted to 0.45 kg/cm 2 . The gas supply was switched on to maintain the air-gas mixture to get a blue flame. The blue flame was adjusted into cone shaped and aspirated with distilled water. The sodium and potassium standards were mixed in equal proportion. The instrument was calibrated by curve-fit method by aspirating with series of standards of known concentration. The samples were then introduced and the readings were noted. The gas supply was put off followed by the air supply (Ramteke and Moghe, 1988).
CALCULATION:
Sodium, mg/L = Observed values * Calibration factor
Potassium, mg/L = Observed values * Calibration factor
MERCURY
The major source of mercury in the environment is the natural degassing of the earth's crust. It can exist in the environment as the metal, as monovalent and divalent salts and as organo-mercurides, the most important of which is methyl mercury. Methyl mercury may be produced from organic mercury by microorganisms found in aquatic sediments. Inorganic mercury compounds are readily accumulated in the kidney. The major effects of mercury poisoning take the form of neurological and renal disturbances, which are primarily associated with organic and inorganic mercury compounds. The greater toxicity of methyl mercury compared to inorganic mercury is due to its lipid solubility, which permits it to cross biological membranes more easily than inorganic mercury, especially in brain, spinal cord and peripheral nerves and across placenta.
Mercury forms a chelated complex with EDTA, which on the addition of rhodamine 6G forms a pink coloured solution. The intensity of the colour is directly proportional to the concentration of mercury and is read spectrophotometrically at 565 nm.
INSTRUMENT: Spectrophotometer PRIM Light and Advanced 70C10382 with LCD display manufactured by Secomam, France.
REAGENTS:
• Buffered potassium iodide solution:
About 5 g of potassium iodide and 5 g of potassium hydrogen phthalate were dissolved in 250ml of distilled water. To that added few crystals of sodium thiosulphate.
• Rhodamine 6G solution:
In 250ml of distilled water 25mg of rhodamine 6G crystals was added and mixed well.
• EDTA solution (0.05 M):
About 4.15 g of EDTA was dissolved in 250ml of distilled water.
• Gelatin 1%:
About 1 g of gelatin powder was dissolved in 100 ml of distilled water.
• Stock mercury solution:
Dissolved 1.35 g of mercuric chloride in about 700 ml of water and added 1.5 ml of concentrated nitric acid and made up to 1000ml.
1ml = 1000 m g Hg
• Mercury standard:
About 1.25ml of the stock diluted was diluted to 250ml in a volumetric flask. This gave 5 mg/L solution.
PROCEDURE: In clean nessler's tubes 2.5ml of sample, standard and blank were added. To that 2.5ml of EDTA solution, 2.5ml OF potassium iodide buffer and 0.5ml of rhodamine 6G and 1ml of gelatin solution were added. Then it was made upto 25ml with distilled water. After thorough mixing the intensity of the colour was read at 565 nm spectrophotometrically and the concentrations were noted down.
CHROMIUM
Most rocks and soils contain small amounts of chromium. The commonest one is chromite in which the metal exist in trivalent form. Hexavalent chromium also exists naturally but infrequently. Because of the low solubility of chromium, the levels found in water are usually low. The valency of the chemical form in natural waters is influenced by the acidity of water. Chromium is absorbed through both the gastrointestinal and respiratory tracts. Trivalent form is an essential form of the element in human beings. Hexavalent chromium is toxic. It is distributed in human tissues in variable, low concentration. The largest concentrations of chromium in man are in skin, muscle and fat. High concentration of Hexavalent chromium causes digestive tract cancer and increased risk of lung cancer in man. Hexavalent chromium salts are used in metal pickling, and plating operations, anodizing aluminium, in the leather industry as a tanning agent, in the manufacturing of paints, dyes, explosives, ceramics and paper (Sawyer et al ., 2003).
Diphenylcarbazide reacts with chromium to form a dark pink coloured complex, which is read spectrophotometrically at 540 nm.
INSTRUMENT: Spectrophotometer PRIM Light and Advanced 70C10382 with LCD display manufactured by Secomam, France.
REAGENTS:
• 1M Sulphuric acid:
About 1.38ml of concentrated sulphuric acid was mixed with 250ml of distilled water.
• 0.5 % diphenylcarbazide:
About 250 mg of diphenylcarbazide was dissolved in 100ml of acetone.
• Stock chromium solution:
Dissolved 2.828 g potassium dichromate in water and diluted to 1000ml.
1ml = 1000 m g Cr
• Chromium standard:
From the stock solution, 1.25ml was taken and made up to 250ml in a volumetric flask. This gave 5 mg/L solution.
PROCEDURE: In clean nessler's tubes 2.5ml of sample, standard and blank (distilled water) were added. To that 1.5ml sulphuric acid and 0.5ml of diphenylcarbazide were added and made upto 25ml with distilled water. The mixture was mixed thoroughly and kept for 5 minutes. After 5 minutes, the pink colour developed was read spectrophotometrically at 540 nm and concentrations were noted down.
IRON (as ferric)
Iron is the fourth most abundant element in the earth's crust. In water it occurs mainly in the divalent and bivalent state (ferrous and ferric). Iron in the surface water is generally present in the form of ferric state. Iron is an essential element in human nutrition. It is contained in a number of biologically significant proteins, but ingestion in large quantities results in haemochromatosis where in tissue damage results from Iron accumulation (Sawyer et al ., 2003).
The ferric iron reacts with sodium salicylate to form an amethyst colour which on the addition of ammonium acetate turns into yellow colour and when 1:1 acetic acid is added again turns into amethyst colour.
INSTRUMENT: Spectrophotometer PRIM Light and Advanced 70C10382 with LCD display manufactured by Secomam, France.
REAGENTS:
• Stock Iron solution:
Added 20ml of concentrated sulphuric acid to 50ml of water and dissolved 7.02 g of ferrous ammonium sulphate. Added 0.1 N potassium permanganate dropwise until a faint pink colour persisted. Diluted to 1000ml with water and mixed.
• Standard solution:
About 1.25ml of the stock diluted was diluted to 250ml in a volumetric flask. This gave 5 mg/L solution.
• 3% Ammonium acetate:
About 3 g of ammonium acetate was dissolved in 100ml of distilled water.
• 10% sodium salicylate:
About 10 g sodium salicylate was dissolved in 100ml of distilled water.
• 1:1 Acetic acid:
Equal volumes of acetic acid and distilled water were mixed to obtain 1:1 solution of acetic acid.
PROCEDURE: To the Iron sample, 0.25 ml of 10 % sodium salicylate, 2.5ml of 3% ammonium acetate and 2.5ml of 1:1 acetic acid were added. The solution was made upto 25ml. The amethyst colour developed was read spectrophotometrically at 530 nm and the concentrations were noted down.
Water is a major source for the transmission of diseases. Polluted waters contain vast amounts of organic matter that serve as the excellent nutritional source for the growth and multiplication of microorganisms. The intestinal contaminants of fecal origin are of major concern in polluted waters. These pathogens are responsible for intestinal infections such as bacillary dysentery, typhoid fever and paratyphoid fever. Since Escherichia coli is always present in the human intestine, the bacterium is used as an indicator of fecal pollution. The entire consortium of microorganisms present in the colon of Human and other mammals are termed as Coliforms.
Coliforms produce hydrogen Sulphide gas by the reduction of organic sulphur present in the amino acid cysteine, which is the component of peptone in the medium. This amino acid in the presence of cysteine desulphurase loses the sulfur atom and is then reduced by the addition of hydrogen from water to form hydrogen sulphide. The hydrogen sulphide evolved reacts with ferrous ion of ferrous ammonium sulphate in the medium to form a black precipitate, which indicates positive test (Cappuccino and Sherman, 1999).
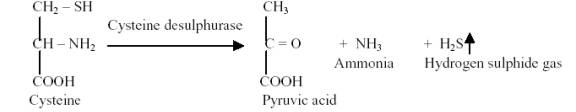
H2S + Fe++ ![]() FeS (Black precipitate)
FeS (Black precipitate)
REAGENTS:
• SIM medium:
Peptone 30.0 g
Beef extract 3.0 g
Ferrous Ammonium Sulphate 0.2 g
Sodium thiosulphate 0.025 g
Distilled water 1000 ml
pH 7.3
• Paper strips tipped in the medium.
PROCEDURE: The Coliforms bottles containing the tissue paper strips dipped with the SIM media were taken. About 20ml of the water samples were filled in the bottles. The bottles were incubated at 370C for 18 hours and the contaminated water samples turned black within 24 hours due to the production of H2S .
Phytoplankton collection: Water was collected from the surface with minimal disturbance and filtered in a No. 25 bolting silk cloth net of mesh size 63 m m and 30 cm diameter. The final volume of the filtered sample was 125ml. The sample was transferred to another 125ml plastic bottle and labeled mentioning the time, date and place of sampling.
Preservation: The samples collected in 125ml plastic bottles were preserved by adding 5ml of 4% formalin.
Concentration: The preserved samples were kept for 24 hours undisturbed to allow the sedimentation of plankton suspended in the water. After 24 hours, the supernatant was discarded carefully without disturbing the sediments and the final volume of concentrated sample was 50ml.
Qualitative and quantitative analysis of phytoplankton: The qualitative and quantitative analysis of phytoplankton was done by Lackey's drop method. In Lackey's drop method, the coverslip was placed over a drop of water in the slide and whole of the coverslip was examined by parallel overlapping strips to count all the organisms in the drop. About 20 strips were examined in each drop. Number of subsamples to be taken was dependent on the examining 2 to 3 successive subsamples without any addition of unencountered species when compared to the already examined subsamples in the same sample (APHA, 1985).
The species belonging to each group were noted down and number of individuals in each species was counted. The number of organisms was expressed in Total organisms per liter using the formula,
CALCULATION:
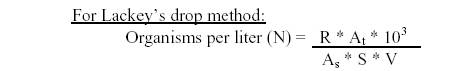
Where R = Number of organisms counted per subsample
At = Area of coverslip, mm2
As = Area of one strip, mm2
S = Number of strips counted, and
V = Volume of sample under the coverslip, ml
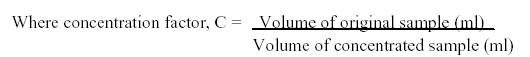
Therefore, Total organisms per liter = N * 1/C
Standardization of filtering volume: The volume of water to be filtered for zooplankton analysis was standardized by repeated trials at a particular spot in S ankey tank and filtering different volumes of water through the plankton net i.e., 25L, 50L, 75L, 100L, 125L and 150L. The experiment was carried out twice in order to determine the precision of the results.
Zooplankton collection: Water was collected from the surface with minimal disturbance and filtered in a No. 25 bolting silk cloth net of mesh size 63 µm and 30 cm diameter. The final volume of the filtered sample was 125ml, which was transferred to another 125ml plastic bottle and labeled mentioning the time, date and place of sampling.
Preservation: The samples collected in 125ml plastic bottles were preserved by adding 2ml of 4% formalin.
Concentration: The preserved samples were kept for 24 hours undisturbed to allow the sedimentation of plankton suspended in the water. After 24 hours, the supernatant was discarded carefully without disturbing the sediments and the final volume of concentrated sample was 50ml.
Qualitative and quantitative analysis of zooplankton: The qualitative and quantitative analysis of zooplankton was done by using Sedgwick-Rafter cell (for standardization) and by Lackey's drop method. Six strips were counted in Sedgwick-Rafter cell with dimensions of 50mm * 20mm * 1mm. In Lackey's drop method, the coverslip was placed over a drop of water in the slide and whole of the coverslip was examined by parallel overlapping strips to count all the organisms in the drop. About 20 strips were examined in each drop. Number of subsamples to be taken was dependent on the examining 2 to 3 successive subsamples without any addition of unencountered species when compared to the already examined subsamples in the same sample. The zooplankton were identified upto a taxonomic precision of species level in Rotifera, genus level in both Cladocera and Copepoda using self made keys given in Appendix 2 and standard identification keys (Murugan et al., 1998; Altaff, 2003; Edmondson, 1959; Battish, 1992; Dhanapathi, 2000).
The species belonging to each group were noted down and number of individuals in each species was counted. The number of organisms was expressed in Total organisms per liter using the formula,
CALCULATION:
For Sedgwick Rafter cell:
![]()
Where R = number of organisms counted per subsample
L = length of each strip, mm
D = depth of a strip, mm
W = width of a strip, mm
S = number of strips counted.
Therefore, Total organisms per liter = N * 1/C
For Lackey's drop method:
![]()
Where R = Number of organisms counted per subsample
A t = Area of coverslip, mm2
A s = Area of one strip, mm2
S = Number of strips counted, and
V = Volume of sample under the coverslip, ml
Therefore, Total organisms per liter = N * 1/C