 Formula
2 (presented below) involves the summation of truncated irregular cones
delineated by the contour lines on the map. Max. depth represents the maximum estimated depth of the lake and A
represents the surface area of the lake.
Formula
2 (presented below) involves the summation of truncated irregular cones
delineated by the contour lines on the map. Max. depth represents the maximum estimated depth of the lake and A
represents the surface area of the lake.
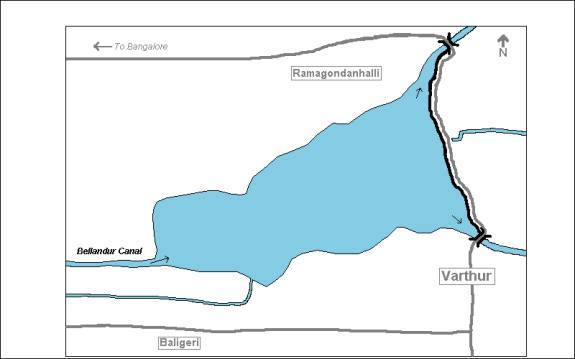
A 1:50,000
scale map of Varthur Lake published by the Survey of India (SI) in 1980
was scanned, georeferenced, and digitised using MapInfo Professional 5.0. The
digitised shoreline of the lake was then overlapped with a
geometrically-restored LISS II satellite image of the lake from 1998 using
Idrisi 32 software (Eastman, J. Ronald. 1999). From the image, it is seen that the
general shape and surface area of the lake is virtually the same in 1998 as it
was between 1971 and 1974, when the SI map was completed. The SI map was
used as a reasonable approximation of the current shoreline of the lake for the
remainder of the study under the assumption that the outline of the lake has not
changed significantly since 1998.
The depth of the lake
was measured at randomly distributed points around the lake. The location of
these points was recorded using a handheld GPS (Geographic Positioning System).
The depth of the lake was sampled on two occasions, November, 2001, and
February, 2002, corresponding to the post-monsoon and dry seasons, respectively.
The position of the GPS points taken in the field were rectified to fit the map
of the lake by comparing the GPS coordinates for two landmarks (the bridge over
the northeast outlet and the main irrigation canal) to previously established
coordinates published by the Survey of India, 1980.
The November depth
samples were measured with a weighted line and measuring tape. A total of 31
sample points were recorded using this method. February samples were taken from
a coracle boat using a graduated aluminum pole with a flat disc attached to the
bottom. A total of 46 sample points were recorded with this method. The data
collected during the February sampling is presented in Appendix A.
The depth data collected in
February were converted into data points on the georeferenced map of Varthur
Lake using MapInfo Professional 5.0 software. The initial bathymetric map was
hand contoured using a 0.25 meter contour interval. The shoreline contour was
truncated at the spillovers that transect the two primary outlets. All lines
were drawn using the polyline tool incorporated in the software.
Estimations of the February
volume of Varthur Lake were made using two methods, (A and B), based on the data
used in the calculations. Method A was a simple manual calculation based on
surface area slices at the .25 meter intervals used on the initial digitized
map. Method B was a more accurate computer-assisted analysis that used a grid
file of the lake extrapolated from the original data points and the contour map.
This method subjected data from the contour map to two separate volume computations labeled formulas 1 and 2, respectively (Mutreja, K. N. 1986). The maximum depth of the lake is represented by the 2.0 m contour. Table 2.1 summarizes the application of formula 1. This procedure involved finding the volume of each layer between the contours (Vol. 1) and subtracting the volume of each layer that is lost due to the slope of the bottom of the lake (Vol. 2). Vol. 2 assumes a slope factor of 0.5.
|
|
|
|
Vol. 1 (m3) |
Vol. 2 (m3) |
|
|
|
Cont. ID |
Area (m2) |
Depth (m3) |
(Depth of prev. cont.-Depth of cont.)*Area of cont. |
(Area of cont.-Area of prev. cont.)*0.5 |
Vol. 1-Vol. 2 |
Comment |
|
1 |
11,680 |
2.00 |
0 |
0 |
0 |
Vol. interval assumes 2 m contour represents max.
depth |
|
2 |
166,900 |
1.75 |
41,725 |
19,403 |
22,323 |
normal interval slope calculation |
|
3 |
382,200 |
1.50 |
95,550 |
26,913 |
68,638 |
normal interval slope calculation |
|
4 |
644,100 |
1.25 |
161,025 |
32,738 |
128,288 |
normal interval slope calculation |
|
5 |
862,000 |
1.00 |
215,500 |
27,238 |
188,263 |
normal interval slope calculation |
|
6 |
1,025,000 |
0.75 |
256,250 |
20,375 |
235,875 |
normal interval slope calculation |
|
7 |
1,134,000 |
0.50 |
283,500 |
13,625 |
269,875 |
normal interval slope calculation |
|
8 |
1,253,000 |
0.25 |
313,250 |
14,875 |
298,375 |
normal interval slope calculation |
|
9 |
1,478,000 |
0.00 |
369,500 |
28,125 |
341,375 |
normal interval slope calculation |
|
|
|
total: |
1,736,300 |
183,290 |
1,553,010 |
est. total volume of lake is 1,540,589 m3 |
Formula
2 (presented below) involves the summation of truncated irregular cones
delineated by the contour lines on the map. Max. depth represents the maximum estimated depth of the lake and A
represents the surface area of the lake.
Method B:
The second method for
calculating the volume of the lake used the same data points and contour map
incorporated into Method A to create a computer-generated model of the lake.
Volume calculations were based on this second model. Data points were expressed
as UTM coordinates the digitized data was created with MapInfo Professional 5.0.
The gridding calculations, contouring, and graphics were completed using Surfer
7 contouring software.
The first step involved
digitizing the hand contoured map of Varthur Lake, thus converting each contour
into a data file composed of a series of points expressed as X, Y, and Z (east,
north, and depth) coordinates. The data points from the February field sampling
were also entered directly into the data file. All data points were referenced
using coordinates taken from the 1980 SI map of Varthur Lake. The resulting data
was treated using the Kriging formula option, which analyses the given data and
extrapolates information for areas where no data is available. This analysis
produced a grid file of the lake with data points spaced at 5-meter intervals.
The resulting grid file was then subjected to a blanking file representing the
shoreline of the lake in order to reduce any data that the Kriging program had
extrapolated outside the boundary of the lake to a nil value. All volume
calculations were derived using options incorporated into the software,
including computations based on the Trapezoidal Rule, Simpson's Rule, and
Simpson's 3/8 Rule.
Varthur is an extremely shallow lake, with a very large surface area in relation to its depth. The total area of the lake is estimated to be 1,478,000m2.The shoreline of Varthur Lake does not appear to have changed considerably between the early 1970s and present day, unlike many other tanks in the district that have decreased drastically in size due to encroachment.
Two methods were used to
calculate the volume of the lake. Method A employed standard formulas for
calculating the volume of a reservoir using data from the contour map presented
in Figure 2.2. Figure 2.2 is a bathymetric map of Varthur Lake and shows the
lake has an estimated maximum depth of approximately 2.0 meters. The mean depth
is estimated to be 1.05 m and the lake bottom exhibits a very gradual downward
slope from west to east, with maximum observed depth occurring near the dam
wall. These results are consistent with sedimentation patterns common to dammed
reservoirs.
Figure 2.2 Bathymetric Map of Varthur Lake, February 2002
Method B involved software-assisted volumetric analysis incorporating the same contour map as well as the actual data points collected in the field to extrapolate a depth profile of the lake in grid form. This profile produced a maximum estimated depth of 2.55 m, which is 0.55 m greater that that of the previous contour map. The following figure presents a visually enhanced image of the depth profile produced using method B.
Figure 2.2 Gridded Depth Profile of Varthur Lake, February 2002
Three standard calculus-based formulas were applied to the above profile, resulting in three separate but highly similar estimates of the volume. The results of these calculations are summarized below in Table 2.2.
Table 2.2 Results of Volume Calculations: February 2002
|
Method |
Information
Source |
Application
|
Estimated
Volume |
|
A |
Contour map |
Formula 1 Formula 2 |
1 553 010 m3 1 667 588 m3 |
B |
Depth profile in grid form |
Trapezoidal Rule
Simpsons RuleSimpsons 3/8
Rule |
1 574 494 m3 1 574 473 m3 1 574 519 m3 |
The widest variation in volume
estimates lies between the two formulas used in method A. This is likely due to
the large horizontal intervals found between the contour lines. The values
calculated using method B fall in between those derived using method A. The mean
average of method B values is 1,574,495 m3, with a
standard deviation of 19 m3. These values are more consistent, in
part because the depth profile provides more detail than the contour map.
The remainder of the
morphometric parameters for Varthur Lake is listed on Table 2.3. These results
emphasize the fact that the whole of Varthur Lake is shallow in relation to its
surface area. The lake exhibits low shoreline development consistent with the
lack of topographical diversity in the region; this factor contributes to the
regularity of the sedimentation patterns within the lake as there are few
formations to interfere with the water currents.
Table 2.3 Morphometric Parameters of Varthur Lake, February 2002
|
Parameter |
Values
from Contour and SI Map |
Alternate
Values from Depth Profile in Grid Form |
|
Area |
1
478 000 m2 |
1
477 196 m2 |
|
Maximum
observed depth |
1.85
m |
|
|
Maximum
estimated depth |
2.0
m |
2.55
m |
|
Mean
depth |
1.05
m |
1.07
m |
|
Relative
depth |
0.15% |
0.19% |
|
Shoreline |
6
560 m |
|
|
Shoreline
development |
1.52 |
|
|
Maximum
length |
1
810 m |
|
|
Maximum
width |
1
040 m |
|
|
Mean
width |
117
m |
|
As silt and sediment-laden water
enters Varthur Lake from the Bellandur Canal, the velocity and turbidity of the
water decreases considerably due to the increase in cross-sectional area and the
presence of large mats of water hyacinth. At this point, the water no longer
contains sufficient energy to displace or carry larger suspended particles.
These particles are deposited on the lake bottom near the inlet, forming a
delta. Smaller suspended particles are deposited further away from the inlet
where the velocity and turbulence decrease further. This forms a gradual
downward-slope along the length of the reservoir, with the deepest section
occurring near the dam. The velocity of the water increases as its approaches
the northeast and southeast outlets, and these areas appear to accumulate less
sediment that the main body of the lake.
Varthur may have a slightly less
silt than the other tanks in the area due to desilting performed by local
residents around the edges of the lake. This activity was observed in several
areas along the northern shoreline while conducting field sampling. Varthur Lake
has a catchment area of 1.8 km2, the second largest in the
Bangalore South taluk (Govt. of Karnataka, 1990). This catchment area contains a
substantial human population engaged in agriculture and various industries and,
therefore, the potential for accelerated sedimentation due to anthropogenic
causes is substantial. Without previous depth profiles of the lake, it is
difficult to estimate the rate of sedimentation. However, even if the historical
depth of Varthur is very shallow, its lack of depth makes it highly susceptible
to increases in sediment loading caused by human development within the
catchment area.
Loss of depth and volume would reduce the water supply available to local farmers who continue to use Varthur as a primary water source. It would also have a detrimental effect on the quality of water in the reservoir and degrade habitat for fisheries and wildlife. The ability of the lake to moderate the local climate would be reduced, as the amount of energy absorbed and released by the lake would decline along with its depth and volume. Accumulation and impaction of silt on the lake bottom also has the potential to impede the infiltration of rainwater into the aquifers below. This infiltration is the main water source of groundwater recharging in the Bangalore area. Varthur Lake represents a major local reservoir of rainwater and a reduction in the permeability of its benthic layers would decrease the water resources available from local open and bore wells. These wells are the primary source of domestic, potable, and agricultural water, and their decline would be detrimental to the people living in the area. The method of volume calculation based on hand-drawn contour maps and formula 1 yielded results very similar to those obtained using sophisticated software programs and is a more practical approach for volume estimation when the resources employed in method B are not available.
Varthur Lake is a shallow,
artificial reservoir with a mean depth of approximately 1.1 m as of February
2002. The pattern of sedimentation in the lake is consistent with that of a
typical dammed reservoir. The western portion of Varthur located near the
primary inlet is extremely shallow. The depth gradually increases moving towards
the eastern portion of the lake, reaching maximum depth, estimated from 2.0 to
2.55 m, near the dam wall. Varthur Lake, like many tanks in the Bangalore area,
is suffering from rapid sedimentation that poses a threat to the ecology and
very existence of the lake. In order to gauge the rate at which it is filling
in, studies measuring the sediment loading of the reservoir should be
undertaken. Comparing the amount of suspended solids present in the inflow and
outflow would not yield an accurate estimate of the amount of sediment actually
settling in Varthur because much of the sediment is organic debris from
autotrophic organisms living in the lake itself. The feasibility of using
sediment traps as an alternate means of measuring sediment loading of the lake
should be investigated. Analysis of the composition and permeability of the
underlying sediment through core sampling would be very useful in determining
the impact of sedimentation on the recharging of groundwater supplies. Removal
of accumulated sediment has historically been a regular aspect of tank
maintenance. Records referring to the desilting of Bangalore tanks date back to
the early 16th century. Some form of desilting will eventually have
to take place in Varthur in order to retain the water-holding capacity of this
reservoir.
Monitoring of the morphology and
sedimentation patterns is an important, but often neglected, aspect of the limnological
analysis of Bangalores tanks. In order to preserve and enhance the substantial
benefits provided by Varthur Lake, information regarding these parameters should
be expanded and employed to prevent the unnecessary loss of this valuable resource.