
|
|
Contents |
REPRINTED FROM
|
|
|
WIND ENGINEERING
|
|||
|
VOLUME27, No.6, 2003
|
|||
|
MULTI-SCIENCE PUBLISHING COMPANY
|
|||
|
5 WATES WAY' BRENTWOOD . ESSEXCM159TB
. UK
|
|||
| TEL: +44(0)1277 224632 . FAX:+44(0)1277 223453 | |||
|
E-MAIL:mscience@globalnetco.uk . WEBSITE:
www.multi-science.co.uk
WIND ENGINEERINGVOLUME27, No.6, 2003 pp 549-553 549 |
Cut-in note
Wind energy potential in Karnataka, India
Ramachandra T.V.* and Shruthi B.V.+
*Energy Research Group, Centre for Ecological Sciences,
Indian Institute of Science, Bangalore 560012, India.
E-mail: <cestvr@ces.iisc.ac.in> <cestvr@hamsadvani.serc.iisc.ac.in>;
<energy@ces.iisc.ac.in>
+Centre for Sustainable Technologies (ASTRA), Indian Institute of Science.
For securing maximum output of power using a given type of wind electric generator, an assessment of the wind resource available at any prospective site is essential. Estimation of wind power potential is based on data of,the wind frequency distribution at the site, are collected from official meteorological data. The analyses show that coastal and dry arid zones in Karnataka have good wind potential.
Wind energy commerce is one of the fastest-growing and economic energy sectors in the world [1, 2]. However, the wind resource is governed by the climatology of the region concerned and has large variability in location and season. Hence, the need to conduct wind resource surveys for exploiting wind energy, as below for Karnataka, India.
| METHODOLOGY |
It is customary to average the wind speeds during each hour and use the hourly mean wind speed as the basic parameter in calculations of wind power. The relationships between annual mean wind speed (at anemometer height of 10 m) and potential value of the wind energy resource as considered in India are listed in following table.
| Relationship between annual mean wind speed and wind energy potential | |
| Annual mean wind speed@ 10 m Height | Indicated value of wind resource |
| < 4.5 m/s | Poor |
| 4.5 - 5.4 m/s | Marginal |
| 5.4 - 6.7 m/s | Good to Very Good |
| > 6.7 m/s | Exceptional |
In locations where data are not available, a qualitative indication of a high annual mean wind speed can be inferred from geographical location, topographical features, wind-induced soil erosion, and deformation of vegetation. However, accurate determination of the mean annual wind speed requires anemometer data for at least 12months. Availability of wind energy and its characteristics have been studied for 45 locations in Karnataka based on primary data at selected locations and data collected from the meteorological observatories of the India Meteorological Department (IMD), where 3-cup anemometers with 127mm diameter conical cups, in conformity with international practice, are used. Anemometers at different meteorological stations are normally at 10m height, but if at a different height the data are adjusted to 10m by the IMDaccording to methods of .the World Meteorological Organization. Since modern wind turbines have hub heights greater than 10m, we extrapolate to 30m above ground using equation 1.
V = Vo [h/ho]k
Where, v: wind speed at height h (m/s), Vo:wind speed at anemometer height ho (m/s),
h = height at which wind speed is measured m), ho: anemometer height (10 m), k = height
exponent (0.14)
Wind energy conversion systems would be most effective in these locations during May to August. The Energy Pattern Factor (EPF) and Power densities at 30m are computed for sites with hourly wind data. With the knowledge of EPF and mean wind speed, mean power density is computed for the locations with only hourly monthly data. Wind power density of a stream of air with density d moving with a velocity Vrnis given by,
P = KEm d Vm3 / 2 ----------(2)
Where, KEm is the energy Pattern factor.
KEm = (SVi3 / Nm) / Vm3 --------(3)
Where, Vi : Hourly wind speed during the month, Nrn:number of hourly wind speed values during the month, and Vm : monthly mean wind speed. For a Rayleigh distribution of wind speed, KEm= 1.91.Values of KErnvaries from 1.05 (Jogimatti), 1.33(Chikkodi) to 1.44 (Gokak, Khamkartti)
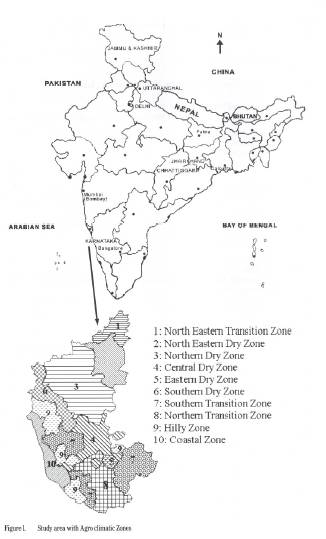
Wind potential analysis across agro-ciimatic zone confirms the role of geographic, topographic and meteorological characteristics of a location to wind speed variability. Table 2
| Table 2. Wind monitoring stations with annual mean wind power density (> 150 W/m2) |
||||
| Location | Latitude | Longitude | Wind speed | Power Density, at 30m, m/s W/m2 |
| Arasinagundi | 14°29'N | 76°50'E | 7.5 | 458 |
| B.B. Hills | 13°26'N | 75°45'E | 7.7 | 468 |
| Chikkodi | 16°20'N | 74°30'E | 6.5 | 264 |
| Godekere | 13°20'N | 76°40'E | 5.5 | 155 |
| Gokak | 16°0TN | 74°4TE | 5.9 | 168 |
| Gujannur | 14°58'N | 75°54'E | 6.5 | 184 |
| Hanamsagar | 15°54'N | 76°02'E | 6.1 | 173 |
| Hanumanhatti | 15°55'N | 74°43'E | 6.1 | 165 |
| Horti | 17°05'N | 75°40'E | 5.6 | 173 |
| Jogimatti | 14°1O'N | 76°22'E | 8.7 | 498 |
| Jogimatti | 14°11'N | 76°25'E | 8.6 | 493 |
| Khamkartti | 15°45'N | 74°35'E | 5.8 | 159 |
| Kahanderayanahalli | 14°30'N | 75°45'E | 5.6 | 183 |
| Madekeripura | 14°13'N | 76°2TE | 7.5 | 244 |
| Malgatti | 15°52'N | 75°55'E | 6.1 | 156 |
| Sangundi | 16°15'N | 75°44'E | 5.7 | 153 |
| Sogi A | 14°55'N | 75°59'E | 7.4 | 200 |
| Sogi B | 14°54'N | 75°59'E | 6.8 | 184 |
lists locations in the respective agro-ciimatic zones with mean wind speed greater than 18kmper hour (i.e. >5m/s) [4].Among these sites, wind energy generators totaling a capacity of 3.5 MWhave been functional since 1998-99at Chikodi. Figure 2 depicts monthly variations across Northern dry zone
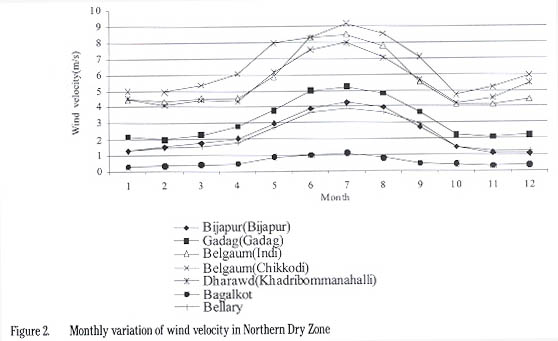
Initial analyses of wind speed across the agroclimatic zones show that Northern dry zone in Karnataka has good wind potential, which if exploited would help local industries and agriculture. These initial tabulations can be used for preliminary strategic wind power planning, by detailed study at proposed sites.
1. Cheremisinoff N.P., (2003) Fundamentals of wind energy, in: AI-Mohamad,A.,Karmeh, H,Wind energy potential in Syria,RenewableEnergy,Vol.28,No.7, pp.1O39-1O46.
2. Milborrow,D.,Tishler, C, Harrison and L., O'Bryant, M.,(2003) The Windicator, in: Junginger, M., Faaij, A., Turkenburg, WC, Global experience curves for wind farms, Energy Policy. http://www.sciencedirectcom (In Press).
3. Ramachandran A., (2002) Teri Energy Data Directory & Yearbook - 2001-2002, TERI, New Delhi, India.