CITATION: Ramachandra T V, 2011. Renewable energy transition: Perspective and Challenges, In: Energy India 2020- A Shape of Things to come in Indian Energy Sector, Saket Projects Ltd., Ahmedabad, Pp:175-183
Energy is essential for economic and social development of a region or a nation. However, consumption of fossil fuels is the major cause of air pollution and climate change. The threat posed to sustainability by greenhouse gas emissions and deterioration of the natural resource base (for example oil crisis, Fuelwood scarcity, etc.) has caused worldwide concern. Improving energy efficiency and de-linking economic development from energy consumption (particularly of fossil fuels) is essential for sustainable development of a region. The energy sector, on one hand, is a part of the economy and on the other hand it itself consists of parts such as energy supply and energy demand interacting with each other. Both these interactions are of immense complexity. Energy is required for all the economic activities. Energy supplies are essential for both intermediate production as well as final consumption. So, economic development is dependent on the energy system of the country. In turn, the implementation of technologies or improvement of the energy system is dependent on economic factors such as capital costs, energy prices etc. Also, the demand supply balances involve the flow of energy from source as primary energy to service as useful energy. At each stage of the energy flow, technologies are involved with different conversion efficiencies and losses1. Energy has always been a major component in the day-to-day life of humans. More than a billion people in the industrialised countries (about 20% of the world’s population) consume nearly 60% of the total energy supply whereas about five billion people in developing countries consume the other 40% of the total energy supply. The two billion low income people ($ 1000 annual income per capita or less) scattered in rural areas and scanty towns use only 0.2 toe (tonne oil equivalent) of energy per capita annually, whereas about a billion rich people ($ 22000 annual income per capita or more) use nearly 25 times more, at 5 toe per capita annually. Every country is trying for economic growth through energy intensive paths. Energy intensities are useful indicators in describing the energy used for entire production chains. The combination of sectoral energy intensities with the demands for sectoral outputs provides insight into total energy use in an economy. Changes in energy use reflect the combined effects of changes in energy intensities in various sectors and changes in the volume and structure of demand. Energy needed per unit of production (referred as energy intensity or specific energy consumption) shows the sensitivity of products or sectors to changes in energy prices. Temporal analyses or a historical study of energy intensities provides information about changes caused by energy-price changes and their effects on total energy use. The paradox when dealing with energy is that it is needed for man to live and develop, and at the same time, unplanned developmental activities focusing more on fossil fuels is affecting the environment he is living in. Moreover, the evolution of the societies, the economic growth and the way countries develop lead to an increasing demand for energy. Two problems arise with the increasing energy consumption: firstly, pollution associated with energy consumption increases leading to unknown changes in world climate that could have tremendous repercussions, and secondly, fossil fuels commonly used are not renewable. Even if people are concerned about the future of the planet, power of money and need for economic growth dominate the debate. Studies have been made on the different resources, nuclear power and the friendly environmental energies like solar, wind and others in order to replace the fossil fuels and more generally the non-renewable energies. The energy use per-capita has been used as an index of a nation/region’s development. Energy per-capita is quite small for developing countries and high for developed countries. However, this approach does not reveal any picture of development or efficiency of usage. To achieve this it is necessary to look at the energy intensity, which is energy/GDP. The energy consumption per GDP gives the efficiency for the energy sector. The energy intensity of a process (energy consumed per unit of output) is the inverse of the energy efficiency of the process (output per unit energy consumed). The impact of more efficient energy use in reducing energy demand, and the overall prospects for restraining energy demand growth, are important issues in the context of environmental policy. Energy intensity is directly related to price signals whereas energy efficiency depends more on the diffusion of the most cost effective technologies. It is important to point out where the loss of energy is the highest in order to reduce them. It happens that some developed countries have lower or similar energy consumption per capita and a much higher gross domestic product (GDP) per capita than some developing countries. Energy services will be fulfilled only if GDP grows in a sustainable manner. Such economic growth will require the provision of corresponding energy related services at an affordable price with no reasonable expectation to break the linear relationship between GDP growth and the increase in the energy demand that has been experienced so far. Figures 1 and 2 depict the energy consumption per capita and energy consumption per GDP for all the countries2.
These figures (Fig 1 and 2) highlight that even though energy consumption/capita is low, energy/GDP for Asia and particularly for India is quite high. The energy/GDP is 10-20 times higher than that for some of the industrialised countries. This shows that there is great room for improvement of the efficiencies in energy consumptions. In order to have more disposable energy, plausible approach hence would be to increase the end-use efficiency or to minimise the loss. This results in surplus energy for more productive uses. Thus, if a country wants to increase its GDP per capita, it will have to reach high efficiencies. Improving efficiency can save huge amounts of energy. This illustrates that the increase in per capita GDP is not linked to greater energy use. Rather it lies with the judicious use of energy without contributing to carbon emissions. This analysis is revealing and results are contrary to the views “increasing per capita energy consumption to increase the GDP” of pseudo energy experts. Coal is the predominant energy source (58%) in India, followed by oil (27%), natural gas (7%), lignite (4%), hydropower (3%), and nuclear power (0.22%). Energy consumption patterns in the Indian residential sector vary widely not only among the rural and urban areas but also across various income classes in urban areas. Approximately 86.1 % rural households in India use fuel wood and dung cakes for cooking. 3.5% rural households use LPG for cooking. 50.6 % of rural households use kerosene and 48.4% use electricity as a primary source of lighting. The annual average fuel wood consumption is around 270 – 300 million tonne (Mt), kerosene consumption is about 10.5 Mt out of which 60% was in rural areas. The energy transition from coal to oil during the industrialization era, the emphasis on conservation and fuel efficiency and also the present energy scarcity highlight the need for important shifts in the economy. Earlier planning for energy development and use meant increasing the supply of energy from various sources. However, with the changing scenario of scaricty, expensiveness and unreliability has forced the energy planning to focus on the provision of sustainable energy systems including the development of energy sources and utilisation of energy. However, this would be contrary to the proponents of supply driven energy approaches who argue for enhancing the energy supply to maintain the momentum of Indian economy and minimise the gap between energy demand and supply. According to India’s Planning Commission, in order to realise or maintain the annual GDP growth rate of about 8 percent, require India to at least triple its primary energy supply and quintuple its electrical capacity. This will force India, which already imports a majority of its oil, to look beyond its borders for energy resources. The natural resource base has deteriorated considerably due to the rapid growth in population coupled with unplanned developmental activities including industrialization and urbanization. This also has resulted in exponential increase in fossil fuel consumption. Sustainable development of a region depends on the health of renewable energy resources like water, vegetation, livestock, etc. The integrated development of all these components is essential for environmentally sound development of the region. India’s energy sectors is currently facing the challenges, that are:
Road Ahead: Conserve or Perish Renewable energy resources, which the country has in abundance, such as solar, wind, biomass, small hydro, etc. can effectively meet energy demand and are environmentally benign. About 5200 MW of power generating capacity based on renewable energy sources has been installed in the country so far. This constitutes about 3.8% of the total installed capacity. The effective transition from a fossil fuel driven energy system to the renewable energy systems is possible only through the policy shift, capacity building, strengthening institutions and building infrastructure. There is a need for strengthening of existing research institutions and creation of a few centers of excellence that have state of the art research / testing facilities for renewable energy technologies. Setting up of a public sector renewable energy corporation on the lines of National Thermal Power Corporation would help in promoting the renewable energy in the country. The R & D allocation on renewable energy by the government and also Indian companies is very marginal. The present system is bogged down by favoritism and biased approaches which is rather discouraging for young researchers. Current science managers need to motivate and encourage bright young researchers of 21st century. Centralised energy planning exercises cannot pay attention to the variations in socio-economic and ecological factors of a region which influence success of any intervention. Decentralised energy planning advocated these days is in the interest of efficient utilisation of resources, ensuring more equitable sharing of benefits from development. The regional energy planning endevaour needs to focus on the area based decentralised energy plans for meeting energy needs for subsistence and development with least cost to the environment and the economy. The regional planning mechanisms take into account all resources available and demand in a region. This implies that the assessment of the demand and supply, and the intervention in the energy system which may appear desirable due to such exercises, must be at a similar geographic scale. For example, bioresource assessment of supply and demand at the aggregate level is likely to be misleading as scarcity and surplus is always at a localised level. Consequently, the energy interventions in the form of energy supply enhancement, containing demand and/or encouraging alternative fuels may be aimed at the wrong area or target group. India's present energy scenario calls for the effective management of all available resources in order to attain national objectives. A well-balanced fuel mix, in which all energy resources are appropriately utilized, is essential for sustainable development. An energy resource that are renewed by nature and whose supply is not affected by the rate of consumption is often termed as renewable energy. Planned interventions to reduce energy scarcity can take various forms, such as
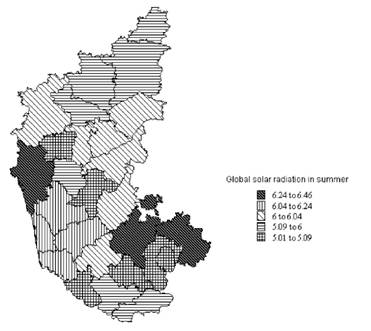
Ecologically sound development of the region is possible when energy needs are integrated with the environmental concerns at the local and global levels. Energy planning entails preparation of area based decentralised energy plans for meeting energy needs for subsistence and development with least cost to the environment and the economy. The need to search for renewable, alternate and non-polluting sources of energy assumes top priority for self-reliance in the regional energy supply. This demands an estimation of available energy resources spatially to evolve better management strategies for ensuring sustainability of resources. The spatial mapping of availability and demand of energy resources would help in the integrated regional energy planning through an appropriate energy supply - demand matching. Now let us look at the energy situation in Karnataka. Energy utilisation in Karnataka considering all types of energy sources and sector wise consumption revealed that traditional fuels such as firewood (7.440 million tonnes of oil equivalent - 43.62%), agro residues (1.510 million tonnes of oil equivalent - 8.85%), biogas, cowdung (0.250 million tonnes of oil equivalent - 1.47%) accounts for 53.20% of the total energy consumption in Karnataka. In rural areas the dependence on bioenergy to meet the domestic requirements such as cooking and water heating purposes are as high as 80 to 85%. Efficient use of energy is achieved when unnecessary energy conversions are avoided, as each conversion has limited efficiency and therefore, implies a certain loss of energy as wasted heat. For instance, if secondary energy can immediately serve as final energy or even as useful energy, substantial losses can be avoided, for example wind machines in irrigation or hydro turbines powering a shaft. This principle favors decentralised energy generation and is particularly relevant with new and renewable energy sources. Very high efficiencies can be achieved with cogeneration, where heat as a by-product of power is not wasted, but put to good use on the spot4-7. Renewable Energy: Perspective and Challenges India has the potential to emerge as a key global player in renewable energy by shifting the energy policy focusing on renewable sources of energy and also by positioning India’s expertise / knowledge and making it available for the developing world7. Feasible energy sources are:Solar Energy: An annual energy of 1.5 x 10¹⁸ kWh is obtained from the sun to the earth. This is about 10,000 times larger than the current annual energy consumption of the world. The surface temperature of the sun is around 5503.85°C. Energy is continuously released from the sun by a fusion reaction, which produces 3.94 x 10²³ kW of power. Radiation from the sun takes about 91/3 min to cover 93 million miles to the earth. The earth receives only a small fraction of the total power emitted by the sun, an amount of 1.73 x 10¹⁴ kW or 340 w/m2 averaged over the whole earth surface. Approximately 30% is reflected back to space and 20% is absorbed by clouds, dust and “greenhouse” gas such as water vapour, carbon dioxide and ozone. The annual global radiation in India varies from 1600 to 2200 kWh/m2, which is comparable with radiation received in the tropical and sub-tropical regions. The equivalent energy potential is about 6,000 million GWh of energy per year8. India receives solar energy equivalent to more than 5,000 trillion kWh per year, which is far more than its total annual energy consumption. The daily average global radiation is around 5 kWh per m2 per day with the sunshine hours ranging between 2300 and 3200 per year. Though the energy density is low and the availability is not continuous, it is now possible to harness this abundantly available energy very reliably for many purposes by converting it to usable heat or through direct generation of electricity. Karnataka has a gross potential of about 20000 MW. A project of 4 MW has been commissioned of 18 projects sanctioned by the government (of 116 MW). Karnataka receives global solar radiation in the range of 5.1 - 6.4 kWh/m2 during summer, 3.5 - 5.3 kWh/m2 during monsoon, and 3.8 – 5.9 kWh/m2 during winter. Districtwise potential analysis (figure 3) reveals that, maximum global solar radiation is in districts such as Uttara Kannada, Dakshina Kannada etc. The study identifies that coastal parts of Karnataka with higher global solar radiation are ideally suited for harvesting solar energy. Global solar radiation in Uttara Kannada during summer, monsoon and winter is 6.31, 4.16 and 5.48 kWh/m2 respectively. Similarly, Dakshina Kannada has 6.16, 3.89 and 5.21 kWh/m2 during summer, monsoon and winter, while Mandya district has minimum global solar radiation of 5.41, 3.45, 3.73 kWh/m2 during summer, monsoon and winter.
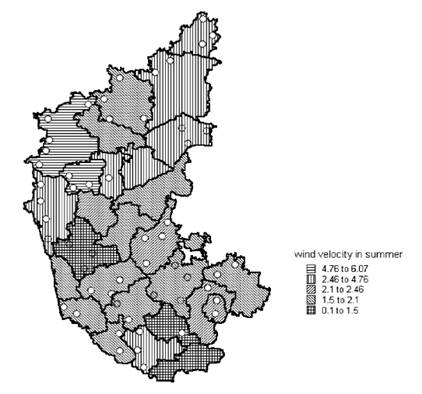
Wind Energy: According to initial estimates, India's wind power potential was assessed at around 20,000 MW. It has been re-assessed at 45,000 MW, assuming 1% of land availability for wind power generation in potential areas. However, the present exploitable technical potential is limited to 13,000 MW, on account of the limitation of grid capacity in the State Grids. Grid penetration of more than 20% could result in grid instability. The technical potential will go up with the augmentation of grid capacity in the potential States. Karnataka has a gross potential of about 10000 MW. 428 projects totaling to 1500 MW have been commissioned of 600 projects sanctioned by the government (of 8000 MW). Wind potential assessment in Karnataka (Figure 4) shows the number of wind monitoring stations. Chikkodi in Belgaum has the highest wind velocity. Wind velocity in Chikkodi taluk, Belgaum district during summer, monsoon and winter are 6.06, 8.27, and 5.19 m/s, while Bagalkote district has lowest wind velocity (0.52, 0.85, 0.33m/s during summer, monsoon, and winter respectively)9.
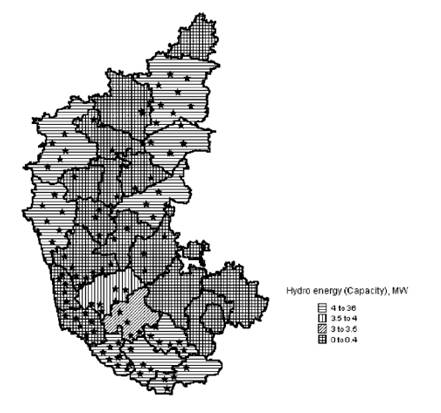
Hydro Energy: The capacity of hydropower plants can vary between a few kW to about 1000 ‘s of kW. Depending on this hydro power plants are classified as Micro (up to 100 kW), Mini (up to 3 MW) and Small (up to 25 MW) plants. The small hydropower plant (SHP), i.e., up to 25 MW capacity is set to attain commercial status in the country. SHP projects are becoming economically viable with appropriate systems for evacuation/ utilisation of power from the project being increasingly put in place. In India over 4215 small hydro power plant sites have been identified with a total capacity of 10279.71 MW. India has an estimated SHP potential of about 15,000 MW. 453 SHP projects with an aggregate installed capacity of 1463 MW have been installed. Besides, 199 SHP projects with an installed capacity of 538 MW are being commissioned. The Karnataka state government has so far accorded permission to private developers to establish small hydro projects in more than 320 locations amounting to 2100 MW. 64 projects have been commissioned with an installed capacity of 490 MW. Figure 5 illustrates the location of small hydro power plants with their capacities10.
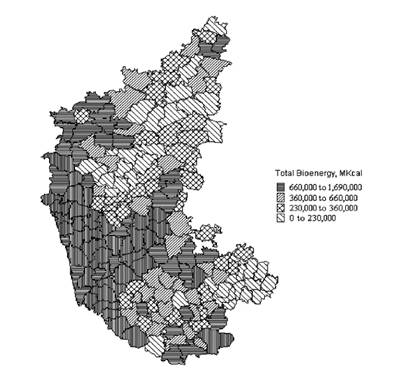
Bioenergy: The total bioenergy potential in India is about 19,500 MW, including 3,500 MW of exportable surplus power from bagasse-based co generation in sugar mills and 16,000 MW of grid quality power from other biomass resources. The total installed capacity in the country, as of December 31, 2002 is 468 MW and projects of capacity 530 MW are in various stages of implementation. Biomass gasifier of total capacity 55.105 MW has so far been installed, mainly for stand-alone applications. Quality of life in rural areas have improved through the efficient use of locally available bioenergy sources by recovering the energy from cattle dung, human waste and non-woody organic wastes without losing their manure value through biogas plants. Against an estimated potential of 12 million biogas plants, about 3.44 million family type plants have been set up so far, representing coverage of over 28 per cent of the potential. In addition, about 4000 night soil-based and institutional biogas plants have been set up. Monitoring of these plants by the regional offices of the Ministry of New and Renewable Energy Sources (http://mnes.nic.in) shows an overall functionality of 86 per cent. These plants have helped to save 44 lakh tonnes of fuelwood, produced 450 lakh tonnes of manure per year. An estimated 4.5 million people/day of employment has also been generated in the rural areas. Research and development efforts are to be encouraged to develop new designs and improve the efficiency of biogas plants in different geographical and climatic conditions11-12. The bioenergy resource potential assessment reveals that maximum bioresource is in Channagiri taluk (8990963 Mkcal) Davangere district, where agricultural residue constitutes 1.67% of the total bioresource, 13.65% from forest residue, 83.97% from horticulture residue, 0.04% from plantation and 0.65% from livestock. Anekal taluk in Bangalore Urban district derives minimum energy from bioresource (40210.28 Mkcal). Agricultural residue constitutes 21.16% of the total bioresource, 8.80% from forest residue, 37.74% from horticulture residue, 3.74% from plantation and 28.54% from livestock. Figure 6 illustrates talukwise bioenergy availability from plant and animal residues. Resource wise analysis of the study area reveals that bioresource from horticulture constitutes the major share of 43.6%, forest 39.8%, agriculture 13.3%, livestock 3.01%, and plantation.15%.
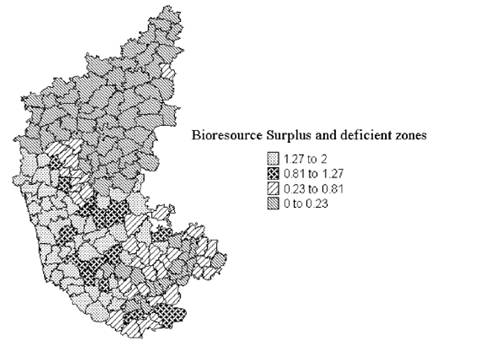
Bioresource Status: The ratio of bioresource availability to demand indicates the bioresource status. Ratio greater than one indicates the presence of surplus bioresource, while a value less than one characterises a bioresource deficient zone. When this ratio is less than one, bioresources become non-renewable energy sources as there is scarcity of resources. The computation of bioresources status, talukwise shows that Siddapur taluk in Uttara Kannada district has the highest bioenergy status of 2.004. Anekal taluk in Bangalore Urban district has the least status of 0.004. Figure 7 shows taluk wise bioresource status of Karnataka13.
The energy conservation to the tune of 42% is possible by using improved cook stoves. Apart from this, the options such as sustainable management of energy plantation (optimal utilisation of the wastelands), biomass gasifier and biogas technology would help in overcoming the fuel crisis. Energy plantations raised on degraded lands will help in improving the ecological status of the region, provide biomass feedstock for rural bioenergy programmes and also help in meeting urban fuelwood demand. With appropriate species mixes, it also provides fodder for livestock, leaves for biogas and other valuable tree products. In the agro climatic zones having higher bioresource potential, sustainable usage should be emphasized to maintain their status. This has become imperative owing to the alarming population growth, mainly in the coastal zone. Active participation of the rural people in bioenergy programmes is required for its successful implementation. In the bioresource deficient zones, the forest stocking can be improved by afforestation of the degraded lands, popularizing social and community forestry. In the drier zones, judicious cropping patterns, improved irrigation facilities and adopting innovative techniques for dry land farming will not only increase the grain production, but also provide enough residues for energy. Adopting a holistic approach to elevate the bioresource status requires sound planning considering the agro climatic, social, economical and technical aspects. Apart from meeting the rural energy demand, such programmes provide local employment generation (production and processing of wood feedstock, operation of biogas and producer-gas systems), promote self-reliance, and improve the quality of life, especially of women and rural poor. Even though bioenergy provides significant environmental and social benefits, large-scale shift towards this option cannot be realized in the absence of a whole range of policy measures. A well-established network between the government, local people, NGO’s together with technical expertise and financial backup will help building a society sustaining on bioenergy. Innovative Technologies In the face of increasing CO2 emissions from conventional energy (gasoline), and the anticipated scarcity of crude oil, a worldwide effort is underway for cost effective renewable alternative energy sources. In this regard my research group (Energy Research Group at IISc – Ramachandra T V, Supriya G, Karthick B and Durga Madhab Mahapatra) in collaboration with Dr. Richard Gordon (University of Manitoba, Canada) is developing the gasoline secreting diatom solar panels to produce gasoline from diatoms sustainably14. Diatoms being the major group of planktonic algae can be used sustainably for production of bio-fuel, by the usage of diatom based solar panels. Studies have shown that diatoms could make 10 to 200 times as much oil per hectare as oil seeds. The publication14 entitled “Milking Diatoms for Sustainable Energy: Biochemical Engineering versus Gasoline-Secreting Diatom Solar Panels” is published in the October issue Ind. Eng. Chem. Res. 2009, 48, 8769–8788 of American Chemical Society (http://pubs.acs.org and http://ces.iisc.ac.in/energy). Till now wherever there is biofuel generation by way of using bioresources, the process involved growing them artificially, crushing them to collect the lipids and then filtering the lipid to extract oil and use as biofuel. But our technique does not involve crushing biomass for extracting oil. The approach also looks at reducing the cost of oil extraction. Our study resulted in some basic and a few unusual findings thus far. It was found that some diatoms secrete more lipid content when subjected to unfavourable environment or culture conditions, such as nutrient starvation or extreme temperatures. Unlike crops, diatoms multiply rapidly. Some diatoms can double their biomass within an hour to a day’s time. Since each diatom creates and uses its own gas tank, it is estimated that diatoms are responsible for up to 25 percent of global carbon dioxide fixation. This means that while diatoms can be cultivated for oil extraction, they can automatically reabsorb carbon dioxide in the process. We propose to manipulate cells in diatoms so that they actively secrete oil (similar to mammary gland secreting milk). Unlike ordinary solar panels that produce electricity, a diatom solar panel would produce oil for us, therefore, in designing it we would have to solve various optical and mass transport problems
Diatoms may have a major role to play in the coming years with regard to the mass production of oil. This entails appropriate cultivation and extraction of oil, using advanced technologies that mimic the natural process while cutting down the time period involved in oil formation. Energy from Wastes: Urban areas are generating large quantum of waste. For example, Greater Bangalore generates about 1200 MLD of liquid waste and about 2800 tonnes of solid waste every day. Untreated wastes are contributing to Green house gases in the system and also to global warming15. Viable technologies are available to convert this to energy. For example, an algae photo-bioreactor that grows algae in municipal wastewater to produce biofuel and a variety of other products is in place. This bioreactor won’t compete with agriculture for land, fertilizer, or freshwater. Similarly, to handle the organic fraction of municipal waste (which constitute 60-70% of Bangalore’s municipal waste), Centre for Sustainable Technologies at IISc has developed a viable technology. The policy shift, political will and active participation of local community are required to see these technologies are in place and Bangalore is free of wastes16-18. Acknowledgement: I am grateful to Indian Institute of Science for providing a wonderful academic environment to carry out energy, ecology and environment research during the last two decades. I thank NRDMS Division, the Ministry of Science and Technology (DST) and The Ministry of Environment and Forests (MoEF), Government of India for the sustained support. References
|
|||||||||||