T. V. RAMACHANDRA and D. K. SUBRAMANIAN
Centre for Ecological Sciences. Indian Institute of Science. Bangalore 560012, India
Energy Convers.Mgml Vol. 38, No.6, pp. 563-599, 1997 Elsevier Science,Printed in Great Britain.
| ABSTRACT |
Energy is essential for industrial production. Because of the past abundance of low-cost energy, historically, the rate of social progress among industrial societies has not been limited by energy availability. Energy cost has not been significant when compared with no energy use. Mechanisation of agriculture, increased use of electrical appliances in the domestic sector and rapid industrialisation to meet the demand of exponentially growing population have resulted in an energy crisis. The raised fossil fuel prices and the environmental factors playing the dominant role in implementation of large scale projects, such as hydro, thermal and nuclear, have aggravated the problem further. In this context, an integrated energy plan for a country seems essential for ecologically sound development of a region. An integrated plan includes strategies to:
Conservation through improvement of the efficiencies of end use devices is one of the most effective ways to provide immediate relief for the energy problem. This helps to maintain economic growth and social progress of a region. Environmental problems, resource depletion and growing demand of energy in the state/region make it increasingly imperative that we use energy as efficiently as possible, and planners should take note of this untapped resource. The potential for improved energy efficiency is great, and a substantial part of that potential could be realised in the course of events. The industrial sector constitutes a major consumer of commercial energy. Improvement of energy efficiency in the industrial sector would result in a slower rate of energy growth. A secure energy supply is the major concern of most industrialists. It is, thus, necessary to examine industrial energy use and the economy. The analyses of consumption patterns and the assessment of feasible energy conservation possibilities show that the potential for energy conservation in the industrial sector and in all sectors is substantial. The barriers identified to tap this potential are a lack of information on specific measures and options for achieving energy conservation, lack of capital for schemes involving technology upgrading and efficiency improvements. pricing policies which deviate from rational tariffs and the inadequacy of institutional arrangements for promoting energy conservation in different sectors of the economy. In this regard, research should be sponsored to develop system designs, cost and pricing policies, problems related to system interconnection with public utilities and an assessment of potential energy savings, and research into methods of matching energy resources to work requirements, rather than vice versa, for improved efficiency. It is essential for the planning machinery to foster the integrated approach in energy planning of a region.
This paper discusses an attempt made by us to illustrate the industrial energy scene in Karnataka and reveals the possibilities of energy conservation. Analysis of the energy consumption data of Karnataka and India shows that the per capita consumption of energy is low (compared with 56 countries in the world), while for the industrial sector, energy per state domestic product (SOP comparable to GDP) is at least 10-20 times higher than that of industria Iised countries. This implies inefficiency in energy utilisation.
Detailed investigation of the industrial sector through analysis of the Specific Energy Consumption (SEC)-industry wise and yearly for a seven-year period-reveals that about 27.72% of energy could be saved in the industrial sector. This, when quantified, accounts for savings of 1541 million kWh per year in Karnataka, which is equivalent to the power output of 300 MW (Mega Watts) electric power generating station (hydro/thermal).
Per capita energy consumption(PCCE) Gross domesticproduct (GDP) capita GDP Energy elasticity Specific energy consumption (SEC) planning Energy intensity Per SEC ratios Energy
| INTRODUCTION |
Energy utilisation in India and in Karnataka State differs radically from that of other, industrialised countries. Non-commercial sources of energy. such as firewood and agricultural residues, constitute the main source of energy in rural areas. There are enormous variations in the amount of energy used within India in different states and regions. There exists regional disparities both in terms of energy supply and demand. Linkages between various energy sub-sectors, such as coal, oil, electricity and non-commercial energy sources, are non-existent. Energy planning in our country is not an integrated activity. The plans for electricity, oil, coal and firewood are separate exercises. Secondly, the planning activity considers only the demand and projects the demand over a period of years. Efficiency in utilisation has not been investigated.
The primary goal of planners is supply expansions based on the assumption of linkage between energy consumption and the economic growth of a region. With this approach, energy becomes an end in itself, and the focus shifts on meeting increased energy consumption through energy supply expansion alone: This supply and demand based planning for each individual energy form has resulted in problems like inefficiency,losses, more conversions and other environmental problems. This conflict between energy demand and environmental quality goals can be solved by an integrated approach to the problem of energy planning with emphasis to minimise the consumption of non-renewable sources of energy, such as coal, oil, etc. to maximise the efficiency of end use devices in all sectors and to organise an approach towards optimal use of renewable sources. This path would certainly help in boosting economic growth of a region, and equally important, it promotes structural changes which are conductive to overall development. In order to get an idea of Karnataka and India's level of energy consumption with other countries, we have carried out energy analyses and compared with energy consumption data from 56 countries.
The energy use per capita and GDP per capita data of 56 countries reveals that Karnataka State and India have very low per capita energy consumption. There are only small differences in per capita energy consumption between the developing countries. For high income countries, the difference is much larger. That is, energy use per capita increases with higher income, but cross country comparisons can be misleading and inappropriate due to large variations among countries in terms of economic structure, climate, geographic location, etc. Energy intensity (energy consumption per GDP) and GDP per capita data reveal that India and Karnataka State have high energy intensities compared to other developed industrialised countries, which clearly shows that Karnataka State and India have good potential in energy conservation. A comparative study of energy use, mainly electrical, in industries in Karnataka and in those of some other industrialised countries reveals that Karnataka consumes 6.13 times the energy consumed in Switzerland, 5.28 times the energy consumed in Japan, 3.35 times the energy consumed in the U.K. and 1.98 times the energy consumed in the U.S.A. for the same GDP (Gross Domestic Product). Sectoral energy values also have been calculated.
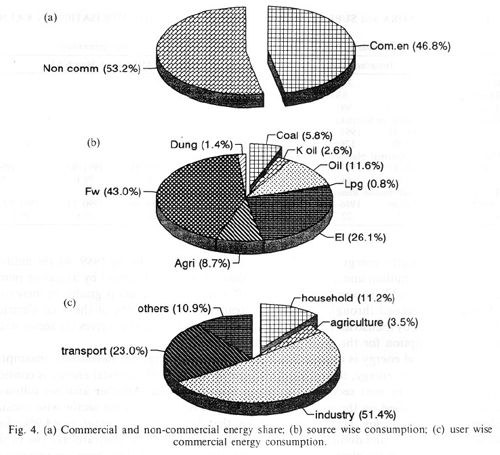
A sectoral analysis of electricity users in Karnataka shows that the growth of connected load is mainly in two categories-AEH (All Electric Homes) and Small Scale (LT) Industries. The growth rate is 19.46% for the former and 27.33% for the latter. The growth increases in the past four years are 67.4% and 55%, respectively. If we look at the annual increases in the number of installations, again the LT industrial sector has a very high rate of 38.66% followed by AEH with a rate of 19.15%. More than 50% of our industries are clustered in and around Bangalore. Barring a few exceptions, there is only limited industrial activity in other parts of Karnataka. Energy consumption patterns show that Bangalore uses 26.67% of HT energy. A few industries like Indian Aluminum at Be\gaum, VISL at Bhadravathi, etc. show higher energy consumption values for some divisions. Belgaum consumes 21.6% of total HT energy in the State. Sector wise commercial energy consumption data shows that the industrial sector, with 51.4% of total consumption, constitutes the major energy consumer in Karnataka. Hence, we have taken the industrial sector for further study.
Linkages between energy sources and the impacts of substitution of energy from one source by that from another can be understood only if there is an integrated picture of energy use. Since this type of information was not available, the energy analysis was confined to utilisation of energy from only one source, namely electricity. A survey was, therefore, conducted covering many industries in Karnataka. A questionnaire was prepared and sent to more than 250 industries. Replies received from about 60 industries were analysed for their energy consumptions for the period 1980-85. Recently, another round of surveys was carried out by sending questionnaires to 510 industries, and 78 replies were received pertaining to the data for the years 1990-91 and 1991-92. It was found that, in many industrial sectors, energy consumption/rupee of production was higher than the Indian norm. Further, energy consumption varied considerably within a group or sector, indicating a distinct possibility for a substantial reduction in energy use by many industries for the same level of production.
Similarly, a look at the specific energy consumption by an industry over a five year period shows an increase in some industries and, fortunately, a reduction in some others. The greatest possibilities for more efficient use of energy in industry lie in careful management of process heat, electricity, energy intensive materials and direct fuel consumption. Processes involving energy intensive operations or materials are to be reviewed to determine if new technology, recycling or substitution, or alternative forms of material or energy could be employed to increase efficiency. This paper is organised as follows: Section I discusses energy utilisation patterns and energy intensity trends among 56 countries. In Sections 2 and 3, we discuss the energy scenarios of India and Karnataka. Section 4 discusses the primary survey carried out by us for compiling data, while Sections 5-9 deal with analyses, discussion and results of the energy analyses.
| 1. PATTERNS OF ENERGY CONSUMPTION AND ENERGY INTENSITY TRENDS AMONG COUNTRIES |
The role of energy utilisation in economic growth has received much attention in the last two decades. Schurr and Eliasberg [1] investigated the long term relationship between energy consumption and real GNP. They conclude that, from 50 years time series data, there was a steady rise in energy requirement per unit of GNP initially. However, the use of energy per unit of GNP declined steadily in the next phase. Increased industrialisation initially might have resulted in the relative rise, while decline, according to Schurr and Eliasberg, is due to:
1.1. Data
The basic gross domesticproduct and energy data used in this researchare from the 1991UN
Energy Statistic Yearbook [2] and from the report "Current Energy Scene in India, 1993" published by the Centre for Monitoring Indian Economy Pvt. Ltd., Bombay [3]. The energy data
are measured in tons of oil equivalent (toe), the GDP data are measured in local currencies but
have been adjusted for price changes. The population of various countries is from the World
Population Data Sheet 1994[4].
1.2. Comparisons of energy use
Since energy consumption plays an important role in indicating the life style or quality, there
are many indicators to compare life styles in various countries. Initially, energy consumption was
compared with a country's gross domestic product (GDP). Later on, energy consumptions
per capita for many countries were plotted against GDP/capita (Fig. la). It was found from
56 countries data that there is a strong correlation existing between national output per capita and
energy per capita. Table I gives the energy-output relationships for the 56 countries and Karnataka
State.
In order to make a quantitative estimate of the response of energy consumption per capita to GDP per capita, a regression analysis is carried out for a set of data pertaining to the 56 countries. Both linear and nonlinear regressionanalyses werecarried out (about 25 types of equations were
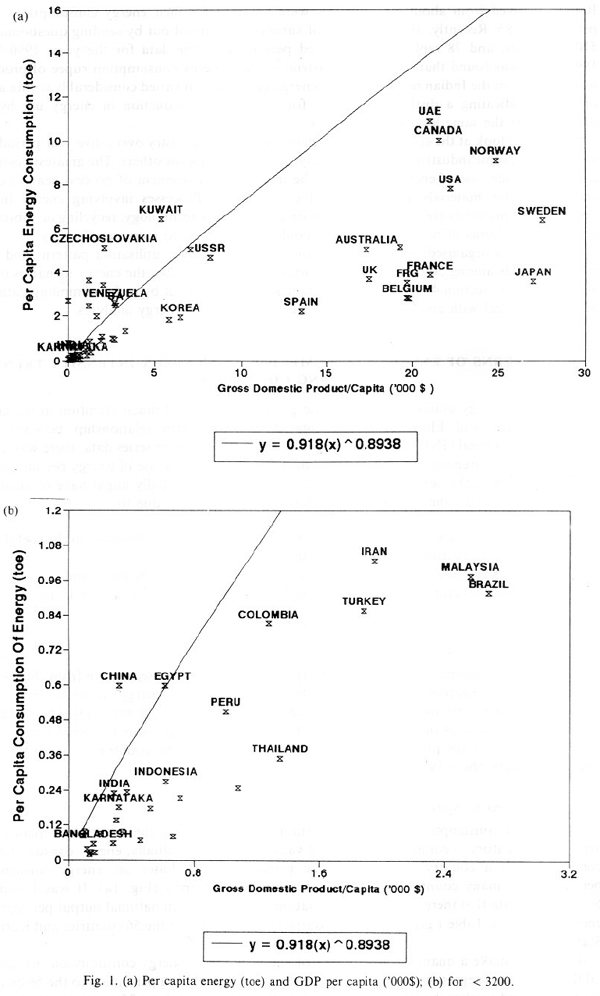
tried). Based on the lowest percentage of error and best correlation coefficient, the best fit relationship for this set of data was found to be a power law of the form
Enpc= A *GDP ------(1)
where Enpc= energy consumption per capita in kg's oil equivalent, GDP pc= gross domestic product per capita in US$.
Enpc = (0.9184)*GDpi0.8938 ,
with correlation coefficient R = 0.90, R2 = 0.8119 and std error of Y est. = 0.05792.
Similar analyses carried out earlier by Janosi and Leslie [5]have shown quantitatively for each of
31 countries that' the relationship between En (Energy consumption) and GDP (gross domestic
product) is
Log(En) = A + B* Log(GDP),
with R2 in all cases being greater than 0.8. Even though the statistical reliability of the regression
is uniformly high, the striking substantive result is that the relationship between the economic
growth and energy consumption differs widely among various countries in terms of exponent B.
Exponent B in equation (1) is also referred to as the income elasticity of energy consumption and
is, in part, influenced by a country's stage in economic development. B is less than one for countries
like Japan (0.9605), U.S.A. (0.9588), France (0.8788), U.K. (0.4780) and Germany (0.6612), while
for countries like India (1.8925), Thailand (1.9341), Mexico (1.3328), Italy (1.7662) and Phillipines
(2.0696), it is greater than one. This shows that the energy consumption is, in part, influenced by
a country's stage of economic development. Apart from this, the structure of energy consumption
exerts an important influence on the elasticities, depending on the efficiency, price of predominant
energy sources, economic structure and climate.
Table 1a lists the countries in order of increasing GDP per capita. For each country, energy use
per capita (PCCE), energy intensity or specific energy consumption (both excluding and including non-commercial (traditional)energy) computed are also listed in the following table.
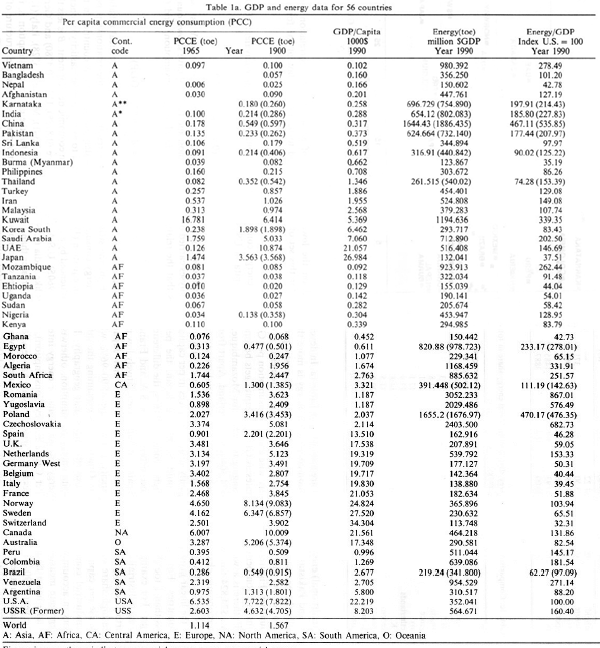
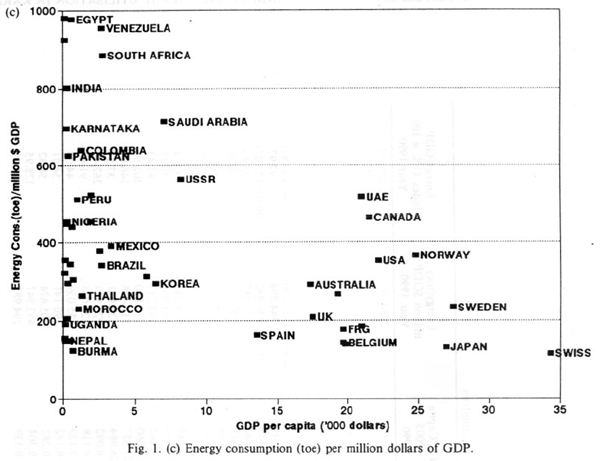
In developing countries, like India, Nigeria and Pakistan, the share of non-commercial energy is more than 50%. Figure 1a depicts pictorially the per capita consumption of energy vs gross domestic product per capita. , Figure Ib is the plot of per capita consumption of energy vs gross domestic product per capita for low income countries. Figure Ic gives country wise energy consumption per GDP. It is noticed that the energy consumption per capita accelerates as GDP per capita gets beyond $500. In terms of per capita GDP, there is a wide spectrum ranging from $92 for Mozambique, $288 for India, $22,219 for U.S.A., $24,824 for Norway and $34,304 for Switzerland. Apart from this, they also differ in terms of economic characteristics, such as level of industrialisation, rate of economic growth, etc. From Fig. la, it appears that per capita energy use increases with higher incomes at a higher rate than the linear growth. There are only small differences in per capita energy between the developing countries. For most Asian countries, barring Japan, the per capita energy consumption is less than 1 toe (Fig. I b). For high income countries, the differences in energy use per capita are larger.
For example, the difference between the U.S.A. and France or Japan is a factor of two. Among industrialised countries, Spain and Italy have relatively low per capita energy consumption. Further disaggregation of source wise data shows that Japan, Sweden and Switzerland have a high share of primary electricity, in the order of 90-96%, which contributes to the high energy use per capita and per GDP. Other factors explaining the difference between countries include industrial composition, end use efficiencies and geography. It is essential to include these factors in accounting for per capita energy consumption, otherwise cross country comparisons of aggregate measures such as energy use per capita or energy intensities could be misleading. Karnataka has a figure of 0.180 (Per Capita Energy Consumption), while for India, it is 0.231 during the year 1990-91. This illustrates that Karnataka State has very low energy/capita and GDP/capita values, but these do not reveal the true state of energy use; one would like to know how the energy is used and what the level of efficiency is. Normally, it is said that, since our energy use/person is very low compared to that for advanced countries, we should increase our energy production so as to reach the level of "advanced" societies. It is wrongly assumed that energy/capita reflects a true state of development in a country. If this argument is accepted, then we should increase energy consumption rates in our country and our state.
The energy analysis is carried out by incorporating non-commercial energy sources in computing Per Capita Energy Consumption, which constitutes the significant portion in total energy consumption in countries like India, Nigeria, etc. By incorporating non-commercial sources of energy in the total energy, the per capita energy consumption for Karnataka becomes 0.260, while for India it is 0.266. The Per Capita Energy Consumption computed by including non-commercial energy sources is given in parentheses in Table la.
Recently, there has been a shift in the thinking, even in the industrial nations. The index to be used is not energy/person, but energy/GOP, i.e. the amount of energy consumed for producing I unit of GOP. This index is given in column 7 of Table I. This index also reflects the efficiency of energy use at a macro level. Column 6 gives the absolute values of energy/GOP in tons oil equivalent per million dollars. The values for Canada, 464.218, Norway, 365.896 and, the U.S.A., 352.041, are on the high side. Japan, France and Italy with values of 132.041, 182.634and 138.880, respectively, are on the low side. Although per capita energy use increases with higher GOP, Fig. Ic does not suggest or reflect that the energy intensity (energy consumption/GOP) of low income countries needs to be increased much with economic growth and development. Energy intensity is listed in column 6 of Table I, while column 7 presents a relative figure wherein energy/GOP is computed with the U.S.A. value equal to 100. India has an energy intensity value of 654.12 toe/million dollars and Karnataka State has a value of 696.729 toe/million dollars. With inclusion of the non-commercial energy share, India's energy intensity increases to 802.083, while for Karnataka, it is 754.89. Compared to the U.S.A., India consumes 2.25 times, compared to France, 4 times and Japan 6 times more energy for the same output. However, these calculations do not include animate energy share, such as human and animal energy. If these are quantified and included, then the energy/GOP for India would shoot up further.
During 1991, India's energy intensity was 838 toe/m$ compared to U.S.A.'s 344, Japan's 133 and Sweden's 172. This shows the increase in energy intensity for India while a decline for Japan, U.S.A. and Sweden. An explanation for the differences in energy intensities between these countries cannot be done based on this aggregate analysis. That would require each region/country's sectoral energy use, industrial composition, etc. This necessitates a detailed look at the energy scenario and energy auditing in energy intensive sectors to improve the efficiency of energy usage in order to bring down the energy intensity. Hence, the industry sector in Karnataka has been chosen for detailed analyses.
Karnataka is on the very low side as far as energy/capita is concerned. Let us look at the picture for energy/SOP (State Domestic Product). Karnataka State has an energy consumption/SOP value of 694.729toe/million dollars for the year 1990-91. This means that we are consuming more energy for less output. For a relative picture, column 7 of Table I is computed. Here, the energy/GOP is calculated with the U.S. value equal to 100. Coupled with column 7, we see that Karnataka has an index of 197.91 for the year 1990-91. This means that we are consuming 1.98 times the energy consumed by the U.S. for the same output. When compared with Switzerland, Japan and Italy, we consume 6.13, 5.28 and 5.02, respectively, times the energy consumed by them for the same output. This energy consumption does not include human/animal energy. If these are also included, then the energy/SOP value will be higher (ours is more of an employment oriented society still).
The second factor seen is that the energy/SOP is increasing for Karnataka. One possible conclusion is that the energy efficiency (of use) is decreasing and not increasing. Post oil crisis situations saw considerable reductions in energy/GOP. For instance, West Germany showed a decrease from 1,080 to 1,010; similar decreases were evident for the U.K. and the Netherlands. The United States has shown a steady value for a period of nearly 20 years (1961-74), varying from 1,400to 1,480 (a max. of 5% difference), whereas Karnataka has shown an increase of about 10% in 5 years. Hence, it is desirable to actively pursue the introduction of energy efficient methods. The reasons why the U.S. has a flat curve for the 15 years period may be: frequent updating of technology; efficient methods due to competition; stability in the system due to many years of energy use; and saturation (?).
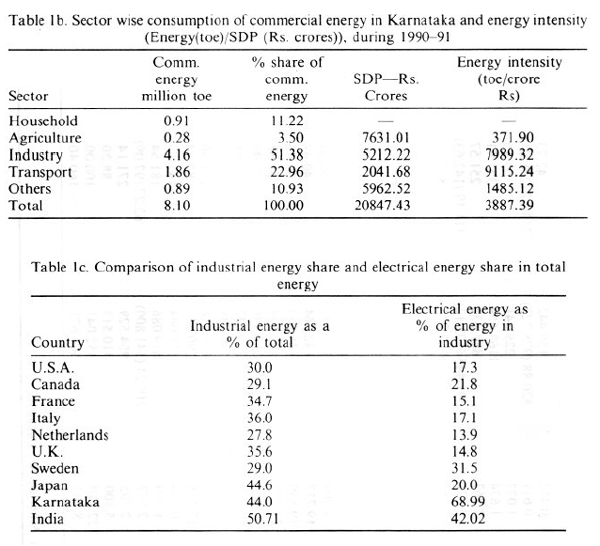
In order to see which sector consumes more energy in Karnataka, sector wise GOP and energy have been calculated. These are presented in Table Ib and Fig. 2 for Karnataka. The index here is the energy consumption in tons of oil equivalent per crore rupees of the sector's contribution to SOP. The value for agriculture is very low-371.90, whereas the value for transport is very high-9115.24. The industrial sector has an energy/SDP value of 7989.32 fro 1990-91. Since the industrial sector has a mix of many sources and devices, and also has a higher index, it was chosen for further comparison.

Another factor in the selection of the industrial sector is the fact that it is one of the major
consumers of electricity-a high quality energy source. More than 44% of the total electrical energy
is consumed by industries. Table lc illustrates this phenomenon. The percentage of the total energy
which is industrial energy is given in this table. As can be seen from this table, whereas many
countries consume about 30% of their energy for industrial purposes, we consume 44% and Japan
44.6%. The quantity of electrical energy consumed by industries as a percentage of total industrial
energy is also reflected in the table. Even countries like the U.S., U.K., West Germany, France,
etc. resort to electrical energy for a smaller fraction of their requirements, about 15-17%, whereas
the share of electrical energy in Karnataka's industrial energy needs is about 70%. This is despite
power cuts for the past many years. Since electrical energy is a derived secondary energy source,
it is inefficient for low quality work-like low temperature or medium temperature heatingapplications.
Electrical energy is efficient for lighting and static movement applications. As can be
shown later, electrical energy finds a lot of use in heating applications in many industries in
Karnataka, not because it is efficient, but because it is convenient and less expensive than other
fuels.
Efficient use of energy implies proper pricing strategies. Subsidies to industries on the tariff or fuel charges or low tariffs result in larger waste of energy in addition to lower direct costs of production. The electricity tariff for Karnataka is the cheapest (second only to the U.S.). Many other countries, like West Germany, U.K. and France have tariffs which are more than twice our rate. One cannot say more on this, because it also depends on income levels. One point deserves mention here, with low costs of energy charges, labour and raw materials, many of our industrial products-engineering, chemical, etc., should be highly competitive in international markets, but it is not so, one of the factors may be inefficient use of energy.
So far, we have seen comparisons of our energy usage with that of some industrialised countries. Let us look at the energy scene in India and Karnataka.
| 2. ENERGY SOURCES AND BALANCES |
Various energy resources, considered in this paper, are generally classified into three broad categories as:
Conservation in one sense, could also be considered an energy 'resource' because using energy more efficiently produces the same work with less fuel.
2.1. India's energy scene
The supply of primary sources of commercial energy in the last two decades is tabulated in Table 2. As seen in Table 2, coal is the predominant energy source (58.39%), followed by oil (27.18%), natural gas (7.61%), lignite (3.71%), hydro power (2.84%) and nuclear power (0.27%). The growth in commercial energy consumption for the period 1980-81-1989-90 is shown in Fig. 3. Non-commercial sources, such as fuelwood, agricultural residues and animal wastes, account for more than 50% in the total energy consumption. Non-commercial energy consumption is estimated to be 143 million toe (69.55% in total energy scene) for 1972-73 and 161 million toe (59.47%) for 1982-83. A major portion of these non-commercial energy sources is used in rural areas for activities such as cooking, water heating and in industries.
Coal is a major commercial fuel source, constituting 58.39% of total consumption, of which 56.96% is available in the country and the balance of 1.43% is imported. Coal, historically, was available in all industrialised countries and probably used inefficiently. Thus, the greater the share of coal in total energy consumption, the less energy consumption is added per unit of increased GDP, as there is room for increased efficiency of energy utilisation. It is inversely related to the elasticities. Hydro-electricity, on the other hand, is usually inexpensive wherever it is available, and therefore the greater the share in energy consumption, the greater would be the income elasticity.


Table 3 shows the pattern of commercial energy consumption in India since 1980-81. The industry sector is one of the major consumers of commercial energy with a major share of 50.70% out of the total commercial energy (119.29 mtoe). Sector wise consumption of commercial energy in the last ten years is depicted in Fig. 3 The industrial share during 1991-92 is 66.65 mtoe (51%). This is followed by the transport sector with a share of 22.85%. The transport sector depends mainly on oil. It is seenthat the useof petrol productsincreasedfrom 12.62mtoe (43%)in 1980-81 to 25 mtoe (48%) in 1991-92. The agricultural and residential sectors role in commercial energy consumption is very minimal. However. if non-commercial sources are also taken into account, there would be a dramatic change in the sectoral shares of total energy consumption.
The electricity consumption in India had a compound annual growth rate of 10% during the period 1950 to 1991-92, and the per capita consumption was about 253 kWh in 1990-91. The agriculture and domestic sectors have shown an increasing trend in the last four decades. Energisation of pumpsets in rural areas and subsidised electricity has led to the steep increase in electricity consumption in the agriculture sector from 7% in 1965-66 to 28.2% in 1991-92. Increased use of electric appliances and increasing urbanisation has shown a compound growth rate of about 10% a year in the domestic sector. The commercial sector, comprising of offices, hotels, etc., accounts for 5-6% of total electricity consumption. In the transport sector, the railways constitute the major consumer with consumption of 372 million kWh in 1970-71 and 4658 million kWh in 1991-92, showing a growth of 15% and accounting for 2.3% of the total electricity

consumption. Power shortages and poor quality of supply has made the industrial sector dependent more on captive power generation.
During 1991-92, peak and energy shortages in India were 17.7% and 8.5%, respectively. With proper conservation measures and an integrated energy planning approach, these shortages could be reduced. Conservation measures include improvement of efficiencies of end use devices in all sectors, improvement of plant load factor in thermal power stations by improving the coal processing facilities and improvement of a properly trained work force. Paucity of funds in the power sector to implement conservation measures could be managed with proper restructuring the tariffs in line with the cost of power generation and supply.
2.2. Energy planning
Currently, energy planning in our country is not an integrated activity. Since there are many energy sources and end uses, there are many organisations and agencies that deal with different aspects of energy. The plans for electricity, coal, oil and fuelwood are made by respective organisations mainly based on the projection of energy demand. The primary goal of this approach is for energy supply expansions on the assumption that there is a correlation between energy use and gross domestic product. With this approach, energy becomes an end in itself, and the focus shifts on meeting increased energy consumption through energy supply expansion alone. This supply and demand based planning approach for each individual energy form has resulted in problems like more losses, more conversions and low efficiencies. This is evident from the disappearance Of forests, village wood lots, roadside trees, construction of giant hydro electric dams, fossil fuel based power plants and controversial nuclear plants. This conflict between the energy demand and environmental quality goals can be solved by having an integrated approach to the problem of energy planning with a view to minimise consumption of non-renewable resources of energy, to maximise efficiency of energy usage and to harness renewable sources of energy in an ecologically sound way. Another aspect that has to be considered in the planning process is that of matching energy resources and end uses. Because of convenience, the current usage of high quality energy such as electricity for low quality activities like bath water heating, is to be discouraged. Hence, strategies for integrated energy planning should include (a) improvements in efficiencies of end use devices and/or conversion equipments, (b) optimising energy source--end use matching, (c) an organised approach towards optimal use of renewable resources, (d) proper exploitation of biomass energy resources and (e) discourage use of depletable resources (by penalising).
Our earlier studies give vast scope for energy conservation in the energy sectors. Highlights of these studies are: (I) domestic sector in rural areas shows that there is scope for savings of 42% in the quantity of fuelwood used by switching over from traditional stoves to improved stoves; (2) in electro metallurgical industry, efficiencies of 14% in welding sets, 10.4% in furnaces, 24% in cranes and 36.5% in diesel engines show vast possibility for improvement in end use efficiencies in all sectors; (3) energy analyses carried out for the food processing sector revealed that most of the industries are utilising less than 50% of installed production capacity. The low power factor when a motor is under loaded leads to inefficiency. It is estimated that 23-38% of the energy could be saved at improved efficiency due to full utilisation of installed production capacity; (4) usage of solar water heaters, especially for bathing water heating could bring down electricity consumption in urban areas and fuelwood consumption in rural areas; (5) harnessing hydro potential in ecologically sound way by means of mini/micro/small hydro potential in hilly districts. It is estimated that about 1250 million units per year could be generated in the Bedthi and Aghnashini river catchments alone in the Uttara Kannada District and (6) harnessing solar energy in coastal regions. Our estimate shows that, in coastal taluks like Kumta, Karwar, Honnavar and Bhatkal in the Uttara Kannada District of Karnataka State, there is potential of 5.5 kWh/m2 (based on mean daily insolation).
| 3. KARNATAKA STATE: LOCATION AND DEMOGRAPHY DETAILS |
Karnataka State extends over an area of 1.92 lakh sq. kms, it occupies about 5.84% of the total geographical area of the country. The state is situated in the West-Central part of the Deccan Peninsula of the Indian union and is stretched between 13° 3' and 18°45' north latitudes and 74° 12' and 78° 40' east longitudes. The major portion of Karnataka lies in the elevation range between 450 and 900 metres above mean sea level. With a population of 4,49,77,201, it accounts for 5.4% of the country's population. For administrative purpose, the state has been divided into divisions, districts and taluks. There are 27,024 villages spread over 175 taluks. 69.07% of the population resides in rural areas (31,069,413 people).
3.1. Karnataka's energy scene
Karnataka does not have any coal deposits. It gets its coal from outside. The electrical energy for Karnataka was purely hydro, and with the commissioning of Raichur thermal power station, it gets electrical energy from coal also. The other major source of commercial energy-oil-is also not available in Karnataka. Hence, the main source of commercial energy for the state comes from hydroelectric plants.
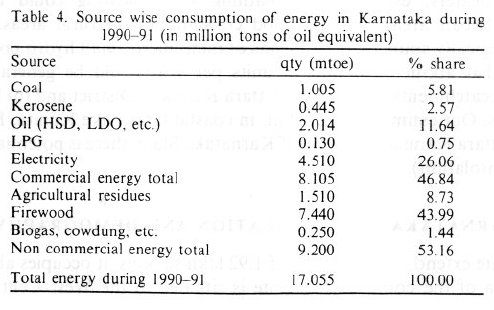
Karnataka State depends both on commercial and non-commercial forms of energy. Non-commercial energy constitutes 53.2%, met mainly by sources like firewood, agricultural residues, charcoal and cowdung, while commercial energy's share is 46.8%, met mainly by electricity, oil, coal, etc. Table 4 lists the source wise consumption of energy during the year 1990-91. This data is compiled from various agencies: Karnataka Electricity Board, Directorate of Economics and Statistics, Planning Department, Forest Department and Agriculture Department. As noticed in Table 4, commercial energy sources like coal, oil and electricity provide only a small part of the energy scene of Karnataka. The major energy share comes from firewood. Electricity represents 55.67% of commercial energy for 1990-91. There has been an increase in the per cent share for electricity in the last 10years. Firewood consumption is around 7.44 million tons of oil equivalent. Agro wastes are also used for energy purposes. Figure 4a and b are pictorial presentations of source wise consumption. From Fig. 4b, it is seen that firewood constitutes 43.0%, while electricity is 26.1%, followed by oil (11.6%) and agricultural residues (8.7%). This demonstrates that we depend mainly on biomass to meet our energy needs. Figure 4c illustrates the sector wise consumption of commercial energy in Karnataka during 1990-91. This shows that the industrial sector, with 51.4% share, constitutes the major consumer of commercial energy, followed by the transport sector (23.0%), household (11.2%) and agriculture (3.5%). Hence, we focus our attention on the industrial sector to carry out a detailed investigation to see the extent of savings possible.
3.2. Industries in Karnataka
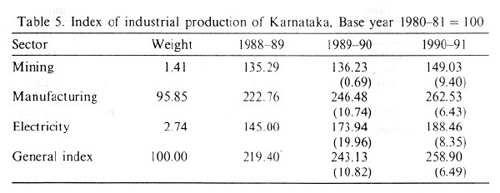
Industry is playing a pivotal role in the development of Karnataka State. The secondary sector in the state accounts for nearly a quarter of the state income in real terms of the total output in the economy. The average annual growth rate of industrial production over the period from 1981-82 to 1990-91 is about 6.4%, as against 7.9% in the country, as reflected in the index of industrial production. The sector wise indices for the years 1989-90 to 1990-91 are furnished in Table 5.
Sector wise analysis for the period 1981-82 to 1990-91 shows that the highest growth rate of 6.41% was recorded in the manufacturing sector, followed by the electrical sector (5.99%) and mining sector (4.90%). The total industrial performance is indicated by the general index of industrial production.
3.3. Electrical energy use in Karnataka
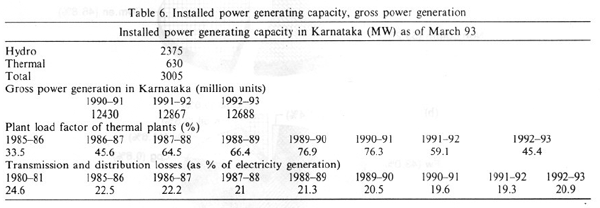
The share of industries in total electrical energy consumption is around 44%. The state generated 12,430 million units of electrical energy in 1990-91 and 12,887 million units during 1991-92. The share of industries in electricity consumption is 4,482 million units in 1990-91 and 4,316 million units in 1991-92. The installed power generating capacity, gross power generation and transmission and distribution losses are listed in Table 6. Transmission and distribution losses during 1991-92 are about 19.32%. Table 7 lists the electric energy requirement and available data compiled from the Karnataka Electricity Board. For the last six years, there is a deficit of electrical energy of the order of 26.88% during 1988-89, 23.57% during 1989-90,22.90% during 1990-91, and 23.59% during 1991-92. Figure 5a gives a pictorial representation of the energy available and requirement in Karnataka, while Fig. 5b illustrates the surplus or deficit in availability of electrical energy. It is seen that, during 1988, the deficit is a maximum.
Sector wise electric energy consumption is listed in Table 8. During 1989-90, the industrial sector consumed 4,780 million units, constituting a share of 44.86%, followed by irrigation pump sets with a share of 28.63%. It is seen that the share of irrigation pumpsets is gradually increasing. 8.82% of pumpset energised through 1991-92 is already guzzling 36.26% of the total electrical energy. This is followed by industries with a share of 34.34%. Figure 6a and b gives the sector wise electrical energy consumption for the years 1989-90 and 1991-92.
Since electrical energy is an important component of energy for industrial consumption and as it is a high quality energy, the sectoral and spatial analysis of electrical energy is considered next. The analysis in the next section looks from the supply end. Another analysis follows from the consumer end, based on the sample surveys. Figure 6a illustrates the sector wise consumption of electrical energy during 1989-90. It is seen that the industrial sector is 44.9%, followed by agriculture (28.6%) and domestic households (15.5%). Figure 6b illustrates the rise in share of the agriculture sector in the electrical energy scene during 1991-92. The share has increased to 36.3% in 1991-92 from 28.6% (during 1989-90). The industrial share is 34.3%, followed by the domestic sector (15.3%).
3.4. Electrical energy utilisation in industries in Karnataka
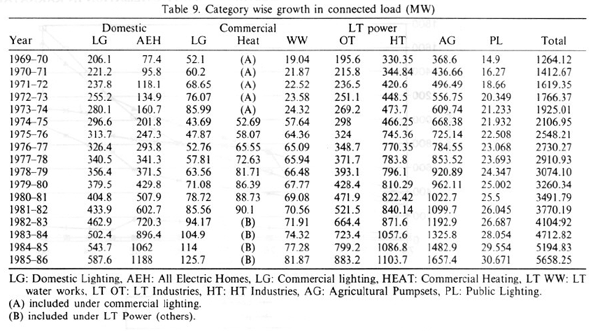
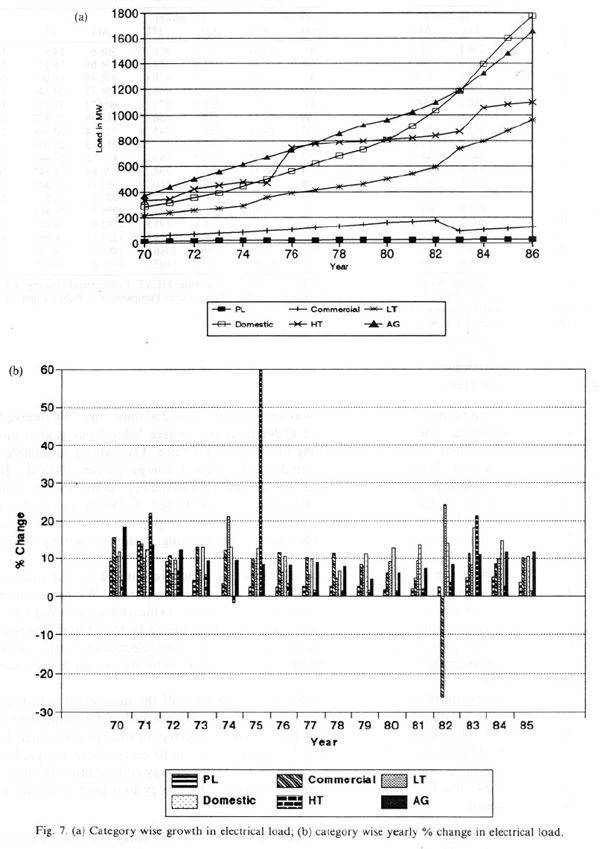
Connected loads of the installations and energy consumption details in various sectors are the indices normally used to see the growth of electrical energy. A look at these indices indicates the primary users and not how they use energy. Table 9 illustrates the profile of connected load from 1969-70 to 1985-86 in various sectors. The annual increase for the year 1985-86, is greatest for agricultural pumpsets (11.9%), followed by AEH consumers (11.86%) and LT installations (10.5%). When we look at the increase for the three years from 1980-81 to 1985-86, the connected load AEH category grows faster (57.2%) than that of LT industries (46.5%). HT industries show a small growth rate. The overall annual growth rate is only 8.9%. AEH, LT and agricultural installations have growth rates greater than the overall growth rate. In the case of 1980-81 to 1985-86 growth rate, AEH and LT industries and the agricultural sector have greater increases than the overall values. This is shown pictorially in Fig. 7a. Category wise, the yearly percentage change in connected electrical load is illustrated in Fig. 7b.

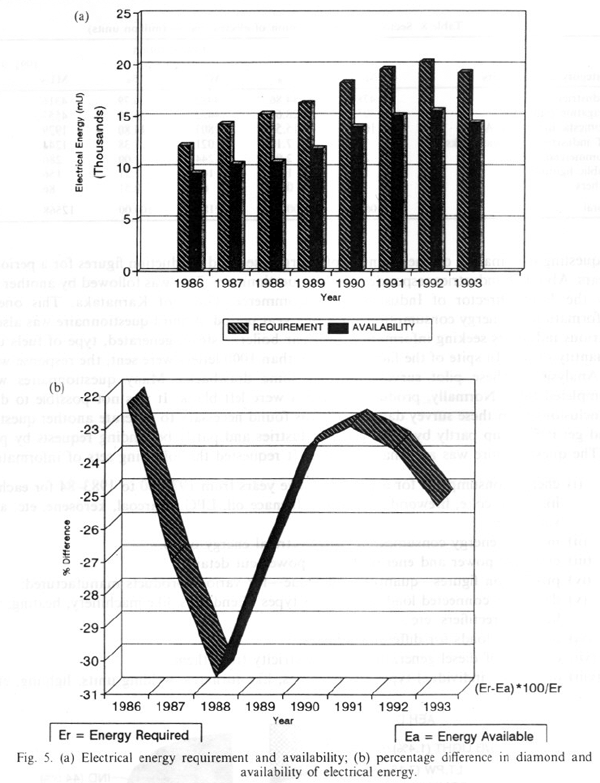
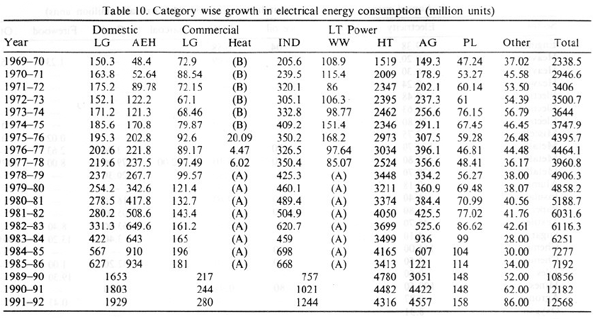
Table 10 gives the sector wise annual consumption of electrical energy in various sectors. During 1989-90, the industrial sector leads other sectors in electrical energy consumption with a share of 44.88%, followed by irrigation pumpsets (28.63%).
| 4. ENERGY SURVEY OF INDUSTRIES |
Since the data available with various agencies dealt with only one aspect of energy use, it becomes necessary to collect data directly from the industries. This can be seen from the discussions in the last section. We concentrated on electricity and, that too, from the supplier's end. To understand the types of fuels used and production, we needed to conduct a survey, as this type of data was not available or accessible. Hence, we decided to conduct a survey of about 250 industries.
Since the survey was done for the first time, we went about it in many stages with help from many authorities like the Director of Industries and Commerce, Govt. of Karnataka, and the Chief Inspector and first questionnaire prepared by us was a simple one

requesting information on the quantity of energy used and production figures for a period of two years. About 80 industries responded to this questionnaire. This was followed by another one sent. by the Joint Director of Industries and Commerce, Govt. of Karnataka. This one sought information on energy consumption for a one year period. A third questionnaire was also sent to various industries seeking information on their boilers-steam generated, type of fuels used and quantity of use. In spite of the fact that more than 1000 letters were sent, the response was poor. Analysis of these pilot surveys showed some drawbacks. Many questionnaires were not completed fully. Normally, production figures were left blank. It was not possible to draw any conclusions from these survey data. So, it was found necessary to generate another questionnaire and get it filled up partly by visiting the industries and partly be sending requests by post.
The questionnaire was an exhaustive one. It requested the following sets of information:
(i) energy consumption for a period of five years from 1979-80 to 1983-84 for each source,
like coal, coke, firewood, electricity, furnace oil, LPG, charcoal, kerosene. etc. and their
values;
(ii) monthly energy consumption (for electrical energy only);
(iii) electrical power and energy details, power cut details;
(iv) production figures-quantity and value-for various products manufactured;
(v) details on connected load for various types of end uses, like machinery, heating, welding,
lighting, rectifiers, etc.;
(vi) details of loads for different sections;
(vii) capacity of diesel generating sets; electricity from them;
(viii) details for individual types of machines, like furnaces, welding units, lighting, etc.;
(ix) conversions;
(x) future plans.

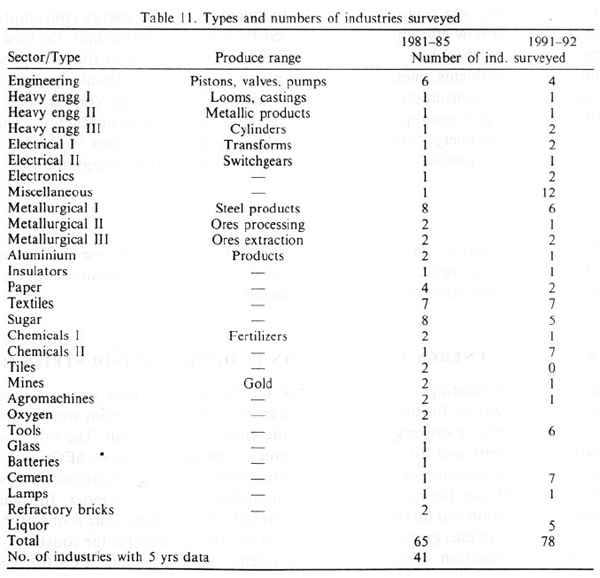
This questionnaire, numbering 16 pages, was sent to more than 250 industries. We received replies from 41 industries. These industries have understood the motive behind our studies and spent considerable amount of their time in filling in this questionnaire. They are of invaluable help to us in our analysis. Despite repeated reminders, the biggest energy guzzler INDAL, Belgaum (aluminium company) did not respond to any of our questionnaires---either to the earliest two simpler ones or to the detailed one. Recently, we conducted a fourth survey by sending questionnaires to 510 industries. About 82 industries promptly responded, out of these 78 industries filled in the questionnaire completely. This shows the growing awareness among industries in Karnataka.
Table II gives the details of the type of industries which responded to our questionnaire. Fortunately, we got a wide canvas of industry types in these responses. We have a number of industries for the groups of engineering, metallurgical, paper, textile and sugar industries. Except for the aluminium producer, all other major industrial types are to be found in the response. The types also include glass, batteries, watches, oxygen, fertilizers, steel, electronics, tools, tiles, cement, and heavy engineering units. Hence, the results will display information on a wide variety of industry types.
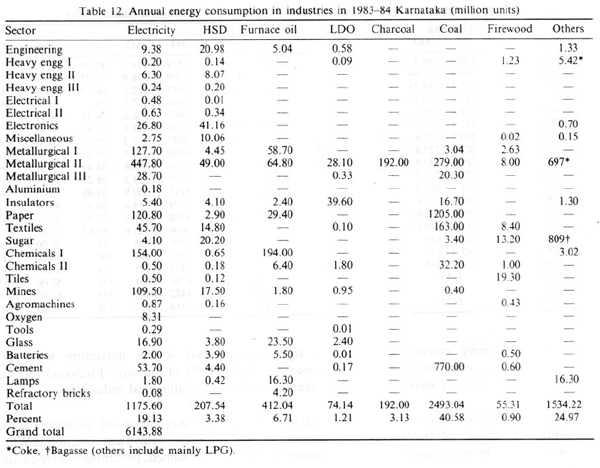
The questionnaire (third survey during 85-86) for nearly half the number of industries which responded were filled up by personally visiting the industries concerned and eliciting their answers to our queries. This involved a number of trips to each industry on timings convenient to them. This process entailed an effort of 4-5 months. Data pertaining to energy were analyzed, and the results are presented in a series of tables. Table 12 shows the energy consumption by these groups during 1983-84. The following points deserve mention. The energy unit used is million kilowatt hours equivalent.
(i) Total energy consumed by these industries works out to nearly 6.0 million tons of coal
equivalent. This means that we have covered more than 80% of the energy consumed in
industries.
(ii) The electrical energy component is only 1,198 million units. This is less than 50% of the
total electrical energy consumed in the state. As already stated, the unavoidable exclusion
due to the non-availability of one aluminium industry has a sizable effect on the total
electrical energy. This is because this industry alone consumes about 20% of the total
electrical energy for industries in Karnataka. Similarly, JINDAL (an aluminium company
at Bangalore) also refused to give us information pertaining to their energy use and
production, despite personal visits.
(iii) Fortunately, there is a balance in the industries consuming different types of fuels. For
example, the paper, textile and cement industries use coal as their primary fuel; the sugar
industries consume mainly bagasse; the metallurgical industries use coke and charcoal; the
chemicals and metallurgical industries use furnace oil; electricity and diesel are used by most
industries.
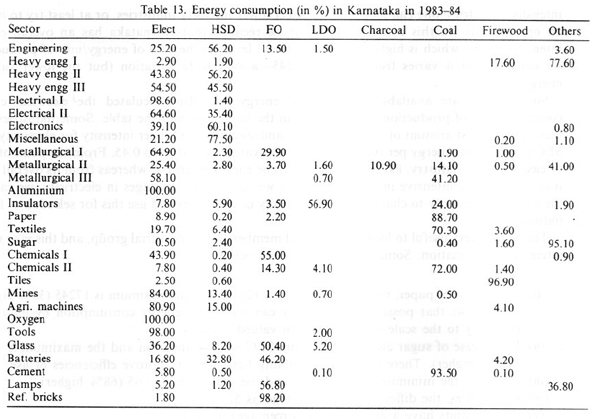
(iv) Electricity constitutes 19.4% of total energy; coal is the maximum with 40.4%, others coke, bagasse, LPG and kerosene-form 24.9% of the total. Firewood use is quite small, mainly restricted to sugar, textiles, tiles and metallurgical industries. Since absolute energy consumption patterns do not provide any indication, we used a standard unit and calculated the energy consumption in million units equivalent (million kWh). To understand the significance of the predominant type of fuels consumed, percentages were calculated
as in Table 13. The next stage of analysis is to calculate specific energy consumptions. It is our
desire to know (a) how efficiently energy is used by a manufacturing unit, (b) how the efficiency
changes with time and (c) how it compares among units manufacturing the same product. In order
to look at these problems, energy consumption/unit of production should be calculated. We call
this specific energy consumption. Two indices are possible-energy consumption per rupee of
production or energy consumption per unit of production or ton of production. The next section
looks at the specific energy consumptions for different industries, their variations with time for
some industries and relative figures for total energy and electrical energy uses.
SEC = E,/P,
where E, = total energy consumption in the period" (" (in this case" (" is one year) and
P, = production in the period "(". From a knowledge of SEC, the minimum energy required to
operate the industries efficiently could be predicted.
| 5. SPECIFIC ENERGY CONSUMPTION IN DIFFERENT INDUSTRIES (1983-84) |
The study of evaluating various industries on the basis of their energy consumption and production is being done for the first time in the country. One of our main aims in doing this study is to generate norms or existing levels of specific energy consumption. The other aims are (i) to compare similar units and (ii) to see the dynamics-change with time-SEe for an industry.
Since energy consumption by an industry is an absolute quantity, it cannot be used as an index for comparison. Hence, the specific energy consumption is used as an index. In India, there is no integrated study conducted on the SEC for various industrial sectors. Ours is one of the first studies involving all forms of energy sources. There are no norms available for the consumption of electric energy/unit of production. Hence, one of our intentions is to obtain SECs for some industrial groups. This can be a reference for future use and can also be used for comparison with international norms.
As already stated, SEC is defined as energy per unit of production or energy per rupee of production. It has been calculated for all the industries who responded to us, but the values are given only for a sample of this group in Table 14. For some groups, energy per rupee is available, and for others, energy/unit of production is available. The second category is shown by (*) in the table.
The energy consumed/rupeevaries from 0.011to 1.78.Table 14 lists for each sector 4 entries for SEe. The first value gives the average, the second one the maximum value calculated for an industry in that group, the third one the minimum value obtained for an industry in that group and the fourth the standard deviation. The average values vary from 0.22 to 1.73. The standard deviation gives an indication of the variations in SEe. One way of interpreting SEC is to assume that lower SEe's imply better efficiency because we consume less energy for the same amount of production. Looking at SECs for each industrial group can help us in Classifyingindustries as energy intensive or non-intensive. This will be useful in the selection of industries to be nurtured in the future in the state. Instead of concentrating on higher
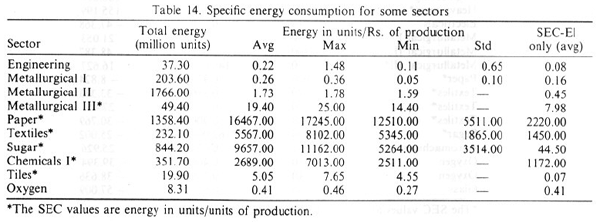
intensity industries, one can look for and select lower intensity industries, or at least try to obtain an optimal mix. In this connection, it may be recalled that Karnataka has an overall energy intensity of 1.96 which is higher than the national level. In the case of energy/unit of production, we can see that it varies from 4.55 to 17245-a very wide variation (but the lower value is energy/tile).
Since norms are available for electrical energy, we also calculated the electrical energy consumed/unit of production. This is given in the last column of the table. Some industries, like tiles, use the least amount of electrical energy and some have a higher intensity for electricity. The SEC for electrical energy per rupee of production varies from 0.08 to 0.45. From the point of view of electricity, an industry, like oxygen, has become energy intensive, whereas from its overall SEC, it is not a highly intensive industry. So, when we have acute shortages in electricity, we can use the SEC for electricity to characterise the intensity of industries and use this for selection of future industries.
The SEC is very useful to look at individual members in an industrial group, and this may reveal
interesting information. Some examples are cited below:
(i) In the case of paper, the minimum SEC is 12510 and the maximum is 17245 (38% higher).
This shows that possibly one industry can reduce its energy consumption by improving
efficiency to the scale of the minimum valued industry.
(ii) In the case of sugar also, the minimum SEC is 5264 units/ton and the maximum is 11162
(112% higher). There is a large possibility here also to improve efficiencies of use.
(iii) For tiles, the minimum value is 4.55 and the maximum is 7.65 (68% higher).
(iv) For textiles, the difference (in percentage) is 52%.
(v) Oxygen units have a difference (in percentage) of 70%.
The above illustrations show that there is a high probability of efficiencyenhancements. It is also possible that, in some situations, the difference in SEC is due to the quality of the product and not due to energy efficiencies, but wherever large differences occur for similar products, it is desirable to look deeper for the maladies.
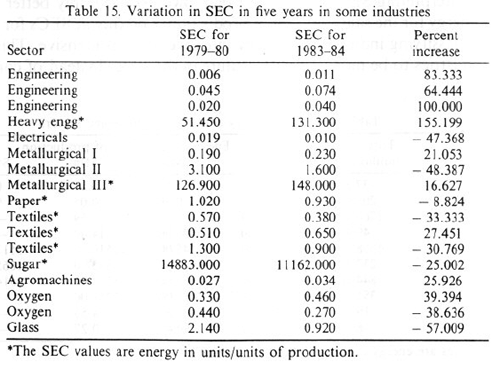
The inter-group variations in SEC may only show a probability of improvement. Actual improvements can be pin pointed only by a detailed study by the industry concerned. Since energy plays an important role in our life, it is desirable to do energy audits and energy budgeting. Many industries do not even have measurement facilities, but it is a very redeeming feature that many industries of Karnataka are aware of the energy shortages and energy-environment linkages. Some industries are already initiating steps for increasing the efficiencies of energy use. This can be seen from the study of variations in SEC for five years. Table 15 lists SECs for some typical industries
which show a change in their SECs. It does not show industrial groups, but an industry in a group,
the group identified by column 1. From this table, we can see that:
(i) The maximum increase is 155% between 1979 and 1984. The heavy engineering industry
should look at this degradation in its efficiency of energy use. The increase is gradual and
not sudden.
(ii) An engineering industry has also shown an increase of 100% in 5 years in SEe. This increase
is also gradual.
(iii) Surprisingly, many of these large increases have occurred in engineering industries. Another
reason for this increase may be substitution of fuels (like diesel for electricity generation
instead of KEB electricity).
(iv) There are some units (8 in number) which have shown a decrease in their SEC values. This
might mean (a) increases cost of the product due to demand or (b) better efficiency of use.
A look at the total energy consumed by each sector-shown in Table 14 col. 2.-reveals that the metallurgical iron and steel industries consume the maximum energy, followed by paper (1358.4 million units) and sugar (844.2 million units). Engineering units consume less energy.
We can see from the above that, even though general conclusions regarding energy efficiency and SEC can be drawn, we have to conduct deeper studies at the level of individual industries to confirm and pinpoint the lacunae.
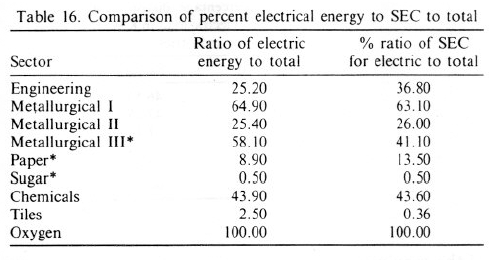
Table 16 tries to compare the difference between the ratio of electrical energy to total energy and the ratio of SEC for electrical energy to SEC for total energy. These two ratios should be the same if the industries in the group have similar consumption patterns and efficiencies.A difference (like in the case of paper or tiles or engineering groups) indicates uneven patterns.
The effect of power cuts is seen from Table 17. The energy generated by captive diesel sets was very small in 1979-80. The per cent ratio between self generation and purchased energy from the KEB was only 0.22; but this ratio has gone up to 17.28 in 1983-84. Since the cost of electricity from diesel generators is very expensive, of the order of 2 rupees, compared to electrical energy purchased from the KEB, this shows that the cost of energy is not an important criterion. In fact, lower costs result in wastage. Hence, planners should consider proper costing of energy, including replacement costs for generating stations, thereby doing away completely with subsidies. Subsidised energy may not result in lower manufacturing costs. It results definitely in decreased efficiencies and unnecessary use of energy. The same is the case with capacity. The self generation capacity
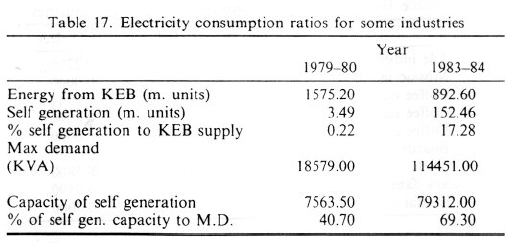
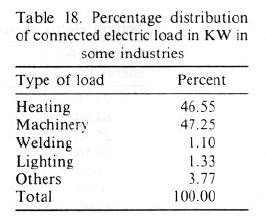
is equal to 69% of the maximum demand. Proper costing of energy will have benefits such as (a) energy conservation will increase, leading to greater energy conservation; and (b) the anomalous situation that exists now, like people installing diesel/kerosene/petrol generators and thereby paying higher costs for energy, will be alleviated, especially because capital can be generated for additional power plants. Electrical energy need not be used for heating activities. To a large extent, substitution of lower quality energy is desirable in all these cases. Such a substitution will not only match sources with end uses, but also increase the efficiency of use. This is true in other sectors also. Table 18 gives the energy consumption values as percentages. It shows that 46.55% of the eIectricalload is in the heating category. This reinforces the points mentioned above.
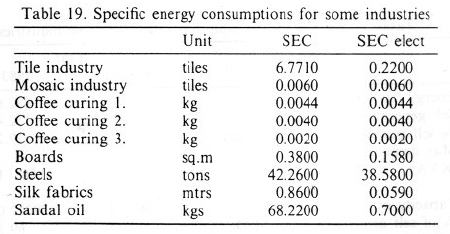
Table 19 gives the SECs for total energy and electricity for some industries [6], such as coffee curing, tiles, bricks manufacture, etc. In the case of coffee curing, the SEC varies from 0.002 to 0.0044, a variation of more than 100%. For tiles, the SEC is 6.771. This is between the minimum and the maximum values for SEC calculated in Table 14.
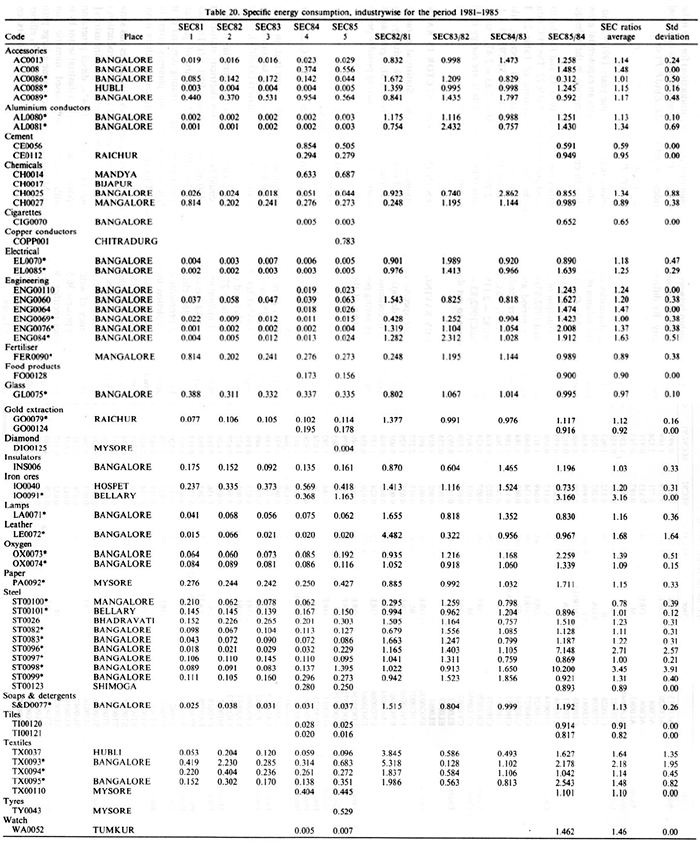
Detailed analyses carried out industry wise for various sectors for five years are listed in Table 20. The SEC ratios computed for two consecutive years reveal an increase in SEC in most industries. Ratios ofSECs for the years 1982 and 1981 are abbreviated as SEC82/81. This ratio being greater than one reveals the increase in inefficiency, while the ratio < 1 indicates (for cement, chemicals, food products, glass, tiles industries) improvement in energy usage per unit of production. The last two columns in this table give average values and standard deviation for these ratios. In most of the industries, the average of SEC ratios for five years is greater than one, meaning that the SEC of the industry is increasing.
6. SPECIFIC ENERGY CONSUMPTIONS IN DIFFERENT INDUSTRIES (1991/92 AND 1992/93) |
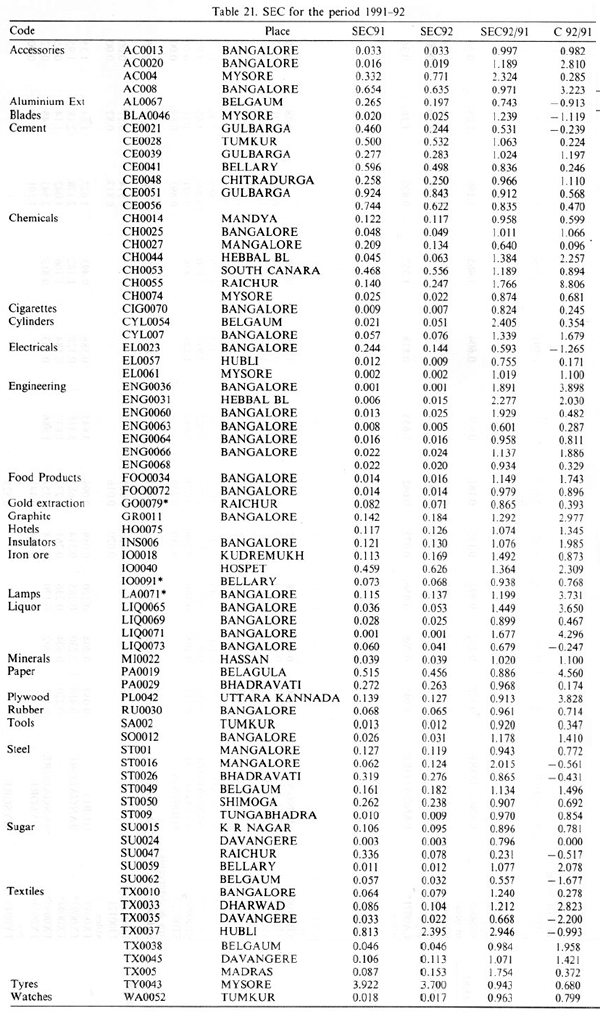
In order to see the change in the energy usage scene in the last 10years, a survey was undertaken in the industrial sector by sending questionnaires to 510 industries spread all over the state. About 40 industries responded initially, followed later by 38 more industries in response to a second letter. The specific energy consumptions computed for the years 1991and 1992 for various industries are listed in Table 21. The SEC ratios computed for 1992 and 1993 show marginal improvement in energy consumption in some industries, while for 35 industries, the SEC ratio is > 1.
| 7. ENERGY ELASTICITY |
The relationship between En (energy consumption) and Pr (production) for the industrial sector,
through regression analysis, is found to be En = A(Prf, the coefficient C is commonly known as
energy elasticity. By differentiating both sides, we get C = (dE/E)/(dP/P) or
C = {(E2/EI)- 1}/{
(P2/P1) - 1}
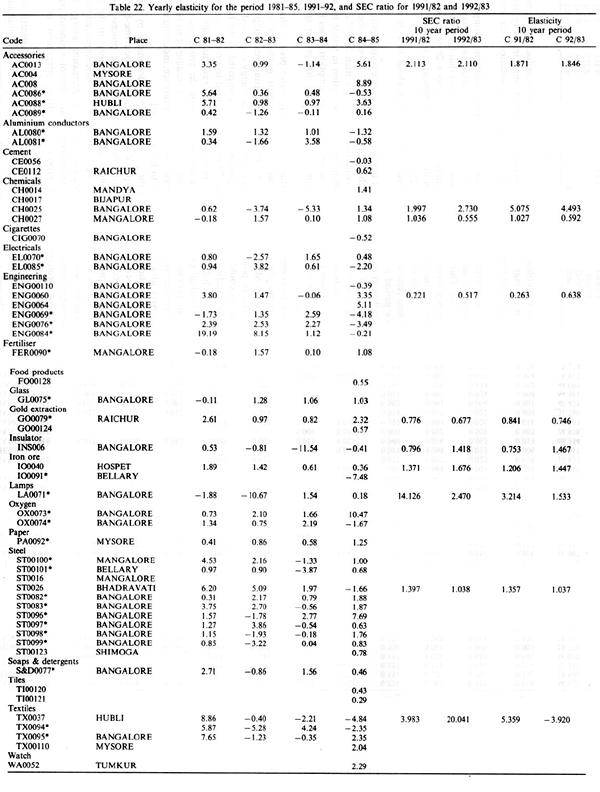
The energy elasticities computed for various industries for the years 1991/92 and 1992/93 are
listed in the last column of Table 21. The value of C > 1indicates an exponential growth in energy
consumption, while C < I indicates a decline in energy consumption in the subsequent year for
the same unit of production.
Yearly computation of the energy elasticities for the period 1980-85 and for the 10-year period (i.e. 1991/82and 1992/83) have been calculated and are listed in Table 22. The SEC ratios computed for a ten year period are also listed in the 7th and 8th columns of Table 22. These values substantiate earlier findings, that is most of the industries in sectors, like chemicals (SEC91/82 = 1.997, SEC92/83 = 2.73), iron ore (SEC9l/82 = 1.371, SEC92/83 = 1.676), accessories (SEC91/82 = 2.113, SEC 92/83 = 2.110), lamps (SEC92/83 = 2.47), steels (SECI991/ 82 = 1.397, SECI992/83 = 1.038) and textiles (SECI991/82 = 3.983), are energy inefficient. There is a lot of scope to cut down unnecessary energy consumption.
8. ENERGY SAVING POSSIBILITIES IN INDUSTRIAL SECTOR IN KARNATAKA |
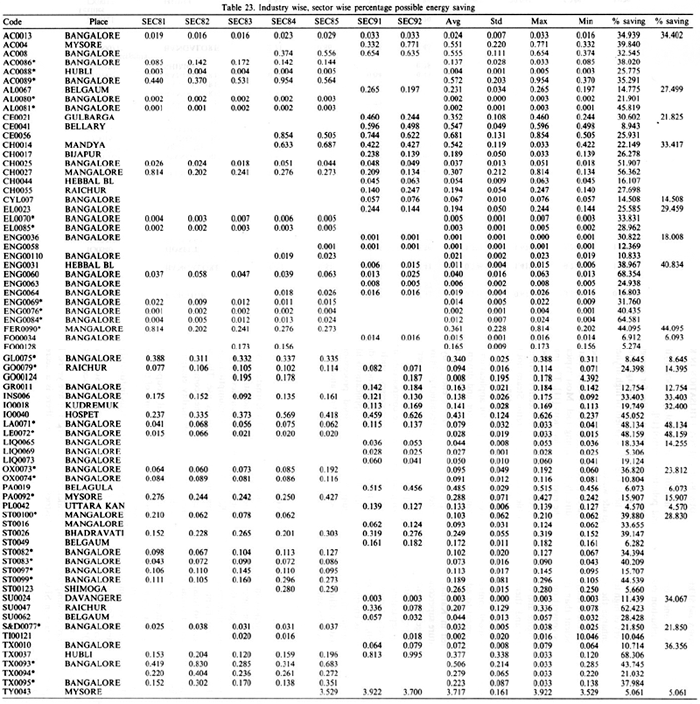
Table 23 lists specific energy consumptions for seven years. Statistical parameters, such as average, standard deviation and maximum and minimum SECs for each industry, based on 7-year data are listed in columns 10-13 in the table. The yearly variation in SEC gives an idea about the extent of energy saving possible in each industry. The percentage saving possible per industry, listed in the 14th column of the table, is given by
%Saving Possible = {[(SEC)avg - SEC(min)]* 100}/(SEC)avg,
where (SEC)avg= average SEC computed based on 7 years data and SEC(mi")= minimumSEC among 7 years.
The last column gives the savings possible in each sector. It is seen that, in the iron and steel industries, a 28.83% saving is possible, while there is vast scope for savings in sugar (34.07%), engineering (40.83%), textiles (36.36%), fertiliser (44.09%), insulators (33.40%), iron ore (32.40%), chemicals (33.42%) and cement (21.82%).
It is seen that about 27.72% of the energy could be saved in the industrial sector, which means that about 1541million units of electricity could be saved (as per electricity statistics, the industrial sector in Karnataka has consumed about 5560 million units during 1991-92). This saved electricity is equivalent to the electricity output of 300MW installed capacity of generating stations. Environmental problems associated with mega-projects, the increasing demand of states/country and resource depletion make it increasingly imperative that our planners divert their attention towards improving efficiency in all sectors. This research illustrates that there is ample scope to conserve energy in the industrial sector.
Our earlier studies in the food grain sector [7]among small scale industries has shown that about 55 million kWh could be saved by just optimal utilisation of installed production capacity.
A study of energy efficiencies of end use devices in electro-metallurgical industries [8] has shown that the efficiency of welding sets is about 14%, furnaces 10.4%, diesel generators 36.5% and electro-plating process 36.5%. This shows possible savings in the industrial sector by switching over to transformer-rectifier welding sets with microprocessor based numeric controller from conventional motor generator welding sets. Motors and drives consume a large percentage of the electrical energy used in the industrial sector. High efficiencymotors (85.5-95% efficiency)currently available in the market are now competitive with conventional types of motors, considering the cost of motor losses.
The advanced technologies discussed below promise significant reductions in energy use, and implementing these may be less costly compared to generating electricity through supply expansions, taking into consideration the environmental costs associated with new installations.
(i) Proper maintenance of electric motors in textile industries brings down energy consumption considerably; about 3% of power consumption can be saved by improved maintenance. This also reduced repairs as shown by the fact that burnout of motors varies in frequency from one in months for 10,000 spindles to 8-20 in three months for 10,000 spindles. The increase is 8-20 fold in the second case. Similarly, burnout frequency varies from 1-7 to 60 for six months for 25,000 spindles.
(ii) Waste heat recovery in boilers can reduce energy use by about 10%. It is shown that the payback period is a few months.
(iii) Use of polyester cotton tapes, etc. in textile mills will reduce consumption by about 10%.
(iv) Replacement of old boilers with high efficiency boilers and introduction of turbines and generators can reduce total energy requirements by more than 20--30%.
(v) Spindle speed is an important factor in energy consumption in textile industries. Proper speed can reduce energy use. In the survey, energy consumption varies from 60 to 165% (with the base of 100 chosen for one mill). This shows that proper speeds can reduce consumption.
(vi) Advanced processes in the steel industry are mostly major process changes that could revolutionalise, the iron and steel sector. The plassmelt method [9] involves smelting partially reduced iron powder with pulverised coal by using heat supplied by a plasma system. Ore to powder steel making could reduce the energy consumed by 40%. Direct steel making could double or triple production rates compared to the blast furnace and offer a 30% reduction in energy use. The energy required to produce steel from scrap is less than one-half that required to produce steel from raw materials. However, scrap contains residual elements that have adverse effects on the properties of the steel. The electric arc furnace is a well established technology, and because of its increasing market share, improvements such as scrap preheating, DC arc furnace, induction melting, heat and dust recovery and ladle refining are to be researched.
(vii) Conventional chemical pulping in the paper industry is dominated by the very energy intensive kraft process. The energy required to recycle paper is about one-half that required by the kraft process. Desired improvements in the recycling process concentrate on improving the process to remove colour and filler. Improvements in the paper making process focus on improved process control, process physics and improved materials. These improvements would have a substantial effect on decreasing energy consumption. Bio-pulping, chemical pulping with fermentation, and ethanol organosol pulping are the most recent promising advanced processes involving integration of at least one fermentation process with a conventional pulping process.
(viii) Carbothermic reduction of aluminium ore or alumina has the potential for substantial energy savings. Aluminium trichloride electrolysis allows for more production per unit cell volume. The permanent anode design would decrease the frequency of anode replacements and the wetted cathode might enable a reduction in the distance between the electrodes associated with a high voltage loss without a loss in current efficiency.
(ix) Catalysts are used in many industries to produce chemical reactions at a lower pressure and temperature, thereby using the less energy. Better understanding of the basic mechanisms of catalysts may lead to new classes of catalysts. These could be beneficial in
the areas of one-step conversion of methane to methanol, photocatalytic reduction of water, combustion enhancement, and pollution control [10].
(x) Recovery and reuse of water heat offers significant opportunities for energy conservation. The development of cost effective heat exchanger and thermal storage units is needed for the recovery of high temperature reject heat. The development of high lift heat pumps could greatly enhance the utility of low grade waste heat.
(xi) Cogeneration is the simultaneous production of process heat and electric power. Providing moderate or low temperature heat as a by product of the work from a heat engine is much more efficient than providing heat directly by burning fuel. Most typical cogeneration industries convert only 10-15% of the energy into electricity [11]. The intercooled steam injected gas turbine[12], a new technology, is being developed which incorporates a modern aircraft engine and can accommodate variable amounts of steam returned to the turbine combustor and, therefore, has a flexible electricity-heat ratio. Steam not returned to the turbine is used for process heat. With full steam injection, 40% of the energy can be converted into electricity.
(xii) Variable speed controls for motors are currently available for application on existing and new equipment to adjust the speed control so that the motor and driven equipment can match the requirement of the process. Motors account for about 55% of the electric energy consumed in Karnataka State. The potential for conserving energy by applying high temperature superconductors [13] in place of conventional conductors in industrial motors is very large. The advantages include reduced volume and mass, higher power density, enhanced performance and improved operating efficiency.
(xiii) Industrial separation processes involving separation of the components in a mixture are highly energy intensive. Advancement of alternative processes, such as membrane separation, solvent extraction, critical fluid extraction and advanced drying concepts, promise less energy intensity. This could be beneficial to applications like black liquor concentration in the paper and pulp industry, hot food processing waste water concentration, dilute soluble food process stream concentration and drying of products, such as textiles and paper [14].
| CONCLUSIONS |
I. Even though energy consumption/capita is low, energy/SOP for Karnataka is quite high. This
is true specially for the industrial sector. The energy/SOP for the industrial sector in Karnataka
is 10-20 times higher than that for some of the industrialised countries. This shows that there
is great room for improvement of the efficiencies in energy consumptions in our industries.
2. Electrical energy forms a major component in industrial energy use. The per cent ratio of
electrical energy to total energy is also higher for Karnataka when compared with the index
for industrialised countries. Electrical energy, being a high quality energy involving more
energy conversions, should be used in high quality work.
3. Energy consumption per rupee of production for various industrial groups has been calculated.
These will serve as indicators for industries in the same group. Some of these, when compared
with international norms, look quite high.
4. Electrical energy consumption per rupee of production for various industrial groups has also
been evaluated. This can again be used as an indicator.
5. The specific energy consumption within a group varies very widely-in some cases, a variation
of about 100% or more exists. This shows that we can definitely reduce energy use through
conservation measures.
6. Specific energy consumptions have been calculated for a period of five years. These variations
show an increase in SEC in many industries. In some cases, there is a decrease, a welcome
measure.
7. Electricity production is shifting towards diesel captive plants because of power cuts in the grid
electricity. This increases the cost and decreases the efficiency of energy use. This has not
induced industries to reduce energy consumption.
8. A study of electric load patterns indicates that about 40% of the load is for heating. Hence,
these can be easily converted to use other forms of energy, thereby increasing efficiencyof use
and relieving the demand on electrical energy.
9. A study of electrical energy and power distribution throughout the state reveals a large spatia
disparity in energy use with most of the use being concentrated in Bangalore and one or two
singular points.
10. This study only reveals the possibilities of energy conservation. Actual measures depend on
studies in individual industrial units. Hence, energy budgeting and auditing measures in many
major industries should be initiated. The research and development must be undertaken now
in order to make major contributions in the decades following the year 2000.
| ACKNOWLEDGEMENTS |
Many industries cooperated with us in the collection of this data. Without their cooperation, it would have been impossible to write this article. We are happy to record our thanks to all these industries. We hope that this exercise will encourage them to look into their energy activities and start conservation measures. The Director of Industries and Commerce, Karnataka, Joint Directors and other officers were very helpful in our data collection work.
Our thanks are due to them for their cooperation and help. We are grateful to Dr N. V. Johis and Prof. K. M. Chetty for suggestions and many useful ideas. This work was supported by grants from the Ministry of Environment and Forests, Government of India.
| REFERENCES |
1. Schurr, S. H. and Eliasberg, V. F., Energy and Economic Growth in the United States. Resources for the Future Inc.,
Washington, 1962.
2. The United Nations, Energy Statistics Yearbook. United Nations Publications, New York, 1991.
3. Economic Intelligence Service, Current Energy Scene in India. Centre for Monitoring Indian Economy Pvt. Ltd.,
Bombay, India, May 1993.
4.. World Population Data Sheet, Demographic Data and Estimatesfor the Countries and Regions of the World. Population
Reference Bureau Inc., Washington, 1994.
5. Janosi, P. E. D. and Grayson, L. E., Journal of Development Studies, 1972,8, 241.
6. Subramanian, D. K. and Ramachandra, T. V., State of Environment Report Karnataka, ed. C. J. Saldanha, 1985
pp. 107-127.
7. Ramachandra, T. V. and Subramanian, D. K., Energy Policy, June 1993, 644.
8. Ramachandra, T. V. and Subramanian, D. K., Energy Conversion and Management, 1991, 33, 899.
9. Carlsmith, R. S., Chandler, W. D., McMohan, 1. E. and Santini, D. J., Energy Efficiency. How far can we go?
ORNL/TM-11441, Martin Marietta Energy Systems Inc., USA, 1990.
10. Fulkerson, W. Fairchild, P. D. and Judkins, D. R. Energy Technology R & D: What Could Make A Difference? Part
I-Synthesis Report. ORNL-6541/VI, Oak Ridge National Laboratory, Oak Ridge, TN, 1989.
II. Williams, R. H., Annual Review of Energy, 1978,3,313.
12. Ross, M., Science, 1989,244,311.
13. Dale, S. J., Assessment of Energy Applications of High Temperature Superconductivity: Extended Summary Report.
Electricity Power Research Institute, Palo Alto, CA 1991.
14. DOE, The DOE Industrial Energy Conservation Program: Research and Development in Separation Technology,
DOE/NBM-8002773, U.S. Department of Energy, 1987.