Watershed management using GRDSS
 |
T.V.Ramachandra & Uttam Kumar |
|
T.V.Ramachandra & Uttam Kumar |
|
CONTENTS
|
||
| Abstract | ||
| Introduction | ||
| GRDSS | ||
| Study Area | ||
| Results & Discussion | ||
| Vegetation Indices | ||
| DEM & Watershed Analysis | ||
| Summary | ||
| Acknowledgments | ||
| ABSTRACT |
The dimensions of watershed management can be easily understood and improved by applications involving innovative information management technologies. This paper discusses the capability of Geographic Resources Decision Support System in watershed planning and management
| INTRODUCTION |
WATERSHED is a region (or area) delineated with a well-defined topographic boundary and water outlet. It is a geographic region within which hydrological conditions are such that water becomes concentrated within a particular location, for example, a river or a reservoir, by which the watershed is drained. Within the topographic boundary or a water divide, watershed comprises a complex of soils, landforms, vegetation, and land uses. The terms watershed, catchment, and basins are often used interchangeably (Rattan Lal, et al, 2000). They have long been recognised as desirable units for planning and implementing developmental programmes.
Watershed management encompasses the simultaneous consideration of hydrological, pedological, and biological resources, necessitating the need for making better use of analytical tools and approaches, which address spatial and temporal variability, is critical. The cumulative impacts of human activities, which threaten the ecological, economic, and aesthetic integrity of many drainage systems and the strategies to mitigate these impacts, have explicit spatial dimensions (Morgan and Nyborg, 1995). Watershed approaches in resource planning require timely and accurate data with spatial as well as statistical aspects. In this regard, GIS holds great promise with a provision to handle spatial and temporal data and aid as an integrative planning tool for watershed management.
GIS has options to store and create spatial maps with a potential for performing multiple analyses or evaluations of scenarios such as model simulations of physical, chemical, and biological processes, which support the applications of watershed. Multi spectral space borne remote sensors (such as LISS3 in IRS IC, etc.) provide spatial and temporal data (at 24 days interval) at various spectral (G, R, IR) and spatial resolutions (23.5 m for MSS data and 5.8 m for Panchromatic data). This is helpful in analyzing the dynamic changes associated with the earth resources such as land and water. Thus, spatial and temporal analysis technologies such as GIS and Remote Sensing are very useful in generating scientifically based statistical spatial data for understanding the land ecosystem dynamics. GRDSS (Geographic Resources Decision Support System) has the functionality to carry out spatial raster and vector analyses and also aids as a Decision Support System that helps in analysing and visualising the decisions.
| GRDSS |
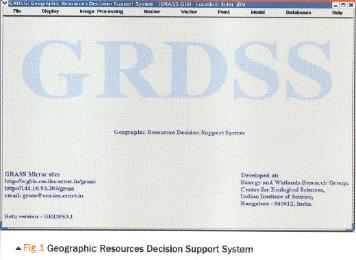
GRDSS is a GRASS (Geographic Resources Analysis Support System, http://wgbis.ces.iisc.ac.in/grass) based GIS. GRASS is an open source GIS that works on Linux platform (freeware), but most of the applications are in command line arguments. The command line syntax for GRASS was time consuming for individuals with limited programming skills. In order to overcome this, a user friendly graphical user interface (GRDSS) for GRASS GIS was developed with all functionality of GIS and image processing (Figure I). It aids decisionmakers and planners as a decision support system to visualise the decisions with spatial and temporal dimensions along with capabilities to capture, store, process, display, organize, and prioritize spatial and temporal data.
Natural resource management for watershed requires collating and analyzing detailed land resource data. GRDSS was used to identify potential development sites by comparing actual sites for watershed management through digital elevation models (DEM). DEM is a representation of the continuous variation of relief over space that helps in assessing landscape characteristics along with topography and has a wide application in hydrological modeling. These characteristics help to determine slope steepness, slope length, flow directions, areas, boundaries and outlets of watersheds.
Water management, both in its conservation and control aspects, has significantly benefited from satellite remote sensing inputs that has become an effective tool for a number of applications related to water resources development and management. Besides inventorying of surface water resources through mapping of waterbodies, remotely sensed data enable us to study various hydrological processes and there by water balance with reasonable accuracy.
Watershed assessment needs an approach that can handle complex problems but is easy to implement, that is flexible but consistent, that can be applied at different spatial scales, and that can readily be translated into easily communicated descriptions related to management decisions (Bon an et aI., 1992; Shukla et al., 1990).
Integrated remote sensing based watershed management in Anantapur Disrrict, Andhra Pradesh, India (S V B K Bhagavan and V Raghu, 1999) presents a detailed micro level planning at village level for natural resource management more scientifically for combating drought on long term basis using remote sensing techniques. In view of several drought situation, various drought proofing works were recommended from in situ soil and moisture conservation measures, rain water harvesting structures, and fodder, fuel wood, and permanent tree cover development points of view.
An analysis of the impacts of urbanization on Mattikere Tank Watershed, Bangalore City, India (K Ganesha Raj, 1999), shows that a number of tanks in and around Bangalore were converted into residential/ commercial/ indusrrial layout, parks, playgrounds, and bus stands or solid waste dumping yards. The study showed that urban area has more than doubled in 13 years at the cost of agriculture/ open/ scrub and 60% of the water area has reduced and dry tank, which was seen in 1983, is currently occupied by grass/weed.
| STUDY AREA |
Burgeoning population coupled with lack of holistic approaches in planning process has resulted in degradation of natural resources (land and water) in dry arid regions of Karnataka. The Kolar district in Karnataka state, India was chosen for this study. It is located in the southern plain regions
(semi-arid agro-climatic zone) extending over an area of 8238.47 sq km between 77°21' to 78°35' E longitude and 12°46' to 13°58' N latitude. Kolar is divided into II taluks. The distribution of rainfall is during southwest and northeast monsoon seasons. The average population density of the district is around 2.09 persons per hectare.
The district forms part of northern extremity of the Bangalore plateau and since Kolar lies off the coast, it does not enjoy the full benefit of northeast monsoon and being cut off by the high Western Ghats. The rainfall from the southwest monsoon is also prevented, depriving of both the monsoons and subjected to recurring drought. The rainfall is not only scanty, but also erratic in nature. The district is devoid of significant perennial surface water resources. The ground water
TABLE 1:- LAND USE DETAILS OF KOLAR DISTRICT
Supervised |
Unsupervised |
|||
Categories |
Area (in ha) |
Area (%) |
Area (in ha) |
Area (%) |
Agriculture |
233519 |
28.34 |
222416 |
27.00 |
Builtup |
131468 |
15.96 |
70970 |
8.62 |
Forest |
68300 |
8.29 |
85295 |
10.35 |
Plantation |
70276 |
8.53 |
84716 |
10.28 |
Waste land |
320284 |
38.88 |
360450 |
43.75 |
potential is also assessed to be limited. The terrain has a high runoff due to less vegetation cover contributing to erosion of top productive soil layer leading to poor crop yield. Out of about 280,000 hectares of land under cultivation, 35% is under well and tank irrigation
( http://wgbis.ces.iise.ac.in ).
The main sources of primary data were from the field (using GPS), the Survey of India (SOl) toposheets of 1:50,000, 1:250,000 scale and the multispectral sensors (MSS) data of the Indian Remote Sensing satellites (IRS ID). The secondary data were collected from the government agencies (Directorate of Census Operations, Agriculture Department, Forest Department and Horticulture Department). LISS-III MSS data scenes corresponding to the district for path-rows (100,63) (100,64) and (101, 64) was procured from the National Remote Sensing Agency, Hyderabad, India ( http://www.nrsa.gov.in ).
| RESULTS AND DISCUSSION |
The SOl (Survey of India) toposheets (scale 1:50,000 and 1:2,50,000) were digitized using GRASS 5.0.0 (pre2) to generate base layers - boundary, road network, drainage network, ete. The existing database and selective field visits helped to gather socio-economic and demographic informations.
Kolar district spreads over three scenes corresponding to path-rows (100,63) (100,64) and (101, 64). Bands 2, 3, and 4 were extracted from the NRSA data CD using the image extraction module of GRDSS. These bands were geo-corrected considering ground control points (GCP's) from field using GPS and by vector layers (of road network and waterbodies) using nearest neighbour resampling algorithm. The respective band images corresponding to the district were cropped from the scenes and were allied to obtain the entire district.
The land cover is defined by the attributes of the earth's land surface and immediate subsurface, including biota, soil, topography, surface and groundwater, and human structures. Landcover conversions (i.e., the complete replacement of one cover type by another) are measured by a shift from one land-cover category to another, as agricultural expansion, deforestation, or change in urban extent. The land cover analysis was done to detect the regions under vegetation and non-vegetation by computing the different vegetation indices.
| VEGETATION INDICES |
The analysis of vegetation and detection of changes in vegetation pattern are keys to natural resource assessment and monitoring. Healthy green vegetation has different trends in interaction with the energy in visible and near-infrared regions of the electromagnetic spectrum. This strong contrast between the amount of reflected energy in the red and near-infrared regions that form the basis to develop quantitative indices of vegetation condition using remotely sensed data.
The slope-based and the distance-based vegetation indices (VIs) help in land cover analysis depending on the extent of vegetation and soil in a region. The indices computed for the district shows that the district has about 45% area under various types of vegetation, while built-up and waste land constitute about 55%. The slope-based VIs are simple arithmetic combinations that focus on the contrast between the spectral response patterns of vegetation in the red and near-infrared portions of the electromagnetic spectrum. The distance based group measures the degree of vegetation present by gauging the difference of any pixel's reflectance from the reflectance of bare soil. The scatter plot of the two bands (Red and NIR) and regression analysis was performed by taking red band as the independent variable and NIR band as the dependent variable which helped in obtaining the slope, intercept and the correlation coefficient (equation 1, 2, 3, 4).
y = 0.6347x + 34.762 ------------------------------- (1)
R2 = 0.8903 ------------------------------------------ (2)
When the NIR band was treated as the independent variable the following results ( equation 3 and 4) were obtained:
y =1.4025x - 33.004 --------------------------------- (3)
R2 = 0.8903 ------------------------------------------ (4)
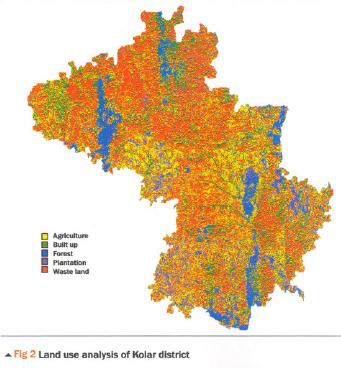
False Colour Composite (FCC) was generated with the band2 (green), band-3 (red) and band-4 (near infrared). The vector polygons of different land use categories were extracted from the FCC and field visits using GPS were made to collect attribute information corresponding to polygons in the heterogeneous patches of the image. Both supervised and unsupervised classification approaches were tried to identify landuse categories. Figure 2 depicts landuse map of the district classified using Gaussian Maximum Likelihood Classifier (GMLC). The level of accuracy in GMLC is 94.67 compared to unsupervised classifier (78.07%). The composition of land use categories (agriculture, forest, plantation, built-up and wasteland) are listed in Table I. Recursive soil erosion was reported in Kolar, leading to the loss of productive topsoil, which is evident from the extent of the wasteland (about 40%) in the district. The loss of topsoil degrades arable land and eventually renders it unproductive. Accuracy estimation in terms of producer's accuracy, user's accuracy, overall accuracy and k Kappa coefficient were subsequently made after generating confusion matrix. The producer's accuracy, user's accuracy corresponding to the various categories and overall accuracy results obtained are summarized in Table 1 Table 2 .
A KHAT k value (0.931577) obtained from supervised classification matrix indicated that an observed classification is 93 percent better than one resulting from a chance.
| DEM & WATERSHED ANALYSIS |
Characterization and analysis of watershed features are crucial for the conservation of water and land resources and their integrated management for optimum productivity. Elevation models are the key input to performing hydrologic analysis. The elevation provides the input data for calculating flow direction across terrain, which is subsequently used for creation of stream
TABLE 2 PRODUCER'S/USER'S/OVERALL ACCURACY
Supervised Classification |
Unsupervised Classification |
|||||
Category |
Producer's accu. (%) |
User's accu. (%) |
Overall accu. (%) |
Producer's accu. (%) |
User's accu. (%) |
Overall accu. (%) |
Agriculture |
95.45 |
97.67 |
80.49 |
97.06 |
||
Builtup |
94.11 |
100.00 |
68.00 |
80.95 |
||
Forest |
90.90 |
86.96 |
94.67 |
88.37 |
74.51 |
78.07 |
Plantation |
91.89 |
94.44 |
65.16 |
100.00 |
||
Waste land |
100.00 |
93.75 |
85.71 |
56.60 |
||
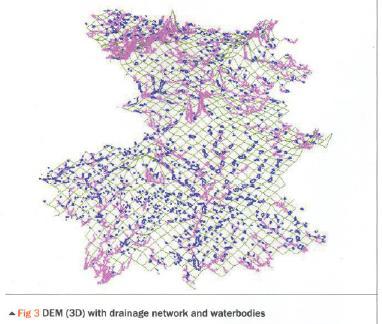
networks, and watersheds. Interpolation of the rasterised contours was done through the interpolation module of GRDSS. The DEM was generated through interpolated image using the DEM generation module. Later NVIZ module of GRDSS helped in visualizing the 3D view of the DEM. Figure 3 shows drainage network with waterbodies draped on 3D mesh.
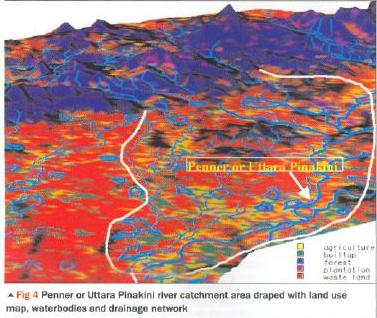
Overlay of waterbodies as on 1978, on the classified image of 1998 and 2002, it is apparent that waterbodies in Kolar have dried or has been transformed to other landuse practices due to unplanned and unscientific approaches in land use planning. The places, which were earlier wetlands, have now dried up and other land use practices (builtup or wasteland) have emerged in their place. Catchment analyses of various waterbodies were done to know the status. Similar analysis done in the catchment area of the Penner or Uttara Pinakini river spread over two taluks, where 1.36% and 0.33% of waterbodies out of the total area of 63816.91 ha and 88858.55 ha respectively, have now transformed into different landuse categories as depicted in Figure 4.
The soil erosion has become a major problem due to less vegetation cover resulting in silting up of innumerable number of waterbodies. Due to changes in land use pattern, the meagre surface water storage available is also getting decreased day-by-day. Decline of surface water resources has increased the pressure on ground water. These analyses highlight that the unsustainable landuse practices have modified the status of the waterbodies to mostly wasteland, etc.
| SUMMARY |
Watershed management through the case study of Kolar district has clearly demonstrated that improper decisions and unplanned approach to landuse has led to waste land that constitute about 40% of the total area. The temporal analysis of the waterbodies indicated their decline over a time interval. Disappearance of surface waterbodies has led to decline in the water table at local level. This highlights the need for ecosystem approaches in management of waterbodies considering watershed as a hydrological unit. These approaches require both spatial and non-spatial data analyses. The assessment of the watershed and holistic approaches in landuse planning helps in ensuring the sustainability.In this regard GROSS could be a Powerful decision support system
| ACKNOWLEDGMENTS |
We thank the Ministry of Environment and Forests, Government of India and ISRO, IISc Space Technology Cell for the financial assistance. We are grateful to Mr. Sanjeev Kumar Jha and K.V.Gururaja for proof reading the manuscript. We thank NRSA, Hyderabad, India for providing the satellite data required for the analyses.
![]()