* T. V. Ramachandra, Energy Research Group, Centre for Ecological Sciences.
Indian Institute of Science, Bangalore 560 012, India.
International journal of Ambient Energy, Vol 19, Number 2
Printed @ Ambient Press Limited 1998
| CONTENTS | Synopsis | ||
| Introduction | |||
| Karnataka's Energy Scene | |||
| Industries in Karnataka |
|||
| Case Study | |||
| Results & Discussions | |||
| Conclusions | |||
| Appendix | |||
| Acknowledgements | |||
| References |
Energy is a vital component in rural industries such as the Agro processing industries and the brick and tile industries. In rural areas, population pressure and low agricultural productivity are among factors forcing people into marginal and ecologically fragile lands. Forests are being logged to meet the energy demand of a region in addition to clearing forests for agricultural purposes to meet the demand of food. Soil erosion, siltation and floods are a consequence of the destruction of forests. The low productivity in agricultural lands and the lack of alternative employment opportunities in rural areas has resulted in large scale migration to urban areas in search of jobs. In this context, industries in rural areas would help in arresting rural migration to urban areas and help to improve the economic status of local people in the region. For the sustainable development of a region, industrialisation is to be supplemented with integrated energy planning approaches. It is therefore necessary to look for alternative sources of energy which are renewable in nature and which could be harnessed in a decentralised way. The energy efficiencies of end use devices could be improved and numerous opportunities exist for the development of industrial process with greater efficiencies.
Energy auditing carried out in sample rural industries has revealed a wide disparity in energy consumption to produce the same quantity of similar products. About 60% of the sample units have Percentage Production Capacity Utilisation (PPCU) less than 50% and higher Specific Energy Consumption (SEC) and Energy Intensity (EI). The wide variations in EI in the Cashew Industries from 4.49 kg of fuelwood per kg of kernel to 8.66 kg of fuelwood per kg of kernel reveals the scope for energy conservation to be in the order of 30 to 48%. It has been noticed that optimal utilisation of installed capacity (better PPCU) would help in energy conservation. The energy analyses carried out reveals that the relationship between SEC and Production (Pr) fits a power law with an exponent less than one. This indicates an improvement of SEC with increase in production which, in turn, implies the optimal utilisation of installed production capacity.
An overview of the Small Scale Industries in Karnataka State, India, is also given in this paper from the point of their spatial distribution, investment costs, industrial growth rate and employment generation. Even though these aspects are not directly connected to the energy consumption patterns, they throw light on developmental aspects and hence indirectly influence energy and the environment.
Our primary needs for energy - heat and light to sustain life on earth - are obtained from the sun. With increasing dependence on acquired forms of energy, energy has become an important need in out life. Generation, transportation/transmission, distribution and usage in end use devices are the main components in the energy system. Energy is obtained from resources, which can be broadly categorised as renewable and nonrenewable or depletable. These resources are converted in to a form desired by the end user. The conversion of energy from one form to another form results in a loss of some useful energy (law of entropy). In a complex system with a large number of conversions, the losses are considerable.
Renewable sources [1] are available all the time, while the depletable resources such as coal, oil, or uranium, were stored over a period of millions of years. Renewable energy can be obtained from the sun either directly (providing light and drying of grain and other materials, heating of earth), or indirectly (wind, hydro, biomass and firewood). Firewood is a renewable resource, only if our annual consumption equals or is less than the annual production. To cater for the needs of a growing population for cooking and rural industries it is necessary to:
Thus the energy has been a dynamic force in accelerating the growth and development of human society. The demand for energy is not an end in itself but for the services such as heating, lighting, mechanical power and other services that satisfy human needs. This necessitates the need for proper energy management taking into consideration the satisfaction of basic human needs through economically feasible, energy efficient, environmentally sound and viable options. These include:
This highlights the need for integrated regional planning [2], based on a detailed look at how energy is used rather than the traditional preoccupation with energy supply and aggregate demand.
Maximum thermodynamic efficiency and maximum cost effectiveness in energy use are the two principles that govern energy conservation policies. The efficiency of energy use depends on thermodynamics, and the cost of energy use responds to the economics of resource allocation. In any region where the energy supply structure is vulnerable, the conservation of energy is a very effective way to alleviate energy constraints.
Karnataka does not have any coal deposits. It gets its coal from external sources. Electrical energy for Karnataka was purely hydro, but with the commissioning of the Raichur thermal power station, it also gets electrical energy from coal. The other major source of commercial energy - oil - is also not available in Karnataka. Hence the main source of commercial energy for the state comes from hydroelectric plants. These plants have large reservoirs to store rain water throughout the year, the dams being built in prime forest areas thereby submerging sizable areas of forest. It is shown by a study that we can obtain a comparable quantity of energy from forest biomass instead of water from the submerged areas. An ideal solution would be to go in for a set of peaking power plants with minimum storage which utilises rain water during the monsoon period and supplemented by firewood-based thermal power plants.
It can be seen that Karnataka State depends both on commercial and non-commercial forms of energy [3]. Non-commercial energy provided over half the supply from sources such as firewood, agricultural residues, charcoal and cow dung. Commercial energy provided the rest, mainly through electricity, oil and coal. Table 1 lists the energy sources meeting the demand for energy during the year 1990-91. The largest single source is firewood. Electricity represented over half the commercial energy demand for 1990-91. Agro wastes are also used for energy purposes. The total share of industries in energy demand is around 44%. The state generated 12,430 million units of electrical
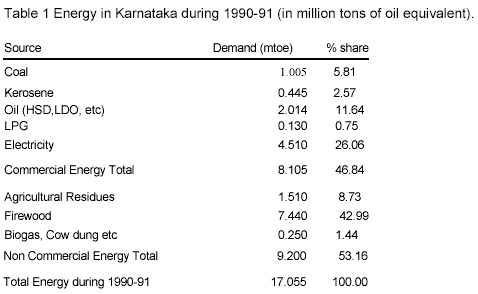
energy in 1990-91. Irrigation pumpsets used 36.26% of total electrical energy. This was followed by heavier industries with a share of 34.34%, domestic lighting 15.35%, light industries 9.90%, commercial lighting 2.23%, public lighting 1.24% and others (0.68%).
The present study mainly concentrates on the energy use pattern study in rural industries in Karnataka State, India, by collecting secondary data from various government agencies and conducting a primary survey of a sample at Kumta taluk in Uttara Kannada District.
Industry is playing a pivotal role in the development of Karnataka State. The secondary sector in the State accounts for nearly a quarter of the State income (in real terms) of the total output in the economy [4]. The average annual growth rate of industrial production over the period from 1981-82 to 1990-91 was about 6.4% as against 7.9% in the country as reflected in the index of industrial production.
Small Scale Industries: an Overview. The basic framework for the industrial policy of the government was first spelled out in the industrial policy resolution of 1956, with an emphasis on the development of small scale industries. Small, medium and large industries have been assigned a mutually complementary role with a view to facilitate an integrated and harmonious growth of the industries sector as whole and with the objective of economic growth with social justice.
The policy measures, announced in 1991 by the government provided further impetus to the growth of the small sector. The primary objective of the 1991 policy measure was to impart more vitality and growth impetus to the sector to enable it to contribute fully to the economy, particularly in terms of growth of output and employment. As per the recent policy (1991), in small scale industries undertaking the investment in fixed assets in plant and machinery whether held on ownership terms, or on lease or by hire purchase does not exceed Rupees (Rs) 60 lakhs(One lakh = one hundred thousand or 105).
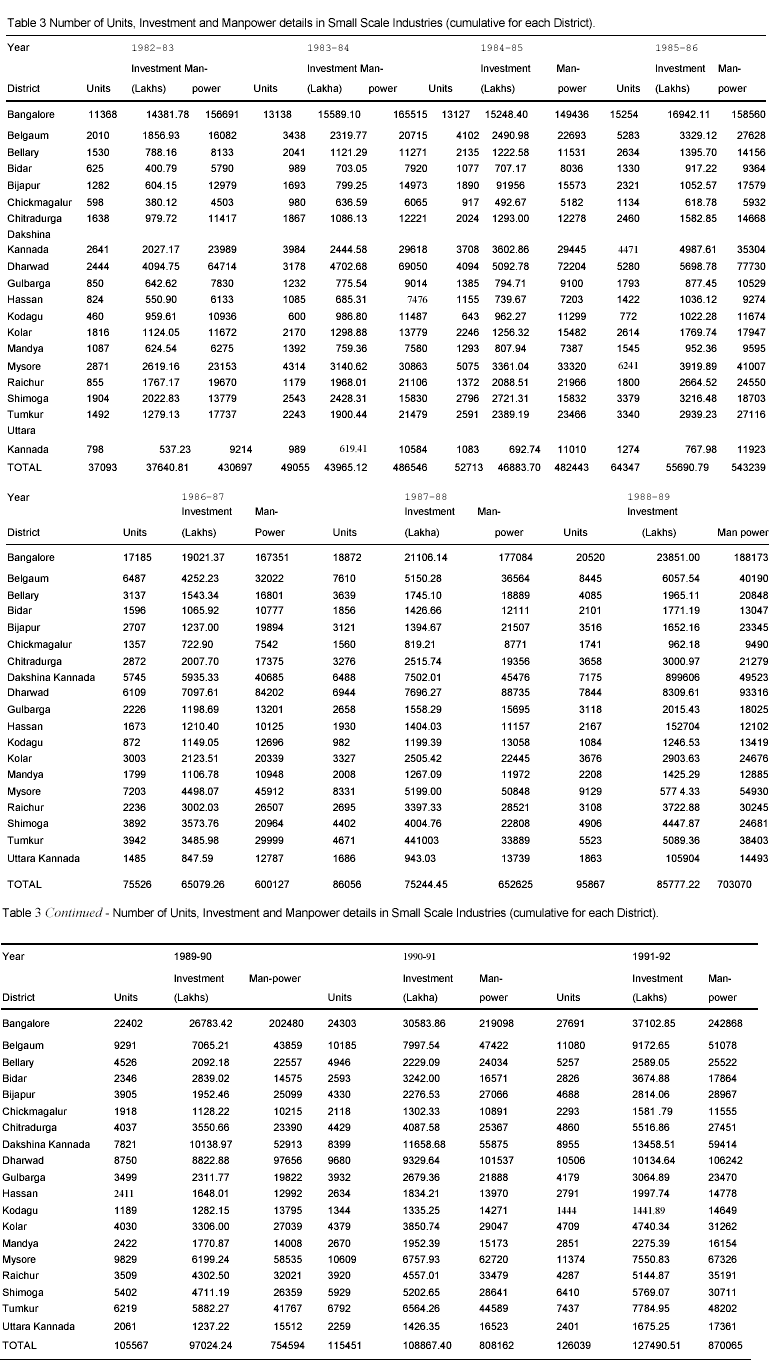
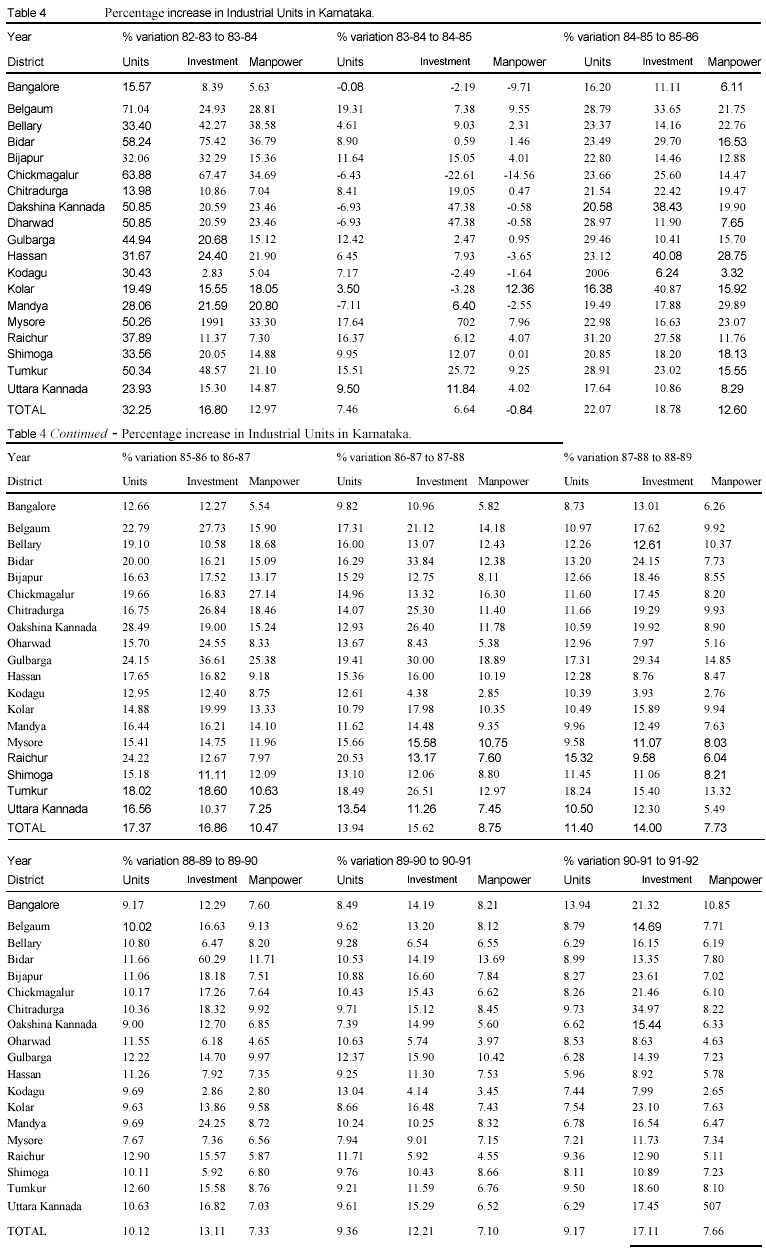
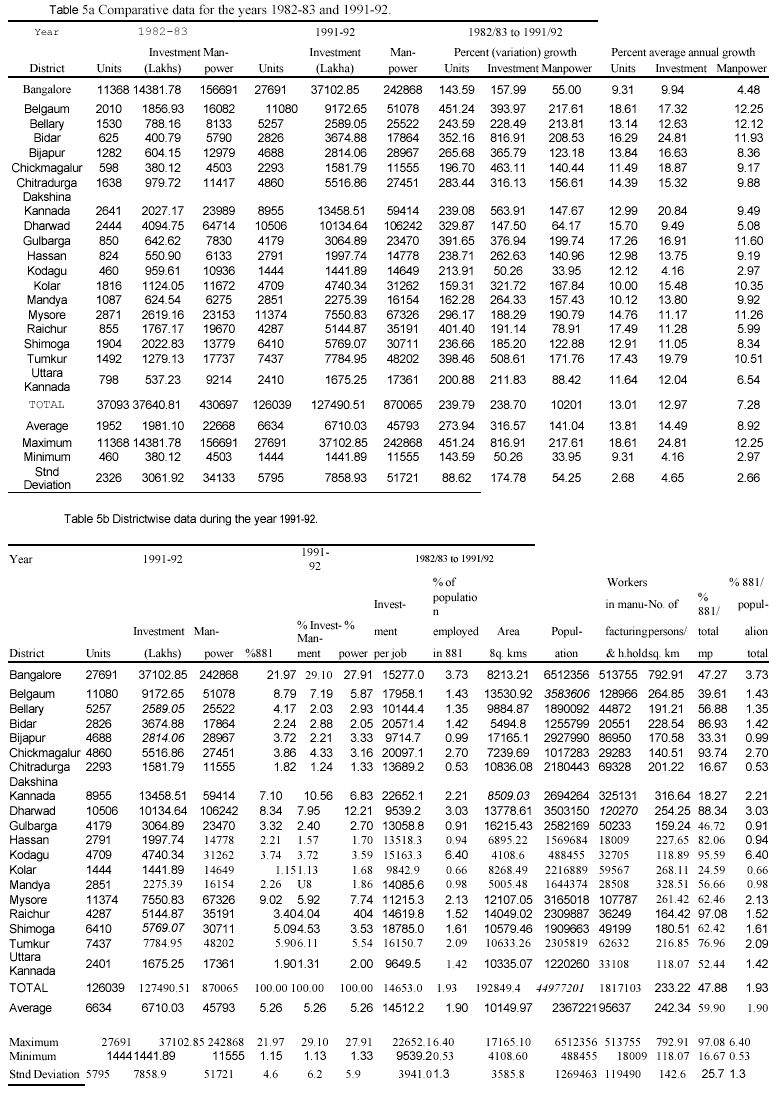
The spectrum of industries ranges from unorganised traditional sectors and modern small scale sectors to large and medium scale industries. The traditional sector and small scale sector provides maximum employment (413.39 lakhs in 1989-90) and constitutes an important component of the economy. In terms of value added it is estimated to contribute 50% of the value added in the manufacturing sector. The uniform distribution and growth in this sector besides resulting in a preponderance of self employment and under dispersal of industrial and economic activities, ensures maximum utilization of both human and material resources. The economics of production is important in small scale industries. Energy consumption plays a key and dominant role in the production economics of these industries. The small scale industries sector plays an important role in the industrial economy of the state. It contributes substantially to the industrial production and in generating employment. These industries are dispersed all over the state, however there is disparity in regional distribution. Table 2 illustrates the growth of small scale industries in Karnataka since 1969-70. The growth in last decade is phenomenal as the number of industries has increased from 37,148 to 129,915 with a percentage annual growth rate of 15.01 % and percentage annual growth in manpower employed of 13.58%. Table 3 gives the cumulative information of SSI' s from 1982-83 to 1991-92 for each district while Table 4 gives percentage yearly increases.
From Table 3 it is evident that the Bangalore district with 27,691 leads all other districts. The increase in the number of industries in the decade is given in Table 5a. Belgaum has annual average growth of 18.61 % while for Bangalore it is 9.31 %. Information regarding the number of industries, investment, and manpower employed in the SSI sector at the end of financial year 1991-92 is listed in Table 5b. The percent number of units varies from a low value of 1.15% (for Kolar District) to a high value of 21.97% (for Bangalore district). Investment per job computed for each district reveals a variation from Rs.9539.20 per person for Dharwad to Rs.22652.09 per person for Dakshina Kannada, indicating that some industries are capital intensive.
Workers in manufacturing and household industries are listed in the eleventh column of Table 5b. The share of manpower in SSI to the total manpower in the industries sector shows a variation of 16.67% for Chitradurga and 18.27% for Dakshina Kannada to 88.34% for Dharwad, 93.74% for Chikmagalur and 97.08% for Raichur. The lower values for Chitradurga and Dakshina Kannada are mainly due to the presence of large number of household industries in these districts. Most of these units are located in rural areas.
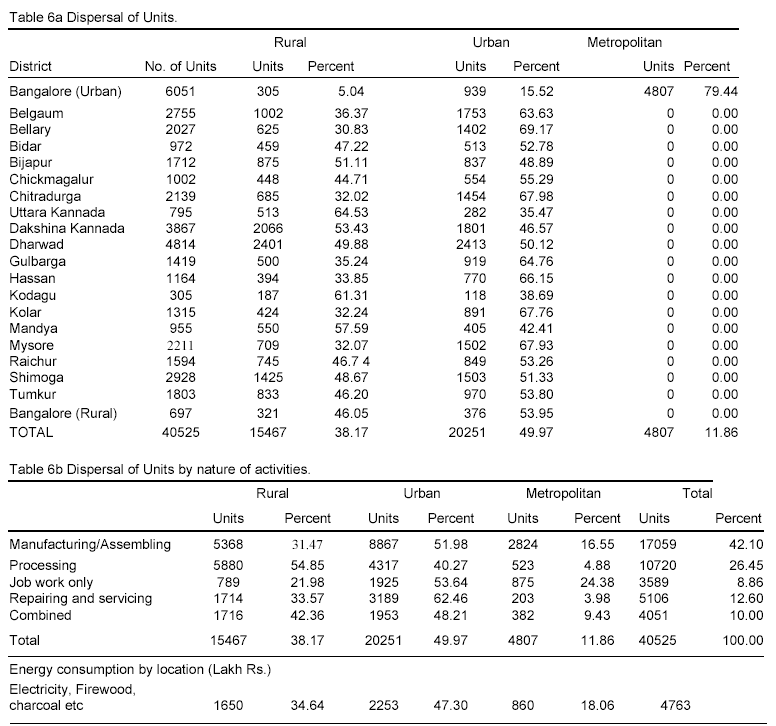
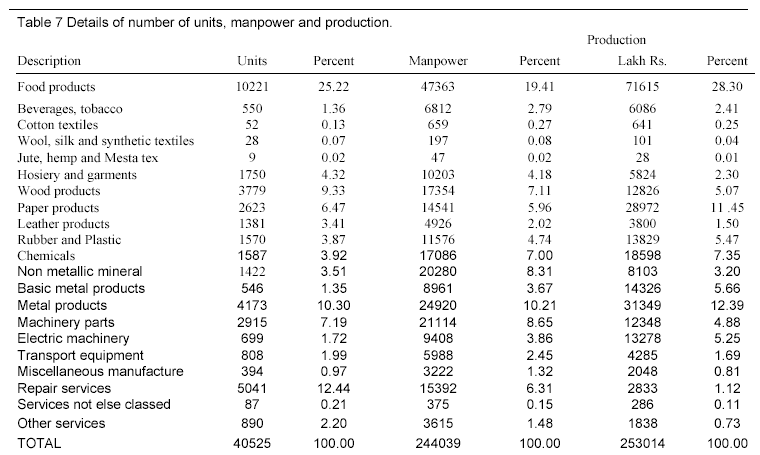
Dispersal of small scale units. The second census of registered small scale units [5] conducted by the Directorate of Industries and Commerce of 40,525 industries reveals that 38.14% of total Industries are located in rural areas, while 49.97% in urban area and 11.86% units in metropolitan city of Bangalore as indicated in Table 6a. A look at the employment generated in these industries reveals that 40,525 units have provided employment to 244,039 persons (shown in Table 7). The food products sector (National Industry Code: NIC 20 &21) leads

with 19.4% of total employment. This is followed by machinery and parts units (8.65%), Non metallic mineral products 8.33%. Table 6b gives information regarding dispersal of units in nature of activities ( major activities such as repairing, servicing etc).
The total production of the 40,525 units surveyed was Rs. 2,52,687 lakhs. Out of this 28.32% is by food products, metal products (12.39%), and paper products (11.46%). This is illustrated in Table 7. The food products sector constitutes a major component in the SSI sector and most of these units are located in rural areas of Karnataka. As rural industries are one of the prime actors in the rural energy scene, further study is carried out on industries located in rural areas.
Rural Energy Scenario. Rural energy supply is closely tied in with agricultural and forest production, and with an overall crisis of agricultural productivity and environmental degradation linked to modernisation and changes in land use. The rural community depends mainly on non-commercial energy for domestic and rural industrial needs [6]. If new energy strategies are to be successful, rural energy needs will have to be placed squarely in the context of integrated approaches to rural development, basic needs and general questions of rural poverty, land and other scarce resources. With the emphasis on rural development by the government, rural industries are gaining importance. This paper attempts to focus on the various ecological parameters, such as energy conservation and raw material availability, involved in the successful functioning of rural industries.
The rural industries are important to the stability and growth of the regional economy. They have a significant role in averting migration of rural people to urban areas and cities which in turn cause the start of new slums and hence lead to environmental and ecological problems. The rural industries thus help in the well-being and survival of rural communities. The rural industries process local raw materials, they also tend to rely on local sources such as firewood and agricultural residues for the heat energy they need.
Wood is the traditional domestic fuel in rural areas. With the depletion of forest resources, the financial viability of many industries is threatened due to the increase in fuelwood prices and the lack of technical and financial assistance to switch over to alternate fuels. Although conventional fuels
are available in many rural areas, their cost per unit of useful energy is usually much higher than that of traditional sources. With the use of conventional fuels, industry becomes more dependent on distribution networks which are liable to interruption and it is not desirable to use high quality energy, such as electricity, for low quality work such as heating. This unreliability in supply and the high cost of conventional sources of energy creates a demand for viable alternatives to meet the needs of rural industries locally. The supply of energy from wood and residues are more flexible and reliable. With increasing industrial demand for wood and residues, both for energy and for other domestic applications, agricultural and industrial purposes puts further pressure on traditional sources, often with adverse effects on other end users, on the stability and productivity of the rural environment. This in turn results in a demand for increasing biomass stocks by raising energy plantations to meet the growing needs of the population for fuel, for domestic use and in rural industries.Rural industries provide the majority of off-farm employment and income generation in rural areas. In Karnataka there are 27,028 villages with
175 taluks (A taluk is a district or tract of proprietary land in India). The population of the state is 44,817,398 with a density of 234 persons per square kilometre and 71.1 % of total population are in rural areas. Deforestation and loss of soil fertility has resulted in a serious reduction in food production by traditional agriculture. Increase in population, leading to fragmentation in land holding, has resulted in further degradation of agriculture land. Fuel shortages are usually tied with environmental deterioration and have also affected food production. Rural industries in this regard are playing a significant role by providing employment to poor peasants especially women. This sexual division of labour has influenced women's ability to produce food and provide the nutrition required for their family.
The cashew processing industries are taken up for further studies among rural industries to explore the role of rural industries in the rural economy and role of traditional fuel in the survival of these industries. Cashew processing industries are mainly located in the rural areas and are labour intensive as well as energy intensive. Cashew processing mainly depends on fuelwood and other agriculture residues for the heat energy required. These industries employ mainly women and hence have helped the village women to attain economic independence and hence self sufficiency. Cashew industries are located mainly in the coastal belts of Karnataka, due to the availability of raw material (namely cashew nuts) in the region. Coastal areas are densely populated and relatively biomass scarce areas. The nonavailability of fuelwood and agricultural residues have often caused serious problems.
Objectives of the study: The objectives were to:
Methodology: The study was carried out in five stages:
Study Area: The primary survey was carried out in industries located in the Kumta taluk of Uttara Kannada district. Kumta taluk is located in the coastal tract of Karnataka [7]. It lies between 74° 24' to 74° 45' east longitude and 14° 17' to 14° 35' north latitude and extends over an area of 582 square kilometres. With a population of 107,963, Kumta taluk is one of the densely populated regions in Karnataka.
Cashew Industries: Cashew processing industries were selected for this study mainly because:
The main function of the cashew processing industry is the recovery of the kernel from raw nuts by manual or mechanical means. Processing consists of moisture conditioning, roasting, shelling, drying, peeling, grading and packing. The present study covers 142 sample industries from all districts in Karnataka. Also detailed investigations of processing were carried out for ten industries in Kumta taluk of the Uttara Kannada (North Kanara) district of Karnataka.Some of these processes are illustrated in the flow diagram on the next page and all terms are explained in the text which follows.
Conditioning: Conditioning involves sprinkling of water on dried and stored nuts to bring them to an optimum moisture level of 20% - 30%. To make the shell brittle, roasting is done. The mesocarp of the shell consists of honeycomb like cells containing a viscous liquid called the cashew nut shell liquid (CNSL) which provides natural protection to the kernel against insects. CNSL is a valuable raw material for some polymer based industries such as paints, varnishes, resins and brake linings. Industries in Kumta export and sell these shells to Goa and Ankola where boat manufacturers use the CNSL as paint.
Roasting: Drum roasting is done in most of the industries. The capacity of the drum is 320 kg. Shells are roasted in steam at 1000C, for about 22 minutes. In most of the industries during the course of our survey, workers were instructed to load nuts to the full installed capacity of the drum. The nuts are kept aside for a day for cooling. Then Shelling is done using hand and leg operated shelling machines. For this purpose female labourers are employed. Normally a worker shells 17 kg/day. The wages paid on pro rata basis at the rate of Rs. 1.5/kg plus Rs. 1.5 towards transport allowance.
One sample industry surveyed had 12 female workers in this section. Most of these workers were in the age group from 15 to 25. The kernel is scooped out by means of a sharp needle. After shelling the kernels are dried in the drier to reduce the moisture (approximately 10%) and to loosen the adhering testa. After drying for 8 - 12 hours the peeling is done by hand, using a knife. 25 female workers were employed in this section. A minimum of 8 kg of kernels is given in the morning for peeling per person, which has to be completed and the same quantity is to be returned, when the worker leaves the work place. Workers were paid on the pro rata basis at the rate of Rs. 1.5/kg to Rs. 2/kg.
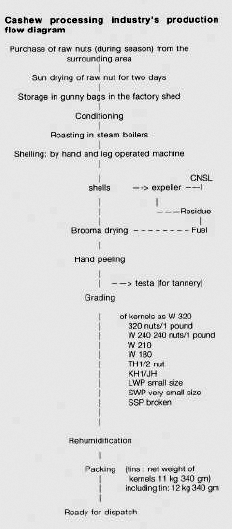
The next stage is grading of kernels, depending on the specification for exportable grades. The wholes are size graded based on the number of kernels per pound as W320, W240, W210 and W180 (means 180 kernels/pound). Damaged kernels were graded as TH (1/2 size), KH C/2 TH), LWP (small size) SWP & SSP respectively. This grading is done by the experienced female labourers who were paid Rs. 300 - Rs. 400 per month. Packing is usually done in a tin, which holds 11 kg 340 gms Net, which are subsequently evacuated and filled with carbon dioxide. A rehumidification process is introduced before packing to overcome the possible overdrying. This whole operation has a higher yield rate of 90 to 95% of wholes. The raw materials required for these industries can be grown locally. In the next section cashew plantations are discussed from an ecological perspective in order to assess their ecological viability.
A cashew crop among plantation crops has the unique distinction that it can be cultivated in a wide variety of soils. It can survive on lands of low fertility and can be grown in all soil types from sandy sea coast to laterite hill slopes, but the best soils are deep, triable, well drained sandy loams without a hard pan. It grows and yields well in shallow and impervious soils such as sand hills where no other economic crop generally grows well; it is tolerant of saline and heavy clay soils; it grows on red and laterite soils. It cannot withstand water stagnation, flooding or bad drainage. In Karnataka, cashew is planted mainly in the coastal belt which receives an annual rainfall ranging from 1300 to 3500 mm.
The area under cashew plantation at the end of 1984-85 in Karnataka was 47,442 hectare. The productivity in Kumta tal uk of Karnataka on an average is 13 quintals per hectare. This data regarding productivity was collected by interviewing some farmers randomly selected in the Kumta tal uk. The total production from the Government Horticulture Department estmimates was 22,115 qtl. in Kumta taluk during 1992-93 (the area under cashew cultivation is 1595 hectares). Due to favourable weather and rainfall the scope for increasing the yield is more in the hilly region of the west coast.
Definitions: Specific Energy Consumption (SEC): SEC can be identified as the ratio of Energy Consumption in rupees to
Production in rupees. Thus:
SEC = En / Pr (Rs. 1 Rs.)
Energy Intensity (EI): EI is the ratio of Energy Consumption and Production in "per unit" terms. EI would be helpful in industries where the end products of a industry are cash products.
EI = En / Pr (kg/kg) or (kWh/kg)
The intra and inter variation in SEC and EI among the industries producing similar products reveals the extent of inefficient/efficient energy consumption. The higher the variation in the value of SEC and EI for the same amount of Production among industries producing similar product reveals the extent of disparity in energy consumption.
Percent Production Capacity Utilisation
(PPCU) = ratio of actual production to the total production / installed capacity
If Pr is actual Production, P is total Installed Production capacity then PPCU = (Pr/P) * 100. Relationship between variables: Applying standard statistical techniques, the relationship between the variables En and Pr can be represented by any of the following mathematical models depending upon the best fit (least error techniques).
(i)The linear En = A + B Pro
(ii) The parabolic En = A + B (pr) + C (Pr)2
(iii) Exponential En = A Exp (B.Pr)
linearized form: Ln (En) = Ln (A) + B (Pr)
(iv) Power law En = A * (pr)B
l0inearized form: Ln (En) = Ln (A) + B Ln (Pr)
Ln = natural logarithm
The En: Energy mix in rural industries comprises of mainly (a) fuelwood for heat and (b) electricity for lighting purposes [very minimal]. Regression analysis is carried out to look at the role of Energy Consumption and Specific Energy Consumption in this sector.
(1) The rural energy consumption model. To study the dynamics of the energy utilisation patterns in any
industrial plant, the SEC (Specific Energy Consumption) and EI (Energy Intensity) would help in predicting
minimum energy required to operate an industry efficiently.
(2) Statistical analysis of energy coefficients Energy consumption and production. The relationship between the
variables Energy Consumption (En) and Production (Pr) is determined by the least squares method. The best fit is of the
form:
En = A. (Pr) C
where "A" is the constant and the coefficient "c" is commonly known as the Energy Elasticity.
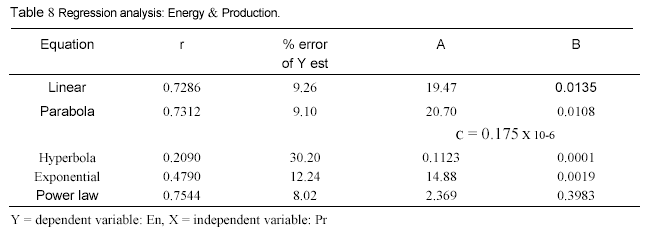
The data collected from both secondary (for 136 industries) and primary sources (energy auditing in six industries) were compiled. The regression analysis was done for this set of data. The probable relationship based on the least % error of best fit is:
En = 2.36 (Pr) O.3983
The 'generalised form of the relationship is written as:
En = A. (Pr) C-------(1 ) where C = Energy coefficient, A = constant
Equation (1) could be written as: C = (dEn/En ) / (dPr/Pr)----------(2)
That is, the Energy Coefficient expressed in terms of the proportionate change in En to the proportionate change in Pro The lower the value of "C", the lower is the change in En for the corresponding change in product. Differentiating Equation En = A (Pr)C with respect to change in production, we get the dynamic consumption rate that is:
d En/d Pr = A x C (Pr) C-1 -------------------(3)
The value of the Energy coefficient "c" being less than one, which means dEn/dPr declines sharply with increase in
production in a industry. This might imply better utilisation of the installed production capacity of boilers and driers. Specific Energy Consumption and Production. Specific Energy Consumption is the ratio of Energy Consumption (in
Rs) to the Production (in Rs). This ratio would help to predict the minimum
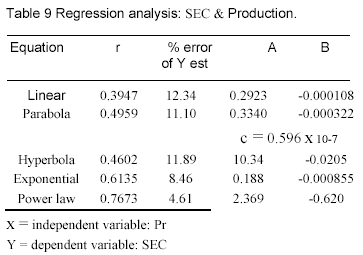
energy required to operate an industrial plant efficiently. The relationship between Specific Energy Consumption (SEC) and Production (Pr) for the cashew processing sector is tried by the least square method.A best fit with least % error of Y est is chosen, and is:
The relationship from least square method is:
SEC = 2.35 (Pr)-0.62
The results of the analysis is listed in Table 9. The general form of relationship:
SEC = A' (Pr)-c'-----------(4)
The negative exponent c' shows a decline in the value of SEC with increase in Production. This again may be inferred, as the energy efficiency improves with better efficiency utilisation of the installed production capacity.
In order to look at the role of installed Per cent Production Capacity Utilisation (PPCU) on the energy
utilisation, Specific Energy Consumption and hence on the energy efficiency of the operation, further analysis
is carried out between the variables En and PPCU, SEC & PPCU.
From Equation (3) and Equation (4) we noticed that the Energy Efficiency Improves with the increase in
Production. Normally with increased production capacity utilisation, production of an industry increases.
Regression analyses were carried out to explore the relationship between EI and PPCU, and SEC and PPCU.
By the least square method, based on less percentage error of Y est, the best fit relationships are:
EI = 56.34 (PPCU)-0.56 ---------(5)
SEC = (PPCU)-0.76 ---------(6)
These two relationships confirm the earlier conclusions, that to improve the energy efficiency
of an industry, it is very essential to match the production of a industry with installed production capacity.
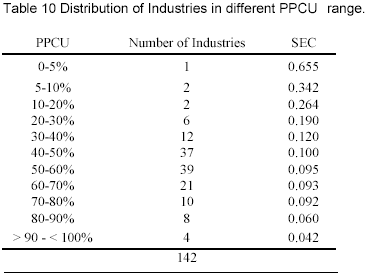
The next logical question which arises from these analyses is how much energy can be saved by optimal utilisation of the installed production capacity. Table 10 lists the SEC and PPCU in the Cashew processing
sector. Out of 142 industries, it is seen that in 99 industries the percent installed capacity utilisation is less
than 60%. Examining the two industries with PPCU of 50 and 80, the SEC for respective values would be as
shown in Equation (6) as:
SEC = 2.15 (50)-0.76 = 0.109
SEC = 2.15 (80)-076 = 0.076
That means there is 30.27% variation in SEC, which means 30.27% of the energy can be saved by proper
utilisation of installed production capacity. Figure 1 gives the plot of SEC and number of firms with Percent
Production Capacity Utilisation. A declining trend of SEC with increased PPCU is evident from this Figure.
The frequency of the number of firms in each PPCU range is a bell-shaped curve, which clearly shows about
69.72% of the total samples are in PPCU range less than 60%. This gives considerable scope for saving
fuelwood with better utilisation of installed production capacity.
Energy Auditing. Detailed energy audits were carried out in six cashew processing industries located in the Kumta taluk of Uttara Kannada (North Kanara) district on the coastal belt of Karnataka, by spending one to two days and measuring actual fuelwood consumption, raw materials etc. The details of energy consumption, raw materials and man-power are listed in Table 11.

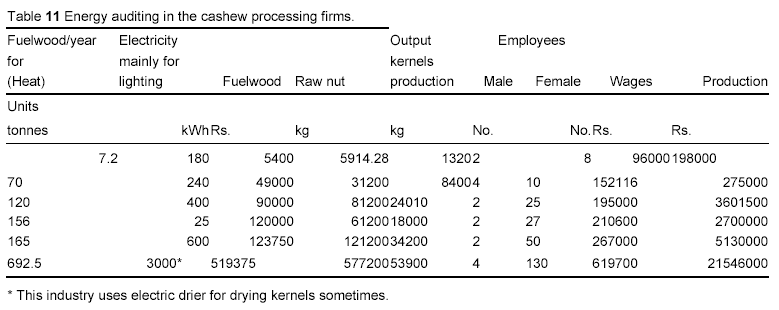
The energy analyses were carried out to explore the variation in SEC, EI and PPCU in these industrial units and the results are listed in Table 12. From Table 11 it is evident that these industries are labour intensive and mainly employ women. Since the wages paid are based on the amount of work done (that is quantity of nuts dehusked/peeling of kernels, etc.), these labourers seem to be one of the most efficient. The employment opportunity in these industries has created a new kind of social awareness among the women.
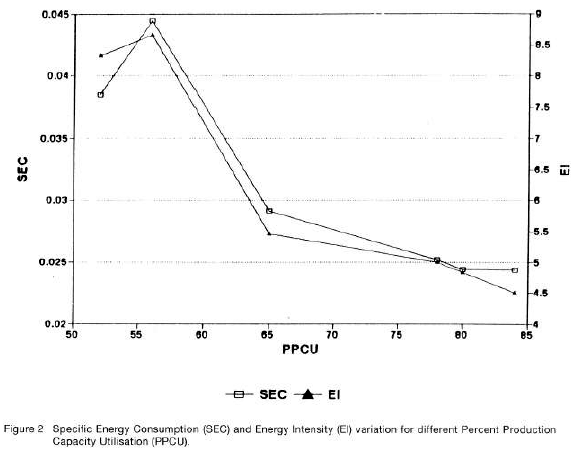
Since cashew is a cash crop, the SEC computed shows very small values. The discussion based on SEC seems to be insignificant. Hence EI (Energy Intensity) is computed which reveals distinctly the disparities in the level of fuelwood consumption in the other sector. It is noticed that the variation ranges from a minimum of 4.49 kg fuel wood per kg of cashew kernel processed to the maximum of 8.66 kg. The PPCU computed reveals that the high level of fuelwood consumption is related to the lower installed production capacity utilisation. Figure 2 is the pictorial representation of SEC/EI with the PPCU of firms where the detailed survey was carried out.
As listed in Table 12, it is evident that an industry with PPCU 52% consumes 8.32 kg of fuelwood while an industry with a PPCU of 84% consumes 4.49 kg of fuelwood. This means there is a 46% variation in the quantity of fuelwood consumed for processing cashew. This is mainly due to the non-utilisation of installed production
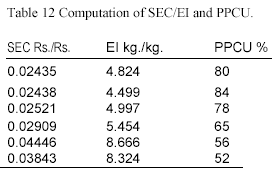
capacity. Roasting of raw nuts and drying of the kernel are the two energy intensive operations in these industries. The drier is used mainly to remove the moisture (in the order of 10%) in the kernel. High thermal efficiency could be achieved by the combustion of fuelwood in an enclosed chamber over a suitable grate with a proper opening for primary and secondary air to generate the highest combustion temperature and thus maxi mise the heat transferred to the trays. Proper insulation of the drier doors and a chimney of suitable height and diameter to create a draught and disperse smoke are the other essential components in cutting down the fuelwood consumption. In two out of six firms, the combustion was done in an open chamber and the drier doors were poorly insulated. Apart from these, the drier is not loaded fully in these firms.
(a) The fuelwood cost is relatively small in the processing of cash crops such as cashew compared to the value of
the end product. This is one of the reasons for not taking up energy conservation measures in these
industries.
(b) Easy access and availability of fuelwood both on a commercial and non-commercial basis are the main
reasons for the rural industries to use fuelwood. However, the fast depletion of forests has caused a fuelwood
scarcity which affects the domestic consumer severely while these industries continue to get fuelwood at
higher or increased cost. Nevertheless, the cost of fuelwood in the total production cost is very small in this
sector. The inefficient usage of fuelwood, in the order of 46 to 50%, could be conserved by proper
maintenance of equipment, better utilisation of installed production capacity and use of renewable sources of
energy such as solar energy for steaming raw nuts.
1. The wide variations in EI from 4.49 kg of
fuelwood/kg of kernel to 8.66 kg of fuelwood/kg of kernel reveals the scope for energy conservation to be in the order of
30 to 48%.
2. The relationship between SEC and Pr being a power law with an exponent less than one indicates an improvement of
the SEC with increased production in a industry. Computation of the dynamic SEC (dEn/dPr) reveals that the rate of
energy consumption is less than the production. The relative energy consumption rate decreases as the firm's production
increases.
3. The use of fuelwood for domestic and rural industries applications will continue in this region for at least another
decade. This study and earlier studies in the domestic sector have revealed that the present usage is very inefficient in
these sectors. About 40-45% of fuel wood is saved in domestic cooking and water heating purposes. This
necessitates a wider use of energy efficient end use devices to conserve energy. This helps in meeting the
growing demand of energy in a region.
4. Fuelwood consumption in cashew processing industries could be brought down by: (a) use of solar water
heating devices for roasting the raw nuts, and (b) the use of insulated, properly designed driers for drying the
kernels.
5. Encouraging enterpreneurs to grow energy plantations on already degraded and unused lands to meet the
fuelwood requirement for the industry in a sustainable way (while setting up energy intensive rural industries),
could help to improve the soil condition by avoiding further degradation and generate employment to rural
youth.
6. Decision makers should take into account the energy requirements of the industries while emphasising the
industrialisation of a region. The decentralised way of meeting the energy requirements of industries, e.g.
solar, wind (depending on availability of source), small hydro and energy plantations, would be the most
appropriate way of handling the energy situation in a region.
Cashew (Anacardium occidentale L.), is a small tree, crooked; originally introduced from South America. Every part of the cashew is useful to man. The kernels are of high nutritive value. It is rich in carbohydrate (22%), unsaturated fats (47%), minerals such as Calcium (0.55), Phosphorous (0.45%), Iron (5.0 mg/100gm), Vitamins (Vitamin B, 630 mg/100gm) and Riboflavin (190 mg/100gm). A kernel supplies about 6000 calories of energy per kg as against 3600 by cereals, 1800 by meat and 650 by fresh fruit. The cashew apple juice is rich in vitamin C (261.5 mg/ 100gm) content and contains 10.15 to 12.5 per cent sugar and about 0.35% acid (as Malic). The mesocarp of the shell contains black, caustic, oil juice which is rubefacient and vesicant. It contains phenolic compound cardol, anacardic acid and an ether soluble substance. It is a valuable raw material for a number of polymer based industries e.g. for paints, varnishes, resins, industrial and decorativelaminates, brake linings and rubber compounding resins. Cashew nut shell liquid (CNSL) is used extensively in boat manufacturing industries and carved wood works as it effectively prevents white ants. The delicious and nutritious kernel is commonly eaten roasted, a process which improves the flavour. Coating on the kernel yields tannins (24-26%) which is used in the leather industries. The cashew apple and its juice has a medicinal value for scurvy, cough and colds and is an excellent purgative. The juice is used as an antiscorbutic and diuretic; given in kidney troubles and cholera. The bud and young leaf is used as a vegetable and as green manure; the leaf contain tannins (23%) used in skin diseases; the alcoholic extract shows hypoglycemic and anticancer activity [8].
In addition, cashew trees are used for firewood or charcoal. The pulp from the wood is used to fabricate corrugated and hard bound boxes. The bark of the tree yield& tannins (9%), and possesses an antihypertensive and hypoglycaemic properties; the milky sap, on exposure becomes black, useful in indelible ink. Gum from the bark, has insecticidal properties useful in book binding and pharmaceutical industry.
Cashew is familiarly known as "money spinner" among plantation crops due to the various uses of the tree ranging from land reclamation to medicinal purposes, and finds a unique place in our ecosystem. In Karnataka 4.04 lakh hectares of land are barren, sandy, slightly alkaline and poor in nutrients. Of this, 14,000 hectares is in the Uttara Kannada District. This could be used for cashew plantation and energy plantations. Casuarina equisetifolia, Acacia auriculiformis, Anacardium occidentale are best suited for this soil. Cashew because of versatility, and its ability to survive on saline land, laterite and red soils, is a very important tree in Agro and social forestry because of its distinctive role in land reclamation. It is usually closely planted for effective wide breaks for orchards and as soil binders.
Thanks are due to the officials of the Small Scale Industries Service Institute, Directorate of Industries and Commerce, Karnataka Department and Management of Small Scale Industries in Kumta Taluk for their help in our field survey. I am grateful to Dr. N. V. Joshi, Professor D. K. Subramanian and Professor Mallikarjuna Chetty for reviewing the manuscript and for useful suggestions. The field work involved in this research was supported . by the working expenses provided by our Institute.
1. Ramachandra, T. V. "Energy Options for Sustainable Development". Energy Management, Vol. 17, Jan-
Mar 1993, pp. 12-19.
2. Ramachandra, T. V. and Subramanian, D. K. "Energy Efficiencies of End-use Devices in an Electro
Metallurgical Industry: a Critical Study". Energy Conversion and Management, Vol. 33, No. 10, 1992, pp. 899-
912.
3. Subramanian, D. K. "Energy Utilisation in Karnataka". in C. J. Saldanha, ed., State of Environment Report
Karnataka, Centre for Taxonomic Studies, Bangalore, India, 1985. pp.103-123.
4. Government of Karnataka. "Economic Survey 1994-95". Science and Technology Department,
Government of Karnataka, Bangalore, India, 1995.
5. Development Commissioner, Ministry of Industry, Government of India, 1990. "Second all India Census of
SSI units Registered up to 1988 - Vol. I & II", Government of India, New Delhi, India.
6. Ramachandra, T. V. "Efficient Wood Energy Devices for Cooking and Water Heating Purposes".
Proceedings of the ECOTECH '94 computer conference, Ed. Eng-Leong Foo, UNESCO microbial resource
centre, Stockholm, Sweden, 1994.
7. Gazatteer of India, 1985. "Uttara Kannada District". ed. Suryanath U. Kamath, Karnataka State Gazetteer,
Government of Karanataka.
8. Nambiar, M. C., Bhasakara Rao, E. V. V. and Tenkamma Pillai, P. K. "Cashew" in T. K. Bose, S. K. Mitra,
ed. Fruits: Tropical and Sub Tropical, Naya Prokash, Calcutta, 1994, pp. 386-419.