Conservation through end use efficiency and good house keeping practices are the most effective ways to provide immediate relief for energy scarcity. This will help to maintain economic growth and social progress of a region. Environmental problems, resource depletion and growing demand of energy in the state/region make it increasingly imperative that energy is used as efficiently as possible.
This paper discusses an attempt to illustrate the industrial energy scene in Karnataka, India and the possibilities for energy conservation. Analysis of energy consumption data of Karnataka and India shows that the per capita consumption of energy is low (compared with 32 countries in the world). However, for the industrial sector, energy per state domestic product is at least 10-20 times higher compared to that of industrialised countries. This implies inefficiency in energy utilisation.
Detailed investigation of the Industrial sector, through analysis of Specific Energy Consumption (SEC) - industry wise and year wise for a seven year period reveals that about 28% energy could be saved in the industrial sector. This, when quantified, accounts for a saving of 2.25 mtoe of energy or 1541 million kWh electrical energy per year in Karnataka. Such a saving is equivalent to the energy output of 300 MW (Mega Watts) electric power generating units (hydro/thermal).
Energy is the key element in production processes, hence any energy shortage has a serious effect on the economy of the country. The economic development of a region depends, ultimately, on the extent and composition of natural resources. Therefore, in India, the structure of agricultural and industrial production has become good indicators of the economy.
Energy utilisation in India and in Karnataka state differs radically from that of industrialised countries. Locally gathered sources of energy such as firewood, agricultural residues (i.e "non commercial energy") constitutes the main source of energy in rural areas whereas "commercial" energy supply is dominant elsewhere. In India, energy planning is not an integrated activity, instead the component parts (electricity, oil, coal, and firewood etc.) are developed in isolation. Also, energy planning is based on projected growth (in line with economic growth) rather than based on developing an energy efficiency strategy. A further problem is that this growth in demand for energy can conflict with environmental quality goals. The solution is to minimise the use of non renewable sources of energy and to maximise the efficiency of end use devices, combined with maximising the use of renewable sources.
Initially energy use per capita was used as an index of development. Energy per capita is quite small for developing countries and high for developed countries. However this approach does not reveal any picture of development or efficiency of usage. To achieve this it is necessary to look at energy intensity, that is energy per GDP (Gross Domestic product).
A comparative study of energy use, mainly electrical, in industries in Karnataka and in those of some other industrialised countries reveals that Karnataka consumes between 2 and 6 times the energy used in developed countries for the same GDP.
Linkages between energy sources and the impact of substitution of energy from one source by that from another can be understood only if there is an integrated picture of energy use. Since this type of information was not available, the energy analysis presented in this paper was confined to the utilisation of electrical energy alone. Results are based on two surveys covering many Industries in Karnataka. The first survey was based on a questionnaire sent to more than 250 industries covering energy consumption for the pericd 1980-1985. Replies were received from about 60 industries. The second survey was based on a questionnaire sent to 510 industries, covering the years 1990-1991 and 1991-1992, for which there were 78 replies. The results revealed that, in many industrial sectors, energy consumption/ rupee of production was higher than the Indian norm. Also results showed that energy consumption varied considerably within a group or sector, indicating a distinct possibility for a substantial reduction in energy use by many industries for the same level of production. Similarly, a look at the specific energy consumption by industry over a five year period shows an increase in some industries and, fortunately, a reduction in some others.
Electrical energy analysis reveals that 40% of electrical load is for space heating. This could be easily replaced by other sources such as coal, oil, firewood etc. The greatest possibilities for more efficient use of energy in industry is in the careful management of process heat, electricity, energy intensive materials and direct fuel consumption. Processes involving energy intensive operations or materials are reviewed in this paper to determine if new technology, recycling, substitution, or alternative forms of material or energy could be employed to increase efficiency. The introduction of new technologies involve capital investment and therefore there is a poor response to this approach. However, the energy analyses presented, in intra sub sectors, shows that there is a good scope for energy saving (by good housekeeping etc.) of the order of 5 to 36%.
The objectives of this paper are to:
1. Review and compare sector energy consumption patterns in industries in Karnataka in terms of efficient usage;
2. Compute energy performance indices (namely Specific Energy Consumption (SEC) and Energy Elasticity (C)) to identify energy intensive industries/groups;
3. Assess the temporal variation of performance indices;
4. Estimate energy saving potential in the industrial sector.
ENERGY SCENE IN INDIA
To understand the kind of resource used by different sectors of usage, it is important to review the energy use trends of India and Karnataka over recent years. Coal is the predominant energy source (58%), followed by oil (27%), natural gas (7%), lignite (4%), hydro power (3%) and nuclear power (0.22%). Non commercial sources of energy (i.e. collected by individual users) playa dominant role in energy use and is estimated to be 143 million tonnes of oil equivalent (mtoe), representing 70% of total energy use during 1972-73, and 186 mtoe (45%) during 1994-95.
To illustrate the consumption by various sectors, the sector-wise consumption pattern is reviewed from 1980-81. The industrial sector is one of the major consumers of commercial energy, with a share of 50% in 1994-95 (148.6 mtoe). This is followed by the transport sector, with a share of 22% (mostly met by oil). The consumption of commercial energy by the agricultural and residential sectors are low. The annual growth rate in electricity consumption in India between 1950-1994 has been 10%. In 1993-94 the per capita consumption was approximately 299 kWh. The commercial sector, comprising offices, hotels, etc, accounts for 5 to 6% of total electricity consumption.
KARNATAKA'S ENERGY SCENE
Karnataka state depends both on commercial and non commercial forms of energy [2-5]. Karnataka has no coal deposits and therefore must import it. For a long time, electrical energy for Karnataka was purely hydro but now it has recently commissioned the Raichur coal power station. The region's other major need - oil - is also not available in Karnataka. Electricity is the major commercial energy source (56% for 1990-91). Firewood consumption is around 7.44 mtoe i.e., 43% of the overall energy consumed. Agro wastes have a 9% share. This demonstrates dependency on biomass to meet rural energy needs. Sector wise consumption of commercial energy in Karnataka shows that industry accounts for 51 % of energy consumption, followed by transport (23.0%), households (11 %), and agriculture (3.5%). Similar trends were observed for the year 1995-96 and 1996-97.
Electrical Energy Use in Karnataka. Since electrical energy plays a dominant role in Karnataka, it is reviewed in detail in this section. Actual electrical energy use and availability during the last eight years were studied with the help of energy availability data. Installed electrical energy capacity in 1994 was 3168 MW, out of which 80% was by hydro production (2538 MW) and the remainder by thermal (coal) power (630 MW). The gross energy generation from these sources for six
years, shows that it ranged from 12430-14907 million units (million kWh). Electrical energy met from central source during these years ranged from 3061-3670 million units [6].
The plant load factor for Raichur varied from 34% (in 1985-86) to 65% (in 1994-95). The variation of transmission and distribution losses ranged from 25% (in 1980-81) to 19% in 1993-94. The average loss based on the last 15 years of data was approximately 21 %. Rural electrification progress can be seen from the fact that almost 98% of villages (26483 villages out of 27028 villages) were electrified by 1993 in Karnataka [7].
In last 25 years, total electrical energy consumption varied from 2338.5 to 14108 million units. In this period, energy consumption for agricultural pump-sets has increased by almost 40-fold (from 149.3 to 6105 million units), the domestic sector has increased by a factor of 14.1 ( 150.3 to 2275 million units) and HT industries by a factor of (1519 to 4106 million units). Sector wise, electrical energy consumption shows that, during 1989-90, industry consumed 4780 million units (45% of production), followed by irrigation pump-sets (with a share of 29%). The share taken by irrigation pump-sets has since gradually increased, accounting for 43% of total electrical energy in 1993-94. This is followed by industry, with a share of 29%. The analysis in the next section looks at these details from the supply end. A sectorial analysis of electricity users in Karnataka shows that the growth of connected load is mainly distributed between two categories - AEH (All Electric Homes) and Small Scale (L T) Industries. The growth rate is just over 19% for the former and 27% for the latter. Growth over the past four years are 67% and 55% respectively. If we look at the annual increases in the number of installations, L T industry has a very high rate of almost 39%, followed by AEH with a rate of 19%. More than 50% of Karnataka industry is clustered in and around Bangalore. Energy consumption patterns show that Bangalore accounts for almost 27% of HT energy. A few industries, such as aluminum, iron and steel show higher energy consumption values for some divisions. Belgaum consumes almost 22% of total HT energy in the State. Sector-wise, commercial energy consumption data shows that industry in Bangalore accounts for almost 69% of total consumption and is the major energy consumer in Karnataka. This industrial share is much higher compared to that of most industrialised countries such as USA (17%), Japan (20%) etc. Therefore the industrial sector is reviewed in further detail below.
Comparisons of energy use in different countries and efficiency of usage.
Comparisons of per capita consumption of energy (PCCE): Whenever we talk about energy usage an index, usually used to measure the development of a country, is Per Capita Consumption of Energy (PCCE). We have compared Karnataka's and India's per capita energy consumption data with that of 32 countries representing all continents [1, 8]. The Per Capita Consumption of Commercial energy computed for Karnataka and India (based on 1991 population census data) is about 0.180 and 0.214 toe. By including non commercial energy use, the total energy, per capita, energy consumption becomes 0.38 for Karnataka and 0.4 7 for India. These are low compared to, for example, the U.K. (3.6 toe) and USA (7.7 toe). Hence per capita energy consumption in industrialised countries such as the U.K. and USA are approximately 10-21 times higher than that of Karnataka. A similar situation prevailed for 1993-94. This implies a need to increase energy consumption but the efficiency of consumption also needs to be analysed. To compare PCCE's country-wise, we have normalised PCCE with respect to the USA (set to 100). The normalised PCCE value for Karnataka and India are 2.33 and 2.77 respectively. By inclusion of "non commercial" energy sources, these values become 4.85 for Karnataka and 6.00 for India.
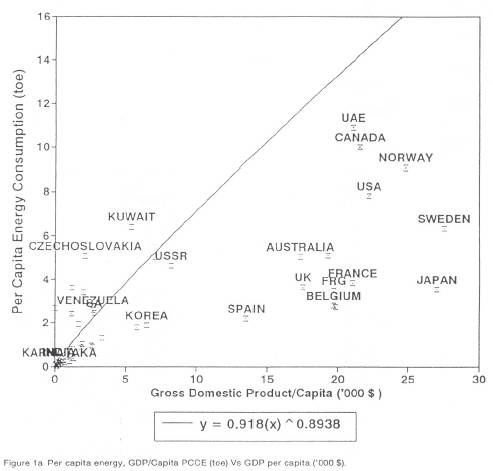
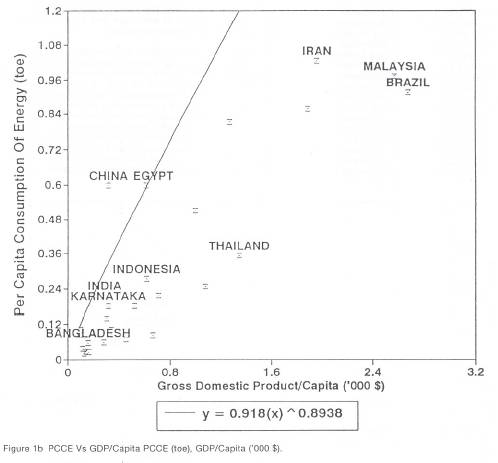
Relationship between gross domestic product (GDP) and PCCE: A second indicator of energy usage is the relationship between energy consumption per capita and gross domestic product per capita. Per capita energy consumptions between the developing countries are similar, with a narrow band of variation. For high income countries, the difference in PCCE's is much larger. The Per Capita Energy Consumption computed by including non commercial energy sources is given in parentheses in Table 1. In developing countries such as India, Nigeria and Pakistan, the share of non commercial energy is more than 50%. But, cross country comparisons can be misleading and inappropriate due to large variations among countries in terms of economic structure, climate, geographic location etc. Figure 1 a plots energy consumption per capita with GDP per capita. The Figure shows, that there is a strong correlation between national output per capita and energy per capita. Figure 1 a gives the relationship for all countries and Figure 1 b is the plot for low income countries.
Comparisons of SEC's: For industrial production comparisons, a useful energy measure is energy/GDP i.e. the amount of energy consumed for producing 1 unit of GDP. Table 1 gives the energy-output relationships for 32 countries and Karnataka State in increasing order of GDP per capita. This includes, for each country, energy use per capita (PCCE), energy intensity or specific energy consumption (both excluding and including non commercial (traditional) energy. This index of energy/GDP is given in column 6 of Table 1. This index also reflects the efficiency of energy use at a macro level.
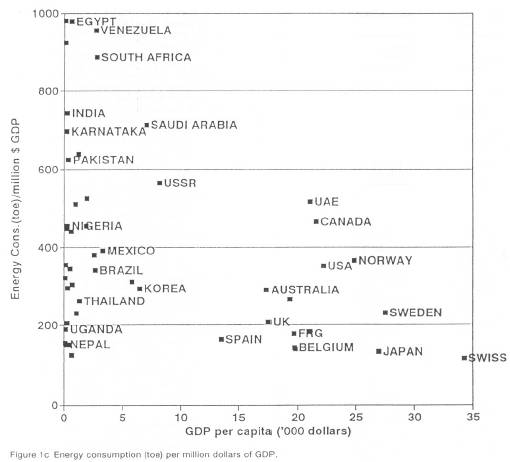
Column 6 gives the absolute values of energy/GDP in toe per million dollars. The value for Canada is 464, Norway 366 and for U.S.A. 352. Japan and France with values of 132 and 183 respectively are on the low side. Figure 1 c gives country wise energy consumption per GDP vs. GDP per capita. Although per capita energy use increases with higher GDP, Figure 1 c implies that there is no correlation between GDP and Energy/GDP.
To compare country wise SEC's, it is desirable to normalise SEC with respect to one country. We have computed normalised SEC by equating USA's SEC value to 100. Column 7 presents a relative figure for countries. India has an energy intensity value of 754 toe/million dollars and Karnataka State has a value of 697 toe/million dollars. With the inclusion of the non commercial energy share, India's energy intensity increases to 1628 while, for Karnataka, it is 1469 (these values are given in parentheses). Thus, for the same output, India consumes 2.14 times more energy than the USA, four times more than France and six times more than Japan, However, these calculations do not include the "animate" energy share (i.e. such as human and animal energy). If these are quantified and included, then the energy/GDP for India would increase further. The above analyses clearly shows that Karnataka state and India have good potential for energy conservation.
During 1994, India's SEC was almost 784 toe/ m$ compared to USA's 305, and Japan's 110. This shows the increasing energy intensity for
India compared to a decline for Japan, and the USA. To understand the reason behind the differences in SEC's amongst countries, we need to undertake similar analyses on sectoral energy uses and industrial composition etc. The second factor seen is that the energy/SDP is increasing for Karnataka (648 in 1985-86, 697 in 1990 and 713 in 1991). Post oil crisis situations saw considerable reductions in energy/GDP for several countries such as West Germany, UK, Netherlands and the USA. For example, West Germany showed a decrease from 1,080 to 1,010; Karnataka, on the other hand, has shown an increase of about 10% in 5 years. Hence, it is desirable to actively pursue the introduction of energy efficient methods.
Comparisons of SEC after removing the effects of space heating: Due to adverse weather conditions, most industrialised countries use a significant amount of energy for space heating. Karnataka is fortunate in having a good climate which does not require space heating during most months in a year. Only during the heavy monsoon season is there a small amount of heating demand in the hilly region. Therefore, if we adjust the Energy/GDP for space heating, we get the results as shown in Table 2. Here we have subtracted the component for space heating from the total for the industrialised countries and computed Energy/ GDP. The value for USA reduces to 313. Normalising the USA value at 100, the relative values computed for Karnataka and India is 222
Table 2 Energy/GPO relationships adjusted for space heating.
|
Energy (toe)/ |
|
Country |
millions $ GDP |
Index (USA = 100) |
USA |
313.36 |
100 |
Canada |
408.51 |
130.36 |
France |
160.71 |
51.28 |
West Germany |
157.64 |
50.3 |
UK |
185.02 |
59.04 |
Sweden |
202.95 |
64.76 |
Switzerland |
101.23 |
32.3 |
Belgium |
126.7 |
40.43 |
Karnataka |
696.78 (1468.99) |
222.35 (468.78) |
India |
654.12 (1628.47) |
240.66 (519.68) |
and 241 respectively. Inclusion of non-commercial energy sources, in the total energy, leads to SEC figures of 469 for Karnataka and 520 for India (about 5.2 times more than USA). Compared to France, Karnataka's consumption is about 10 times. This relatively higher specific consumption of energy but low per capita consumption of energy, compared to developed countries, further implies that our energy consumption is inefficient and that there is a vast scope for improvement. If we reach the same level as the USA for SEC, Karnataka's energy consumption will be less than half of the actual value for the present level of GDP.
Comparisons of sectoralSEC's: To analyse energy intensity trends, energy/SDP values for various sectors in Karnataka were computed. The index used in this context is the energy consumption in toe per crore rupees of the sector's contribution to SDP. The SEC value for the agricultural sector is very low (372) whereas, the value for the transport sector is very high (9115). The industrial sector has energy/SDP values of 7989 for 1990-91. Since the industrial sector has a mix of many sources and devices, its energy consumption is high and also it has a higher value of SEC. This makes it a good candidate for international comparison.
Comparison of energy consumption for the industrial sector in different countries: The per cent ratio of industrial energy to total energy, among several countries, shows that many countries consume about 30% of their total energy for industrial purposes. The Industrial share of Karnataka is 44%, India is 51 % and Japan is 45%. The quantum of electrical energy consumed by industry, as a percentage of total industrial energy, illustrates that, even countries such as the USA, UK, West Germany, France etc. resort to electrical energy for a smaller fraction of their requirements (about 15-17%). In comparison and despite power cuts, 69% of Karnataka's industrial energy needs is met with electrical supply. Since electricity is a derived secondary energy source, it is inefficient to use it for low quality work (such as space heating). Consumption data reveals, however, that electricity is used for heating in many industries in Karnataka and this may be a reason for the higher industrial SEC values. In addition to aggregated international comparisons of industrial energy use, it is also useful to make comparisons for individual industrial activities. This is undertaken below.
The comparative energy analysis shows that there is a sizable inefficiency in Karnataka's energy consumption. Since the industrial sector is one of the major consumers of energy, this sector was investigated in more detail. The various stages in performing this analysis were:
1. Evaluate SEC and make comparisons for each group, based on maximum/ minimum SEC's;
2. Calculate of energy elasticity;
3. Calculate the energy savings possible in each group assuming that every company in a group has an SEC equal to the minimum value for the group.
It is necessary to know (i) how efficiently energy is used by a manufacturing unit, (ii) how efficiency has changed over time and (iii) how consumption ,compares among units manufacturing the same product.
In order to look at these problems, various energy performance indices such as Specific Energy Consumption (SEC) were computed within each industry sub-sector for each year. These calculations were used to determine the average, standard deviation, maximum and minimum SEC values for each industry. To calculate year to year changes in SEC, ratio's were computed. In order to get an overall assessment of change in SEC ratio over time, average and standard deviations of SEC ratios were computed for each sub-sector.
INDUSTRIES IN KARNATAKA
Industry plays a pivotal role in the development of Karnataka state. This sector accounts for nearly a quarter of the state income in real terms of the total output in the economy. The average annual growth rate of industrial production over the period from 1981-82 to 1990-91 was about 6.4% as against 7.9% in the country as reflected in the index of industrial production.
Sector-wise analysis for the period 1981/82 to 1994/95 shows that the highest growth rate of 40% was recorded in the manufacturing sector, followed by the electrical sector (38%) and Mining sector (21%).
ANALYSIS OF DATA, RESULTS AND DISCUSSION |
Data compiled from the five rounds of primary survey were compiled and analysed to determine the level of energy consumption in the industrial sector of Karnataka. Fortunately, a wide range of industries responded to both the fourth and fifth round surveys (1981-85 and 1991-2 respectively). There were a number of industries for the groups of engineering, metallurgical, paper, textile and sugar industries. Apart from Aluminium production, all other major industrial types responded. The producers included glass, batteries, watches, oxygen, fertilisers, steel, electronics, tools, tiles, cement, and heavy engineering companies. Hence the results represent information from a wide cross section of industry types.
Energy consumption in industries. Data pertaining to energy were analysed. Since absolute energy consumption patterns do not provide any indication, we used a standard unit and calculated energy consumption in million units equivalent (million kWh).The following points emerge from the analyses:
(i) Total energy consumed by these industries is nearly 5.28 mtoe;
(ii) The electrical energy component is only 1,175 million units. This is less than 50% of total electrical energy consumed by industries in the state as a whole;
(iii) Fortunately, there is a good balance in the industries consuming different types of fuels. For example, paper, textile and cement industries use coal as their primary fuel; sugar industries consume mainly bagasse; metallurgical industries use coke and charcoal; chemicals and metallurgical use furnace oil. Electricity and diesel are used by most of the industries.
(iv) Electricity constitutes 19.2% of total energy; coal is the maximum at 41%, others - coke, bagasse, LPG, Kerosene - form 25% of the total. Firewood use is quite small and is mainly restricted to sugar, textiles, tiles and metallurgical industries.
To understand the significance of the predominant type of fuels consumed, percentages were calculated. It shows that electricity constitutes the major component in the energy mix 10' the sub sectors such as Electrical I (99%), Electrical II (65%), Metallurgical I (65%), Metallurgical III (58%), and Heavy Engineering III (54.5%). Diesel follows electrical energy in most of the sectors such as Heavy Engineering III (45.5%), Heavy Engineering II (56%), Electrical II (35%) etc. The next stage of analysis is to calculate specific energy consumption.
Specific energy consumption in different industries (1981-84). The evaluation of energy use in industry, based on consumption and production, is the first time that such a study has taken place in India. One of the main aims in doing this study was to move towards generating norms for specific energy consumption. The other aims were (i) to compare similar units (ii) to see the dynamics, i.e. SEC change with time for industries. .
A look at the total energy consumed by each sector - reveals that metallurgical iron and steel industries consume the maximum amount of energy, followed by paper (1358.4 million units), and sugar (844.2 million units). Engineering units consume less energy. The average, maximum value, minimum value and standard deviation have also been computed for SEC for each sub category. The average SEC values vary from 0.05 to 1.73. The standard deviation gives an indication of the variations in SEC.
One way of interpreting SEC is to assume that lower SEC's imply better efficiency because less energy is consumed for the same amount of production. But looking at SEC's for each industrial group can also help in classifying industries as energy intensive or non intensive. This is useful in the selection of industries to be nurtured in future in the state. Instead of concentrating on higher intensity industries, one can look for and select lower intensity industries or, at least, try to obtain an optimal mix. In this connection, it may be recalled that Karnataka has an overall energy intensity of 1.96 which is higher than the national level.
Since norms are available for electrical energy, the electrical energy consumed/unit of production was also calculated. Some industries, e.g. sugar, use the least amount of electrical energy and some have a higher intensity for electricity. The SEC for electrical energy per rupee of production varies from 0.081 to 0.45. From the point of view of electricity, an industry such as oxygen has become energy intensive whereas, from its overall SEC, it is not a highly intensive industry. So when we have acute shortages in electricity, we can use SEC for electricity to characterise the intensity of industries and use this for the selection of future industries.
The SEC is very useful for analysing individual members in an industrial group since this may reveal useful information. Some examples are cited below:
(i) In the case of paper, the minimum SEC is 12510 and the maximum is 17245 (38% higher). This shows that energy consumption can be improved by improving efficiency to the scale of the minimum SEC producer. This also means that the difference is not due to technology;
(ii) In the case of sugar, the minimum SEC is 5264 units/tonne and the maximum is 11162 (112% higher). Again, therefore, a significant reduction in energy use should be possible;
(iil) For tiles, the minimum value is 4.55 and the maximum is 7.65 (68% higher);
(iv) For textiles, the difference of 52%; (v) Oxygen units have a difference 70%.
The above illustrations show that there is a high probability of efficiency enhancements. It may also be possible that, in some situations, the difference in SEC is due to the quality of the product and not due to energy efficiencies. But, whenever large differences occur, for similar products, it is desirable to look deeper for the reasons.
The intra group variations in SEC may only show a probability of improvement. Actual improvements can be identified only by a detailed study for the industry concerned. Since energy plays an important role in our life, it is desirable to undertake energy audits and energy budgeting. It is a very redeeming feature that many industries of Karnataka are aware of the energy shortages and energy environment linkages. Some industries are already initiating steps to increase the efficiency of energy use. This can be seen from the study of variations in SEC over five years.
Comparison of efficiency for electrical energy with respect to others: Table 3 compares the difference between the ratio of electrical energy to total energy and the ratio of SEC for electrical energy to SEC for total energy. These two ratios should be the same if the industries in the group have similar consumption patterns and efficiencies. A difference (such as in the case of paper or tiles or engineering groups) indicates uneven patterns. Based on this we can categorise these sub sectors into three groups: 1) Group 1: consisting of sectors such as sugar, chemicals, metallurgical I and II, wherein the difference is less than 5%, 2) Group 2: consisting of sectors such as tiles wherein the difference is less than 10%, 3) Group 3 consisting of engineering, metallurgical III and paper, wherein the difference is more than 10%.
Table 3 Comparison of percent electrical energy to SEC to total, and % ratio of SEC for electric to total.
Sector |
Ratio of electric energy to total |
% ratio of SEC to electric to total |
Engineering |
25.20 |
36.80 |
Metallurgical I |
64.90 |
63.10 |
Metallurgical II |
25.40 |
26.00 |
Metallurgical III |
58.10 |
41.10 |
Paper |
8.90 |
13.50 |
Sugar |
0.50 |
0.50 |
Chemicals |
43.90 |
43.60 |
Tiles |
2.50 |
0.36 |
Oxygen |
100.00 |
100.00 |
Energy generated by captive diesel sets was very small in 1979-80. The per cent ratio between self generation and purchased energy from KEB was only 0.22; but this ratio has increased to 17% in 1983-84. Based on the statistics compiled by KEB (Karnataka Electricity Board) between 10% 11 % of industrial units with capacities of over 100 kW or having a contract demand of at least 500 kVA use diesel sets. The ratio of self generation to purchased energy from KEB is 18.24%. The sector-wise installed capacity of captive power plants, in 1989-90 shows that the total installed capacity is about 447.2 MW. The cement sector has the highest captive generating capacity of 109.6 MW (24.5%) followed by the sugar sector (83.9 MW), the fertiliser sector (74.3 MW), paper (43.9 MW), textiles (25 MW) and iron & steel (1.6 MW).
It is not necessary for electrical energy to be used for space heating. To a large extent, substitution with lower quality energy is desirable. Such a substitution will not only match source with end uses, but also increase the efficiency of use. This is true in other sectors also. The percentage of connected load shows that almost 47% of the electrical load is used in space heating. This reinforces the points mentioned above.
SEC ratio's in various sub sectors (1981-85): The results of detailed analysis carried out, industry wise for various sectors for five years show that: the cement sector has a maximum SEC value of 0.483(avg) +/-0.091 (Std) followed by Iron are with an SEC value of 0.441 +/-0.190, textiles with a value of 0.296 +/-0.090, paper 0.288 +/-0.071 and chemicals 0.263 +/-0.121 etc.
SEC ratios computed for two consecutive years reveal increases in SEC in most industries. This ratio, being greater than one, reveals an increase in inefficiency. A ratio < 1 indicates an improvement in energy usage per unit of production. This has occurred in the cement, chemicals, food products, glass and tiles sub sectors.
Specific energy consumptions in different industries (1991/92 and 1992/93): The SEC and SEC ratios, computed for the years 1991/92 and 1992/93, shows that the cement sector, with an average SEC of 0.502 +/- 0.035, is one of the most energy intensive sectors. This is followed by paper (0.376:t 0.017), accessories (0.312+/-0.053), textiles (0.296 +/-0.120), iron ore (0.251 +/-0.036), chemicals (0.160 +/-0.009) and steel(0.157 +/-0.001). Sectors such as sugar (SEC 0.073 +/-0.029) and electrical (0.069 +/-0,017) are least energy intensive sectors.
The conventional belief is that improving the efficiency of end use devices would involve major technology changes and hence further capital investment. Thus conservation implies the need to invest in large scale retrofitting of existing facilities or replacing them with more energy efficient processes. Our study of industry sub sectors, however, shows that two industries manufacturing similar products based on same technology have different SEC's. This means there is scope for saving energy without any investment, just by proper operation of machinery and good house keeping practices.
Energy elasticity. The energy elasticity has been computed for various industries for the years 1991/92 and 1992/93. The value of "c" > 1, indicates a higher growth in energy consumption, while C < 1, indicates a decline in energy consumption in the subsequent year for the same unit of production.
The year wise computation of energy elasticity for the period 1980 to 1985 and for the ten year period (i.e. 1991/1982 and 1992/1983) have been calculated. These values substantiate earlier findings, that is that most of the industrial sectors such as chemicals (SEC91/82 = 1.997, SEC92/83 = 2.73), iron ore (SEC91/82 = 1.371, SEC92/83 = 1.676), accessories (SEC91/82 = 2.113, SEC 92/83 = 2.110), lamps (SEC92/83 = 2.47), steel (SEC1991/82 = 1.397, SEC 1992/83 = 1.038) and textiles (SEC1991/82 = 3.983) show an increase in energy consumption and are energy inefficient.
Energy saving potential in industries sector in Karnataka. It is seen from the SEC values for seven years that, in iron and steel production almost 29% energy reduction is possible. There is also a vast scope for savings in sugar (34%), the engineering sector(41 %), textiles(36%), fertilisers (44%), insulators (33%), iron are (32%), Chemicals (33%), Cement(22%). Overall a total energy saving of almost 28% is possible. This amounts to a saving of 2.25 mtoe out of the 8.105 mtoe commercial energy used in Karnataka. In terms of electrical energy, 1541 million units of electricity (equivalent to a 300 MW generating unit) could be saved. Environmental problems associated with mega projects, pollution, nuclear waste disposal problems and resource depletion make it increasingly imperative that our planners divert their attention towards improving energy efficiency in all sectors. This research illustrates that there is ample scope to conserve energy in the industrial sector.
1. A study of electrical energy and power distribution throughout the state reveals a large spatial disparity in energy use with most of the use being concentrated in Bangalore and one or two singular points.
2. Even though energy consumption/capita is low, energy/SDP for Karnataka is quite high. This is true, especially for the industrial sector. The energy/SDP for the industrial sector in Karnataka is 10-20 times higher than that of some industrialised countries. This shows that there is much potential for improving energy efficiency in industry.
3. Electrical energy forms a major component in the industrial energy use. The per cent of electrical energy to total energy use is also higher for Karnataka (69%) than many industrialised countries. Since electrical energy is of "high quality", it should be used only for high quality work.
4. Both total energy and electrical energy consumption per rupee of production for various industrial groups have been calculated. These serve as comparative indicators for industries in the same group.
5. The specific energy consumption within a group varies very widely - in some cases a variation of about 100% or more exists. This shows that we can definitely reduce energy use through conservation measures.
6. The specific energy consumption for various industrial activities have been calculated for a period of seven years. Temporal variations show an increase in SEC in many industries. In some cases there is a decrease - a welcome measure.
7. A study of electrical load patterns indicates that about 40% of the load is used for heating. To relieve electrical demand, heating should be converted to other energy sources.
8. SEC ratios, based on 1981-85 and 1990-92 data, show that most industrial sectors have ratios > 1. This shows increasing energy inefficiency. Energy elasticity, computed for these sectors, also confirm that inefficiencies in these sectors are increasing with time.
9. This study only reveals the possibilities of energy conservation. Actual measures depend on studies of individual industrial units. Therefore, energy budgeting and auditing measures in many major industries should be initiated. The research and development must be undertaken now in order to make the necessary major contributions in the decades following the year 2000.
kg kilogram
t metric tonnes
kWh kilowatt hour (also referred as units)
kW kilo watt
MW megawatt
mtoe million tonnes of oil equivalent for the purposes of presenting energy balances, we have used million tons of oil equivalent (mtoe) as the unit for comparison. A unit of primary electricity may be equated theoretically with the amount of coal or oil required to produce an equivalent unit of thermal electricity. In the case of hydro electricity, assuming the ideal conditions (100% efficiency), a million kWh is taken as 3.6 TJ (terra joules), which corresponds to 0.086 tons of oil equivalent per 1000 kWh or 0.123 tons of coal equivalent.
One tonne of oil equivalent means 41.868 gigajoules (0.0418 TJ or 107 kilo calories). This quantity of energy is, within a few percent, equal to the net heat content of 1 tonne of crude oil [1].
PCCE Per Capita Consumption of Energy: energy consumption per person or habitant is an indicator of energy intensity.
Included in the consumption of Commercial energy are primary forms of solid fuels, petroleum products including feed stocks, natural gasoline, natural gas, production of primary electricity and net imports of electricity. Total energy consumption includes commercial energy (listed above) plus traditional fuels such as fuel-wood, charcoal, agricultural and animal residues. Thus:
Consumption = Production + Imports - Exports - Non energy uses - Bunkers +/- Variation in stocks.
GDP Gross Domestic Product or GDP is the gross income generated within a country (i.e. it excludes net incomes received from abroad).
SDP State Domestic Product is the GDP of the state.
GDP/Capita Gross Domestic Product per person, an indicator of economic intensity.
Energy/GDP amount of energy consumed for producing 1 unit (Rs/$) of GDP or SDP. This is also referred to as Specific Energy Consumption (SEC).
Energy Performance Indices - Definition.
(i) Specific Energy Consumption (SEC) : Specific Energy Consumption (SEC) is energy consumption (in rupees) per rupee of production [14] and given by: SEC = Energy (Rs)/Production (Rs). The variation in Specific Energy Consumptions for different industries, with time is computed by:
SEC = E1/P1
Where Et = Total energy consumption in the period "t" (in this case "t" is one year) and pt = Production in the period "t". From a knowledge of SEC, minimum energy required to operate the industries efficiently could be predicted.
(ii) Energy Elasticity: The relationship between En (energy consumption) and Pr (Production) for industries sector, through regression analysis is En = A (Pr)c, coefficient "c" is commonly known as energy elasticity. By differentiating both sides, we get:
C = (dE/E)/(dP/P)
or
C = {(E2/E1) 1} / {(P2/P1) - 1 }
(iii) Energy Saving Possible: Percentage saving possible per industry is given by:
% Savings Possible = {[{SEC)avg - SEC(min)]* 100} / (SEC)avg
(SEC)avg = average SEC computed from temporal data
SEC(min) = minimum SEC from temporal data.
We are grateful to Professor N. V. Joshi and Professor K. M. Chetty for suggestions and many useful ideas. This work was supported by grants from the Ministry of Environment and Forests, Government of India. Many industries cooperated with us in the collection of this data. Without their cooperation it would have been impossible to write this article. We are happy to record our thanks to all these industries. We hope that this exercise will encourage them to look into their energy activities and start conservation measures. The Director of Industries and Commerce, Karnataka, Joint Directors and other officers were very helpful in our data collection work. Our thanks are due to them for their cooperation and help.
1. The United Nations, 1991. Energy Statistics Yearbook. United Nations Publications, New York.
2. Tata Energy Research Institute, 1995., TEDDY 1994-95, Tata Energy Research Institute, New Delhi.
3. Economic Intelligence Service, May 1993. Current Energy Scene in India. Centre for Monitoring Indian Economy Pvt. Ltd., Bombay, India.
4. Government of Karnataka, 1990. Statistical Profile 1969-86. Karnataka Electricity Board.
5. Government of Karnataka, 1990. Statistical Outline of Karnataka 1983-84, Directorate of Economics and Statistics, Bangalore.
6. Economic Intelligence Service, September 1992, Basic statistics Relating to Indian Economy Vol. 2, States, Centre for Monitoring Indian Economy Pvt. Ltd., Bombay, India.
7. Government of Karnataka, 1994. Economic Survey 1993-94, Planning, Institutional Finance and statistics and Science and Technology Department, Bangalore.
8. World Population Data Sheet, 1994. Demographic Data and Estimates Countries and Regions of the world. Population Reference Bureau inc Washington.