Analysis of energy utilization in the grain mill sector in Karnataka
ENERGY POLICY JUNE 1993
*T.V. Ramachandra and D.K. Subramanian
*Center for Ecological Sciences, Indian Institute of Science, Bangalore 560012, India.
Energy is a major constituent of a small-scale industry such as grain mills. Based on a sample survey of several mills spread over Karnataka, a state in India, a number of energy analyses were conducted primarily to establish relationships and secondarily to look at them in more detail. Initially specific energy consumption (SEC) was computed for all industries so as to compare their efficiencies of energy use. A wide disparity exists in SEC among various grain mills. In order to understand the disparities better, regression analyses were performed on the variables energy and production, SEC and production, and energy/SEC with percentage production capacity utilization. The studies show that smaller range industries have lower capacity utilization. This paper also examines the energy savings possible by shifting industries from the lower production ranges to the next higher range (thereby utilizing installed production capacity optimally). This leads to an overall energy capacity saving of 23.12% for the foodgrain sector and 18.67% for the paddy dehusking subgroup. If this is extrapolated to the whole state, we obtain a saving of 55 million kWh.
Since the day when man used fire for cooking, energy has played an increasingly pivotal role in his life. Gradually, he started multiplying the use of energy for fabricating implements, transport, agriculture, illumination, the construction of shelter etc. Rapid increases in industrialization, coupled with higher growth rates in population, led to increases in energy consumption. Energy sources are classified as, first, finite non-renewable resources such as coal, oil, fuelwood etc; and, second, renewable resources such as hydro, agrowastes, solar, wind etc. Fuelwood or biomass can be treated as a renewable resource if the exploitation rate is less than the growth rate. However, present usage borders on depleting the biomass potential. This necessitates restricting our energy needs to the availability of resources. Most of the energy devices we use in day to day life are basically energy converters. Whenever we convert energy from one form to another, the full energy content in the input is not converted into the useful form. The term 'efficiency' used in this context is the ratio of useful energy content in the output to energy content in the input. This paper examines the energy-efficiency situation in a particular sector of small-scale industry the grain mill sector through a series of regression analyses. and estimates possible energy savings.
| PRESENT ENERGY SITUATION IN KARNATAKA |
In Karnataka State both commercial (coal, oil and electricity) and non-commercial (fuelwood, cowdung and agrowastes) forms of energy are used almost equally. Sectoral energy consumption I indicates that 44% of total commercial energy is consumed in the industrial sector. followed by the transport (24.4%) and domestic sectors (18.1%). More than 70% ofthe 10 644 million kWh produced during 1987-88 was consumed by the industrial sector. The bulk of non-commercial energy consumption is in the domestic or household sector, mostly for cooking (predominantly in rural households). Earlier studies2 showed that in Karnataka, 41.29% of total annual energy consumption was from fuelwood (11.208 million tonnes of coal replacement (tcr). while cowdung and agrowastes meet about 10.22% (2.79 million tcr) of total domestic energy demand. The conflict between energy demand and environmental quality goals can be solved by an integrated approach to the problem of energy planning with an aim of minimizing consumption of non-renewable resources and maximizing the efficiency of usage. Present low energy-efficiency levels can be seen from the results of a study conducted for a public sector
Table I. Energy effciencies of some end-use devices in the electrometallurgical industry (%).
| Welding sets |
14.00 |
| Furnace |
10.40 |
| Shearing machine |
33.30 |
| Bending machine |
30.00 |
| Eleclroplating process |
38.00 |
| Diesel generalor sets |
36.50 |
| Press brake |
14.06 |
| Cranes |
24.82 |
electrometallurgical industry at Bangalore in Karnataka. Table I gives efficiencies of various end-use devices. Studies of electric load and consumption patterns in largeand medium-scale industries in Karnataka have revealed that 40% of the electrical load is being used for heating purposes; this could easily have been obtained from other forms of energy, thereby increasing efficiency of use and relieving the demand on high quality electrical energy sources. It is therefore necessary to examine the sources: end-use matching is also an aspect of energy planning. An integrated energy plan for a country should include strategies to:
- Improve efficiencies of end-use devices and/or conversion equipment;
- Optimize energy sources (end-use matching);
- Maximize the use of renewable resources;
- Balance the exploitation of biomass energy resources; and
- Discourage the use of depletable resources (by penalties).
Industrial units are major consumers of high quality energy sources. A study on largeand medium-scale industries in Karnataka showed that in many applications of electrical energy, 25 units of input energy are used to produce one unit' of useful output. We therefore focused our attention on the industrial sector.
Certain small-scale industries (such as biscuits, food grain products, bricks and tiles etc) manufacture similar products in the sense that there are great similarities in technology, scale of production, raw materials used, production processes etc; it is therefore possible to make a meaningful comparison between performances. In this paper we examine the study which focused on the energy usage pattern in the food grain products sector (Sector 204). We also analyse linkages between various parameters such as energy, energy intensity (EI), specific energy consumption (SEC), production and percentage production capacity utilization (PPCU).
The analysis shows that:
- Small-scale consumption is related to production.
- Small-scale industries could save 30-40% of energy by increasing production to the full installed capacity.
- Industries in the production range of less than Rs 250 000 consume more energy per unit of output than industries in the higher production range.
The objectives were to:
-
Analyse energy consumption patterns in different units in the food grain products sector of the small-scale industries group in Karnataka, so as to identify disparities in the levels of energy consumption;
-
Examine and analyse a homogeneous subsector (firms where dehusking of paddy only is carried out) in the food grain products sector;
-
Explore the relationships that exist between different parameters such as energy consumption and production, energy and PPCU, EI and production. SEC and production, EI and PPCV, SEC and PPCU;
-
Compare energy utilization in these industries in several districts. since these industries are diffused all over Karnataka State.
The first objective was accomplished by looking at the index of SEC or EI.
Definitions
SEC can be identified as the ratio of energy consumption in rupees to production in rupees. It gives an idea of the amount of energy used for a particular level of production. It is an index for energy efficiency: the lower the SEC the higher efficiency. EI is the ratio of energy consumption in units (kWh) to production in tonnes. PPCU is the ratio of actual production to installed production capacity expressed as a percentage. This ratio represents the extent of utilization by an industry of its full installed capacity.
| SMALL-SCALE ENTERPRISES IN KARNATA |
In the process of reshaping and developing the Indian economy under the five-year plans, the hitherto neglected and static small-scale industry (SSI) sector came to the attention of government and the developmental authorities. In this connection it was realized that small-scale industries (1) provide greater employment opportunities; (2) encourage gradual progress in production technologies

in an unorganized sector of industry; and (3) aid better utilization of local resources thus encouraging local self-sufficiency in respect of certain types of essential consumer goods.
Some of the characteristics of SSIs are that they are diffused all over the state; production processes within a group are similar; and energy plays a key and dominant role in their production inputs.
Table 2 gives details of growth rate, investment and number of people employed in the SSI sector. The same information is displayed in a bar chart in Figure 1. From this we note that SSIs have an average annual growth rate of 15.77% and employment has an average annual growth rate of 14.49%. In the last eight years, the number of such industrial units in Karnataka has increased from 37 093 to 103960 (180.27%) and employment has gone up from 430697 to 763030 (77.16%). District-wise analysis shows that the annual growth rate for industries varies from a low of 7.49% (for Chikmagalur district) to a high of 22.32% (for Chitradurga district). The percentage number of SSI units per district varies from a very low value of 0.85% (for Kodagu District) to a very high value of 21.4% (for Bangalore District).
Analysis of energy use in the SSI sector
Our end-use energy efficiency study was carried out in three parts. Initially a survey collected data on energy consumption, manpower details. raw materials requirements, installed production capacity and actual production of an industry. Since there are 103 960 SSI units, it was difficult to obtain data from them all; thus data were studied from a sample (2014 units). As many types of enterprise were poorly represented in the sample, a second sample was derived discarding all such sectors; this resulted in 47 groups (1618 industries). Energy analysis was carried out for these 47 groups. Computation of SEC energy consumption per unit of production (Rs) has revealed that 33 groups have a variation in SEC by a factor of 10 or more. This means that there is a remarkable potential for energy conservation. If a firm/unit consumes more than 25% of its total costs in energy. whereas another firm in the same group (producing the same or similar products) has much lower energy costs (say 7-10%), energy becomes a critical factor in its survival. Food grain products is one such group which shows wide variation, and on that basis has been selected for further analysis.
Food grain industries (sector 204)
The main operation of this sector is milling grain products and dehusking paddy. The sample survey covers 153 firms from different places within Karnataka State. These industries fall into sector 204 (from the national industry code. allocated by the Central Statistical Organization, Government of India). The different subgroups and number of industries in each are as shown in Table 3. Industries which carry out

dehusking of paddy are located in rural areas (subgroup 2042). These industries are primarily agricultural. Since subgroup 2042 has a large number of samples and is homogeneous, it is also used for further detailed analysis.
The various stages of the studies were as follows:
-
Study of SEC to find out whether there are any disparities in the levels of energy consumption within a sector.
-
Establishment of relationships among various parameters such as energy, production, SEC, EI and PPCU.
The techniques adopted for this purpose were principal component analysis, and linear/non-linear regression analysis (straight-line, quadratic parabola, hyperbola, exponential and power law relationships). Regression analysis for sector 204 was carried out for all firms in sector 204 (our sample size is 153). Partial removal of scatter was achieved by removing industries where the individual energy consumption was greater than the sum of average energy consumption plus twice the standard deviation (s). The scatter was further removed by organizing the data into a more compact form without obscuring the essential information contained in the values. This was accomplished by grouping industries on a production range at intervals of Rs 50 000 in the range of Rs 0 to 900 000. Industries were also grouped according to PPCU at intervals of 5% in the range of 0 to 100%.
Similar analyses were carried out for subgroup 2042, on all firms in the group, and then on firms using only electricity. The scatter was high even after
Table 3. Food grain industries subgroups and number of industries in Kamataka State.
| Product/output |
Number of firms sampled |
Subgroup code (nationalindustry code) |
| Flour mills |
16 |
2041 |
| Dehusking of paddy (paddy hulling) |
123 |
2042 |
| Fried gram |
14 |
2043 |
these operations. Further analyses were therefore carried out by removing scatter through grouping of industries. Regression analysis was also carried out for selected districts with more than 12 firms.
Finally, possible energy savings in sector 204 and subgroup 2042 arising from better utilization of full installed production capacity were also calculated.
Analysis of energy use in the food grain products sector
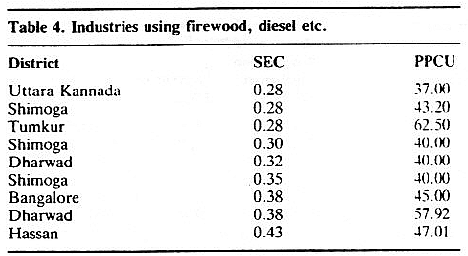
For the food grain products sector, energy analyses were carried out to explore the variations in individual parameters such as SEC and PPCU. Computation of SEC has revealed intradistrict disparities in energy consumption, which varies from a minimum of 0.01 to a maximum of 0.07 for Raichur District, from a minimum of 0.01 to 0.38 for Bangalore District, from a minimum of 0.11 to a maximum of 0.43 for Hassan District. Table 4 illustrates SEC for different types of energy resources. We see that industries using energy resources such as fuelwood, diesel etc have higher specific energy costs (varying from a minimum of 0.28 to a maximum of 0.43) while SEC for industries using electricity varies from 0.01 to 0.30 (Table 5). About 60 industries out of 153 are utilizing less than 50% of their installed production capacity. Large variations in SEC suggest the potential for energy conservation in this sector.
Quantitative relationships among variables
Principal component analysis. Principal component analysis (PCA) was tried on our data to obtain a set of independent variables so as to identify relationships among them. PCA is a method whereby a set of variables is transformed into a new set of composite variables (components) which are uncorrelated (orthogonal) to one another. The reduction of dimensionality and the ability of the method to remove correlations between variables is often the sole basis for its use. For our set of data the application of PCA did not yield any conclusive results. We therefore moved on to regression analysis.
Regression analysis. We applied regression analysis to obtain the relationships between (1) energy consumption and production; (2) energy and PPCU; (3) SEC and production; (4) SEC and PPCU; (5) EI and production; (6) EI and PPCU.
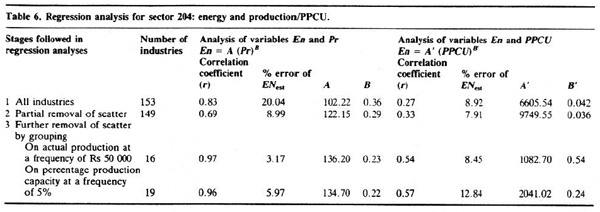
The correlation between energy consumption (En) and production (Pr) is found to be 0.83. The results of the regression analyses linear, parabola, hyperbola, exponential or power law are given in Table 6. Since the percentage error is high in all these cases, we can infer that the scatter is high, and filtering is needed to remove it. After partial elimination of scatter, the best relationship obtained was power law; even in this case the percentage error is still high. So the next step was to remove the scatter further by grouping the industries based on actual production and PPCU.
It was found that a power law relationship has the lowest percentage error. The best fit relationship for sector 204 is
En = 136.20 (Pr)0.23 {industries grouped on the basis of actual production}
Table 5. Industries using only electricity.
| District |
SEC |
PPCU |
| Bellary |
0.07 (max) |
55.00 |
| |
0.04 (min) |
69.00 |
| Chitradurga |
0.27 (max) |
50.00 |
| |
0.08 (min) |
62.12 |
| Dharwad |
0.24 (max) |
35.00 |
| |
0.06 (min) |
67.67 |
| Hassan |
0.19 (max) |
33.33 |
| |
0.02 (min) |
80.00 |
| Kodagu |
0.19 (max) |
32.00 |
| |
0.03 (min) |
60.00 |
| Kolar |
0.13 (max) |
50.00 |
| |
0.06 (min) |
67.50 |
| Mandya |
0.24 (max) |
42.67 |
| |
0.03 (min) |
70.00 |
| |
0.03 (min) |
67.08 |
| Mysore |
0.22 (max) |
45.00 |
| |
0.02 (min) |
69.17 |
| Uttara Kannada |
0.28 (max) |
47.00 |
| |
0.02 (min) |
65.00 |
| Raichur |
0.07 (max) |
57.17 |
| |
0.01 (min) |
88.89 |
| Shimoga |
0.30 (max) |
43.00 |
| |
0.01 (min) |
92.55 |
| Dakshina Kannada |
0.27 (max) |
45.00 |
| |
0.04 (min) |
80.00 |
| Tumkur |
0.28 (max) |
42.50 |
| |
0.03 (min) |
60.00 |
En = 134.70 (Pr)0.22{industries grouped on the basis of percentage production capacity}
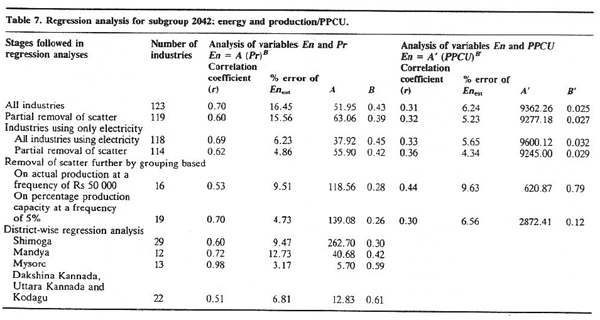
Similar results for the paddy dehusking subgroup 2042 are given in Table 7. In order to remove possible further scatter we considered 118 industries in subgroup 2042 using only electricity. The relationship is found to be power law with a percentage error of 6.23. Again, with the partial removal of scatter in the case of the industries using only electricity, the best relationship obtained from least squares analysis is power law (percentage error 4.86) given by En = 55.90 (Pr)0.42. Further scatter removal by grouping also gives the power law relationship En = 118.56 (Pr)0.28(grouping on the basis of actual production) and En = 139.08 (Pr)0.26(grouping on PPCU). From these analyses, for sector 204 and subgroup 2042, the general form of equation linking variables energy consumption and production is
En = A (Pr) B ---------------(1)
where En = energy consumption and Pr = production.
The value of the exponent B is less than unity for sector 204 and subgroup 2042. Figure 2 gives the plot of energy with reference to production on logarithmic scales. The straight line in Figure 2 is the linearized form of Equation (1) with slope B.
In order to understand the variations in energy consumption with reference to production and rate of growth, we need to look at the dynamic energy consumption rate. We can obtain the dynamic energy consumption by differentiating energy with reference to production given by:

d En / d Pr = A x B x (Pr) B-1---------------(2)
The value of B is less than unity both for sector 204 (0.23) and subgroup 2042 (0.26); hence dEn/dPr decreases sharply with increase in production, which means that the energy consumption rate slows down with increase in production. This shows the possibility of energy conservation.
In order to understand spatial variations in the energy consumption function, regression analysis was carried out separately for some selected districts. The best fits for energy and production for the districts Shimoga, Mandya, Mysore and coastal districts (Dakshina Kannada and Ottara Kannada) are power law. The variations in the value of exponent B from 0.30 (for Shimoga) to 0.61 (for Dakshina Kannada and Uttara Kannada) reveal the existence of district disparities in energy consumption.
It was noticed above that energy consumption grows at a slower rate with an increase in production. The production of a firm normally increases with increased utilization of installed production capacity. In order to make a quantitative estimate of the effect of percentage utilization of installed production capacity on energy consumption, regression analyses for energy with PPCU were carried out for sector 204 and subgroup 2042. The results are tabulated in Tables 6 and 7 respectively. We See from these tables that the results are similar, giving a power law relationship with an exponent of less than one. This means that higher utilization of production capacity gives increased energy efficiency.
EI, or SEC, is an index of energy efficiency. Similar types of regression analyses carried out to explore the relationship between SEC and production are plotted in Figure 3. This shows a decline in the value of SEC with an increase in production. Results are shown in Tables 8 and 9.
The best relationship for sector 204 is given by power law:
SEC = 130.20 (Pr)-0.76(based on actual production)
SEC = 134.70 (Pr)-0.77(based on PPCU)
A decline in the value of SEC with the removal of scatter is also noticed (varying at the rate of -V1.56th of production (with scatter) to -V1.31th of production (without scatter». The best relationship for the homogeneous sector 2042 is also power law. The exponent varies from -0.57 (with scatter) to -0.73 (removal of scatter) ie SEC varies at the rate of -111. 75th to 1/1.37th of production. Thus from these analyses, it is evident that the relationship and production is of the type:
SEC = C(Pr) –D ---------------(3)
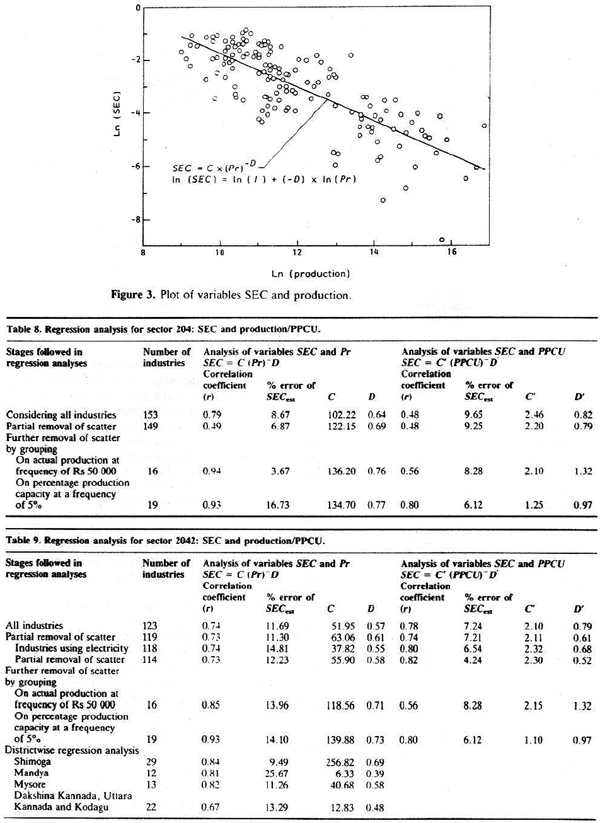

The negative exponent D indicates a decline in the value of SEC with increase in production. Figure 4 gives the plot of SEC with reference to production on logarithmic scales.
The decline in SEC with increase in production gives two options for increasing energy savings in this sector: (1) to move firms in a lower production group to a higher group; and (2) to raise a firm's utilization to its maximum value (closer to optimum value) .
The district analyses shows similar results, with an exponent varying from -0.39 (for Mysore) to -0.69 (for Shimoga) revealing interdistrict variations.
To obtain a normalized picture of the relationship between SEC and PPCU regression analyses were carried out for sector 204 and subgroup 2042 respectively, as shown in Tables 8 and 9. This shows that increased utilization of installed capacity reduces SEC.
Out of 153 industries in our sample, nine use another fuel in addition to electricity. All these sources are converted to common units of measurement (kWh). In order to find out the quantitative relationship between energy intensity and production, regression analysis was carried out. Again the relationship is found to be power law; considering all firms, the relationship is EI = 123.88 (Pr)-0.54 with a correlation coefficient of 0.748 and percentage error of 8.43. After partial elimination of scatter we have EI = 87.88 (Pr)-0.52with correlation coefficient of 0.75 and percentage error of 6.95. Removal of scatter further by grouping based on production gives EI = 102.81 (Pr)-0.709 with a correlation coefficient of 0.83 and percentage error of 2.99.
This indicates a decline in the value of EI with increases in production. Regression analysis of EI and PPCU gives a power law. Over all 123 firms the relationship is EI = 4.95 (PPCU)-0.74, with a correlation coefficient of 0.311 and percentage error of 9.79; with the partial elimination of scatter (119 firms) the relationship is EI = 4.30 (PPCU)-0.72with a correlation coefficient of 0.311 and percentage error of 8.37. The negative exponent indicates a decline in EI with increased utilization of PPCU.
| ENERGY SAVINGS IN SECTOR 204 AND SUBGROUP 2042 |
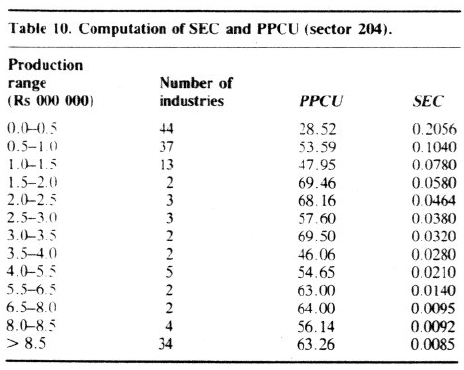
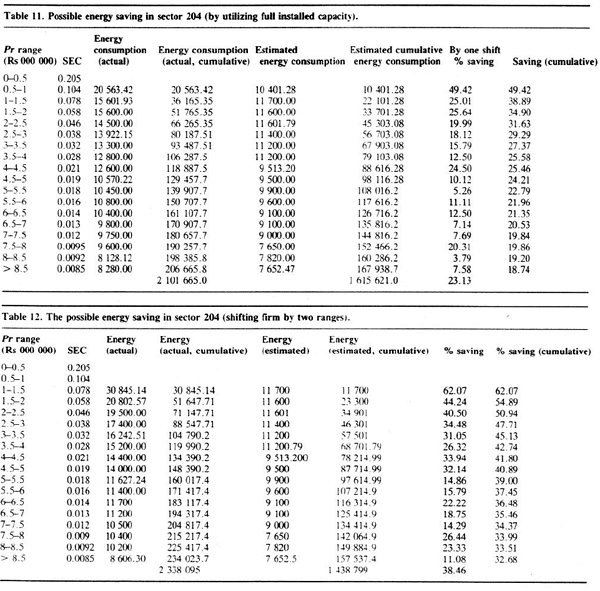
From the above, we notice that considerable energy saving is possible by shifting firms to a higher production group, and improving installed capacity utilization to its maximum value. Firms are grouped on actual production range at a frequency of Rs 50 000. Table 10 gives SEC and PPCU for the grouped data. SEC decreases with production (and with better utilization of production capacity). We now shift firms from a lower range to a higher range to obtain possible energy savings in sector 204 and subgroup 2042. Shifting firms from the first (production less than Rs 50 000) to second group (Rs 50 000-100 000) alone yields an estimated energy saving of 49.42%, as indicated in Table 11. Thus the total energy saved through a single shift for sector 204 is 23.12%. If firms are shifted by two groups up (which is possible, since firms in the range less than Rs 50 000 have a PPCU of only 28.52%), the possible saving
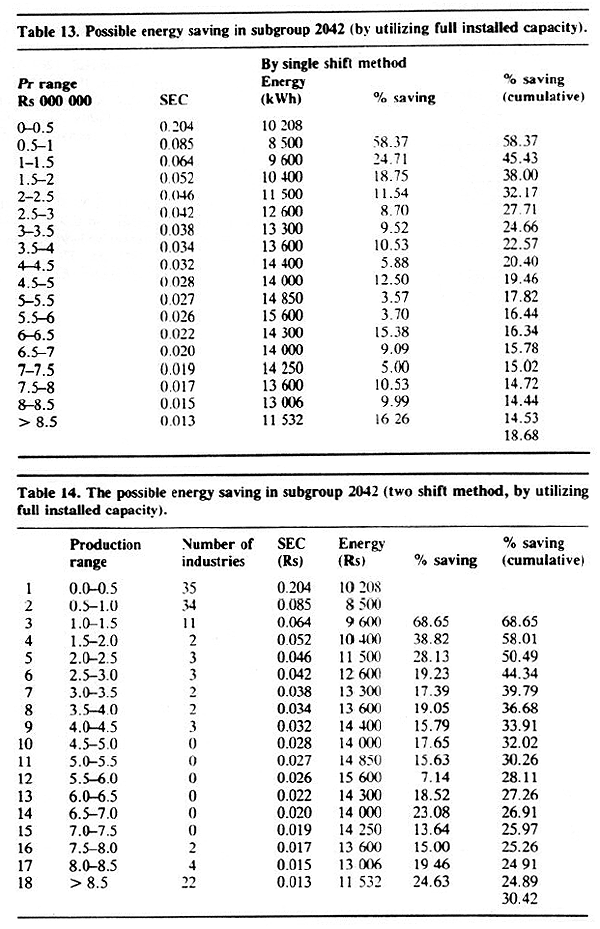
for the first group shift alone would be 62% and the overall average saving in sector 204 would be 38.46%. These results are shown in Table 12. Tables 13 and 14 give similar results for the paddy dehusking industries subgroup. By utilizing full installed production capacity in the range less than Rs 50000 and at SEC of 0.085, the energy saved would be 58 76%. The overall energy saved will be 18.68%.
To obtain the overall savings in energy, we look at the actual production of paddy in Karnataka of 2361 146 quintals (100 kg) in 1988-89 needing 184.169 million units of electricity for hulling. By adopting the energy saving measures mentioned above. we can save 55.25 million units in subgroup 2042 alone. This is a saving equivalent of 12.62 MW generating capacity, which is significant.
There are wide variations in SEC/EI within a district and for the entire state. Firms using energy resources such as fuelwood, diesel etc (other than electricity) have higher SEC values in the order of 0.28 to 0.43. Industries using only electricity have SEC values of the order of 0.01 to 0.3.
All relationships between energy, SEC and production are power law with an exponent of less than one. Computation of dynamic SEC (dEn/dPr) reveals that the rate of energy consumption is less than the rate of production. The energy consumption rate decreases as a firms production increases.
There is a wide disparity in the values of exponent B in the power law relationship for En and Pr (it varies from 0.61 for Dakshina Kannada to 0.30 for Shimoga) between districts. In general the energy consumption rate decreases with increased utilization of installed production capacity. A close look at the energy intensive firms in sector 204 and subgroup 2042 reveals that those firms are utilizing only 50% of installed production capacity, Utilization of full installed capacity at improved energy efficiencies leads to a possible significant energy saving of 23-38% in this sector.
We are grateful to N. V. Joshi and Madhav Gadgil for their constant help, support and many useful ideas. Thanks are due to the officials of Small Scale Industries Service Institute. Directorate of Industries and Commerce, Karnataka Government and Management of Small Scale Industries for their help in our data collection work. This work was supported by grants from the Ministry of Environment and Forests, Government of India.
D.K Subramanian, 'Energy utilisation in Karnataka'. in CJ. Saldanha, ed. State of Environment Report Kamataka, 1983-84.
Center for Taxonomic Studies, Bangalore. India. 1985, pp 103123.
DK Subramanian and T.V. Ramachandra. 'Energy utilisation in industries in Karnataka'. in CJ. Saldanha. ed. Slate of Environment Report Kamataka, 1984-85, Centre for Taxonomic Studies. Bangalore, India, 1986, pp 107-125.
TV. Ramachandra, A.K, Kattimani and Gancsh Kini. Power Efficiency Studies in a Public Sector Industry. Karnataka State Council for Science and Technology, Project Report, 1983-84. p 33.
Op Cil, Ref 2.
Ibid
D.K. Subramanian and T.V. Rarnachandra. 'Energy utilisation in small scale industries', in CJ. Saldanha. ed. State of Environment Report Kama/aka 1985--86, Centre for Taxonomic Studies, Bangalore, India, 1987, pp 107-121.
PW Colgan, Quamita/ive Ethology, Wiley Eastern, Delhi, 1978. p 24.


