Land cover mapping was done for the Kolar district through slope and distance based vegetation indices. It is found that vegetation is sparsely distributed in Kolar district because of its semi-arid environment and pixels contain a mixture of green vegetation and soil background. Hence, in addition to slope based vegetation indices, distance based vegetation indices have been computed. This would cancel the effect of soil brightness in case where there is mixture of green vegetation and soil background.
Slope based vegetation indices shows area under vegetation in Kolar district ranges from 47.65 % to 49.05%, while in distance based vegetation indices it ranges from 40.40% to 47.41%. Table 1 provides area under vegetation considering slope and distance based vegetation indices. NDVI for Kolar district is given in Fig.3.
Table 1: Land cover analysis of Kolar district with different VI aspects
Vegetation Indices |
Area in sq. km | Area in % | ||
| Non-vegetation | Vegetation | Non-vegetation | Vegetation | |
| Slope based vegetation indices | ||||
| RATIO | 4312.92 | 4152.29 | 50.95 | 49.05 |
| NDVI | 4312.92 | 3888.34 | 52.59 | 47.41 |
| RVI | 4576.87 | 3888.34 | 54.07 | 45.93 |
| NRVI | 4312.92 | 3888.34 | 52.59 | 47.41 |
| TVI | 4599.14 | 3866.07 | 54.33 | 45.67 |
| CTVI | 4599.14 | 3866.07 | 54.33 | 45.67 |
| TTVI | 4599.14 | 3866.07 | 54.33 | 45.67 |
| Distance based vegetation indices | ||||
| PVI | 4666.95 | 3798.26 | 55.13 | 44.87 |
| PVI1 | 4783.66 | 3681.55 | 56.51 | 43.49 |
| PVI2 | 4728.17 | 3737.04 | 55.85 | 44.15 |
| PVI3 | 4976.69 | 3488.49 | 58.79 | 41.21 |
| DVI | 4825.18 | 3640.03 | 57.00 | 43.00 |
| AVI | 4312.92 | 3888.34 | 52.59 | 47.41 |
| SAVI | 4312.92 | 3888.34 | 52.59 | 47.41 |
| TSAVI1 | 4576.87 | 3888.34 | 54.07 | 45.93 |
| TSAVI2 | 5045.25 | 3419.96 | 59.6 | 40.4 |
| MSAVI | 4312.92 | 3888.34 | 52.59 | 47.41 |
| WDVI | 4671.59 | 3793.62 | 55.19 | 44.81 |
Land cover maps were verified through field investigations using calibrated (with known benchmarks and digital SOI topographic maps) GPS. Overall accuracy and the kappa statistics were computed. Validation of classified data indicates that the distance based vegetation index TSAVI1 is suitable for dry (semi arid) regions with scanty vegetation cover (Fig. 4) while NDVI is suitable for the regions with relatively good vegetation cover. Overall accuracy of land cover classification is 88.5%. in the case of TSAVI1 (in regions dominated by soil). While it is 90% for NDVI in the region with good vegetation cover and 54% in the regiond dominated with soil. Comparative analyses of vegetation indices indicate that slope based vegetation index NDVI is appropriate for the regions with a good vegetation cover.
Fig. 3: NDVI of Kolar district
Fig. 4: TSAVI1 of Kolar district
Land use analysis was done by both Supervised classification (accuracy 94.67 %) and unsupervised classification (accuracy 78.08 %) approaches. Supervised classification was done using Gaussian maximum likelihood classifier (GMLC) to classify the data in to five categories (agriculture, built-up, forest, plantation and waste land) as depicted in Fig. 5. The composition of land use categories (agriculture, forest, plantation, built-up and wasteland) are listed in Table 2.
Figure 5: Classified image
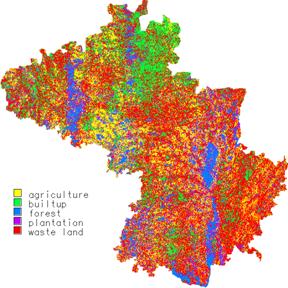
Table 2: Land use details of Kolar district
| Supervised | Unsupervised | |||
| Categories | Area (in ha) | Area (%) | Area (in ha) | Area (%) |
| Agriculture | 233519 | 28.34 | 222416 | 27.00 |
| Builtup | 131468 | 15.96 | 70970 | 8.62 |
| Forest | 68300 | 8.29 | 85295 | 10.35 |
| Plantation | 70276 | 8.53 | 84716 | 10.28 |
| Waste land | 320284 | 38.88 | 360450 | 43.75 |
Accuracy Estimation : Accuracy estimation in terms of producer's accuracy, user's accuracy, overall accuracy and Kappa coefficient were calculated after generating confusion matrix for supervised classification (table 3) and unsupervised classification (table 4).
Table 3: Error matrix resulting from classifying training set pixels
| Categories | Agriculture | Builtup | Forest | Plantation | Waste land | Row Total |
| Agriculture | 42 | 1 | 0 | 0 | 0 | 43 |
| Built up | 0 | 16 | 0 | 0 | 0 | 16 |
| Forest | 0 | 0 | 20 | 3 | 0 | 23 |
| Plantation | 0 | 0 | 2 | 34 | 0 | 36 |
| Waste land | 2 | 0 | 0 | 0 | 30 | 32 |
| Column Total | 44 | 17 | 22 | 37 | 30 | 150 |
Table 4: Error Matrix for Unsupervised Classification.
| Categories | Agriculture | Builtup | Forest | Plantation | Waste land | Row Total |
| Agriculture | 33 | 0 | 0 | 0 | 1 | 34 |
| Built up | 0 | 17 | 0 | 0 | 4 | 21 |
| Forest | 0 | 0 | 38 | 13 | 0 | 51 |
| Plantation | 0 | 0 | 0 | 28 | 0 | 28 |
| Waste land | 8 | 8 | 5 | 2 | 30 | 53 |
| Column Total | 41 | 25 | 43 | 43 | 35 | 187 |
The producer’s accuracy, user’s accuracy corresponding to the various categories and overall accuracy results obtained are summarized in table 5.
Table 5: Producer’s accuracy, user’s accuracy and overall accuracy.
| Supervised Classification | Unsupervised Classification | |||||
| Category | Producer’
accuracy (%) |
User’s accuracy (%) |
Overall accuracy (%) |
Producer’s accuracy (%) | User’s accuracy (%) | Overall accuracy (%) |
| Agriculture | 95.45 | 97.67 | 94.67 | 80.49 | 97.06 | 78.07 |
| Builtup | 94.11 | 100.00 | 68.00 | 80.95 | ||
| Forest | 90.90 | 86.96 | 88.37 | 74.51 | ||
| Plantation | 91.89 | 94.44 | 65.16 | 100.00 | ||
| Waste land | 100.00 | 93.75 | 85.71 | 56.60 | ||
A  value was computed (0.931577) which is as an indication that an observed classification is 93 percent better than one resulting from a chance.