Figures
Figures |
Figure 2: Taluk wise distribution of bio energy from forest
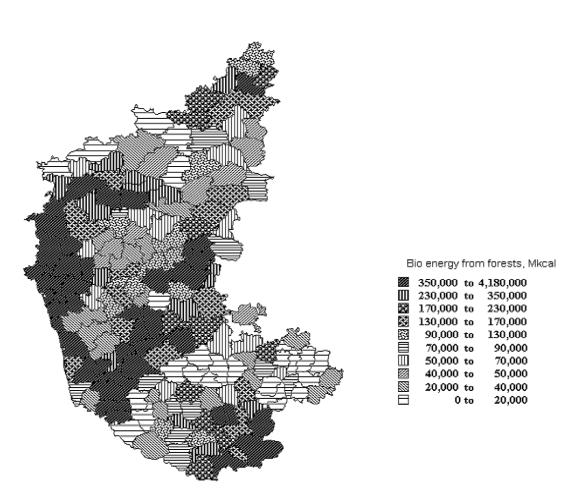
Figure 3: Taluk wise distribution of bio energy from plantation 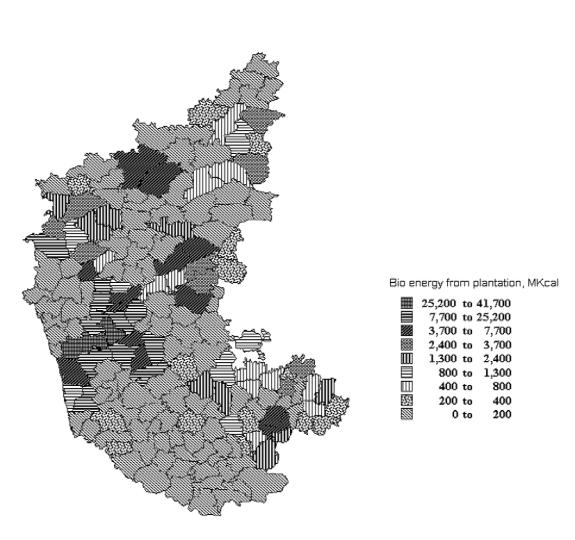
Figure 4: Taluk wise distribution of bio energy from agricultural residue 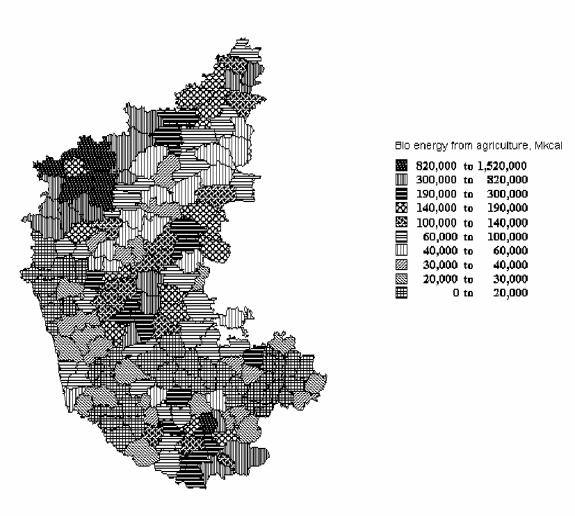
Figure 5: Taluk wise distribution of bio energy from horticulture residue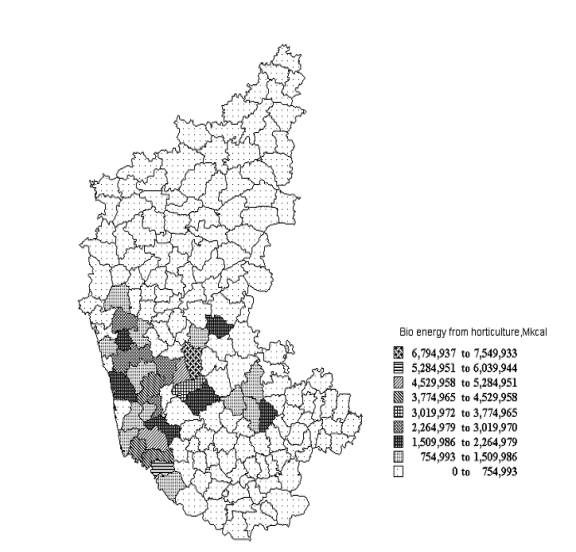
Figure 6: Taluk wise distribution of bioresource surplus and deficient zones
• 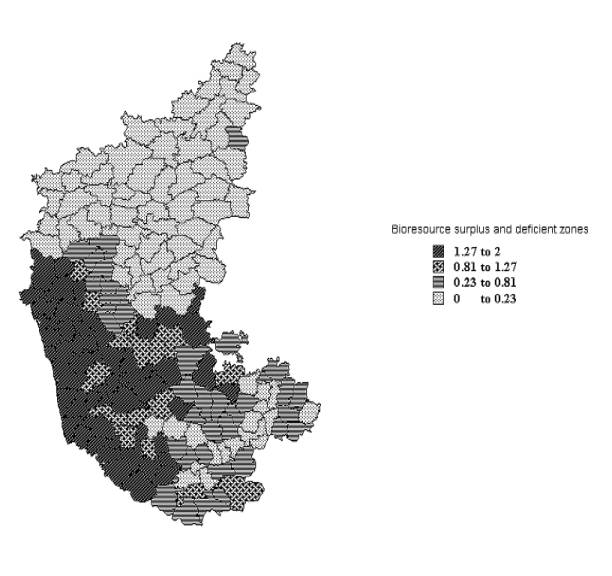
Figure 7: Sectorwise Contribution of Bioenergy
Agriculture
Horticulture
Forest
Plantation

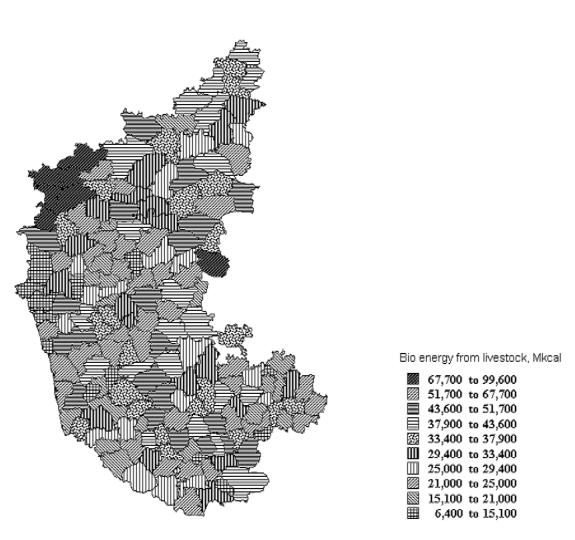
Figure 8: Taluk wise distribution of bio energy from livestock