| Overview : |
Stakeholders |
Quantity of Waste (tonnes/day) |
% |
|---|---|---|
Households |
650 |
18 |
CommercialEstablislunents |
1436 |
39 |
-Markets |
369 |
- |
-Hotels |
1067 |
|
Institutes |
128 |
4 |
- Hospitals |
20 |
|
- Offices |
16 |
|
- Educational institutions |
92 |
|
Industries 1399 39 |
1399 |
39 |
Total |
3613 |
100 |
| City | Paper | Metals | Glass | Textiles | Plastic | Ash and dust | Organics | Others |
|---|---|---|---|---|---|---|---|---|
| Chennai Delhi Kolkota Bangalore Ahmedabad Mumbai |
5.90 5.88 0.14 1.50 5.15 3.20 |
0.70 0.59 0.66 0.10 0.80 0.13 |
- 0.31 0.24 0.20 0.93 0.52 |
7.07 3.56 0.28 3.10 4.08 3.26 |
- 1.46 1.54 0.90 0.69 - |
16.35 22.95 33.58 12.00 29.01 15.45 |
56.24 57.71 46.58 75.00 48.95 59.37 |
13.74 7.52 16.98 7.20 10.39 18.07 |
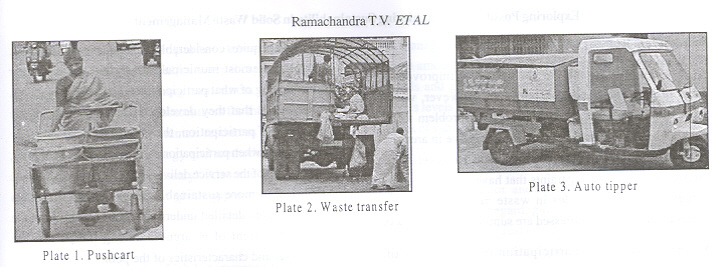
Waste storage: Waste is stored in 14,000 bottomless and lidless cement bins having 0.9 meters diameter and 0.6 cubic meter storage capacity and large masonry bins for depositing waste placed at a distance of 100-200 meters. Recently 55 metal containers have been placed at different parts of the city. However not all parts of the city are provided with storage systems. In some places, the wastes are just deposited on roadsides. Waste collection and transport: Collection of waste is either done by Bangalore Mahanagara Palike (BMP) or by private contract system. In December, 2001 BMP and Bangalore Agenda Task Force (government appointed body) through ajoint initiative established a public private partnership,by launching a sustainable cleanliness program called 'Swachha Bangalore'. Twentyfive percent of the city is served under this scheme. Swachha Bangalore is mainly door to door collection of wastes using pushcarts (Plate 1). There are totally 2105 pushcarts in operation in Bangalore, which consists of 4 buckets that are used to store dry wastes and wet wastes separately.Swachha Bangalore scheme also covers selected slum areas and auto tippers have been deployed for collection of wastes (Plate3). There are 6500 pourakarmikasinchargeof door to doorcollection,sweeping, emptying dustbins and clearing black spots. They arrive at a designated spot to transfer the waste to the truck. Trucks have a capacity of 4-5 tonnes capacity and are either open bodied or covered with a mesh (Plate 2). The ratio of truck to ward is 4:20. Other collection systems consist of bullock carts, tricycles etc. Collection is sometimes difficult due to narrow roads and due to this waste is not picked on time causing unsanitary conditions. There are no transfer stations in Bangalore.
|
|---|
Transportation of
wastes to disposal site is done in two ways through the same trucks by engaging
82 trucks of the corporation; through contractors by engaging 129 vehicles for
layouts and markets and 72 vehicles on contract for transportation of waste.
The corporation also has 13 dumper placers for transporting metallic containers
of 2.5 to 3 tonnes capacity and 6 minicompactors for transportation of wastes.
Waste processing and recovery: The method adopted to process waste is composting.
Karnataka Compost DevelopmentCorporation handles 120 metric tonnes of raw garbage/dayin
the yard. Out of 100 tonnes ofraw garbage, 55 tonnes of compost is obtained.
Due to constraints of land, finance and demand, the facility can handle only
120 tonnes of wastes. As such out of the 369 markets in and
around the city, only 2 have been accepted for composting. Vermicompostingis
also practised to handle a portion of the waste. Dry wastes such as plastic,
rubber, glass and other commoditiesare later disposed off. Waste disposal: Disposal
is the final stage of waste management system. About 90% of the municipal wastes
collectedby the civic authorities in Indian cities are dumped in low-lying areas
outside the city/town limits. The waste disposaltrendsin majorIndian cities
are as given in Table 3.
Table 3 : Waste disposal trends in India.
| Waste disposal methods | 1971 -(40 cities) |
1991 & 1999 ( 23 cities ) |
|---|---|---|
| Land dumping |
Almost all |
89.8% |
| Composting | - |
8.6% |
| Others(pelletisation, vermi-composting) | - |
1.6% |
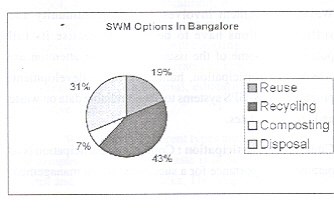
In Bangalore, the waste collected from roads and bins is directly transported to the final disposal site, usually anopendump.Thereis the likelihoodof soilandgroundwater contamination due to this practice. Birds (scavengers), vermin, insects and animals are attracted to the open dump for feeding and breeding. Since many of these may act as disease vectors, their presence may constitute a potential health problem. Sometimes plastic and other contraries are burnt, which may be hazardous to human health. Landfilling of wastes is not practiced in Bangalore. The following figure provides information on the variousSWM options in Bangalore.Recycling takes up43% and is an area to be further exploited. Thirty one percent of the waste is disposed, which is mainly burnt or simply dumped in open spaces.
 |

