

| Wave Power |


| Wave Power |
Christian Scholten and Kim Nielsen, Danish Wave Power
A new development on its way, is the development of wave power plants for electricity production. The existing plants are still proto types, but in the foreseeable future waves can cover around 1% of current global energy consumption.
Wave Energy Potential
Sea covers appr. 70% of the earth's surface, and waves contain energy of the order of 90,000 TWh per year, corresponding to an average power of 10 TW, or the current energy consumption of humanity.
With a mean efficiency of 25%, and expecting that only the most suitable localities, which makes up 4% of me resource, will be utilized during the next 50 years, wave energy will be able to cover 1% of the total energy consumption in the foreseeable future, equal to 100 GW mean power.
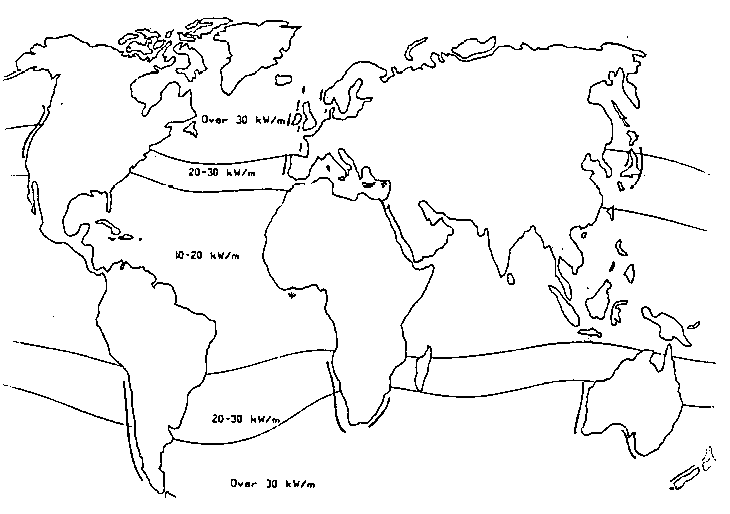
Wave energy is a renewable energy source. The sun causes winds, and winds cause waves. The wave energy content of a sea varies from place to place. In general it can be said, that the further away from the Equator one is, the more wave energy a sea contains.
Local conditions like e.g. coastal conditions, distances from shores, and debth of the sea, have large influence on the mean wave energy content of a sea area. The wave energy content of a sea area is often stated in kW/m, as the mean power passing a section of 1 m.
The global distribution of annual mean wave energy content in the seas is shown in figure 10.1 as power per m wave front.
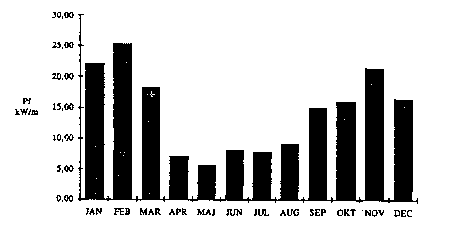
The wave energy content in the sea area furthermore varies with the season. In figure 10.2 is shown an example from the North Sea.
Status of Wave Power Development
Research on methods to utilize wave power is being carried out in some places in the world, e.g. in Japan, Ireland, England, Norway, Sweden, and Denmark. There are worked on two main types, installations near the coast, and installations placed on deeper water and several kilometres from land.
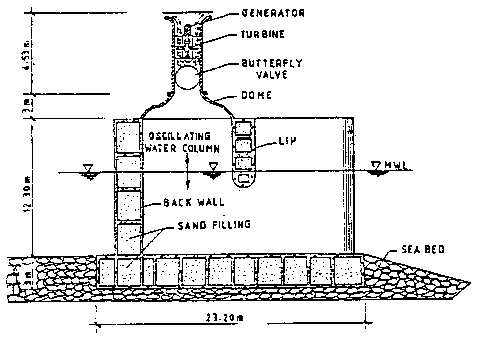
The installations near the coast are mainly based on the principle of oscillating water columns, as shown in figure 10.3. A big chamber (like an upturned cup) with an opening to the waves, and with an air turbine mounted towards open air, is built. When the waves put the enclosed air in motion, the air is pressed in and out through the air turbine. This type of plants have been constructed as pilot plants in Japan (in connection to a quay), and in India, England, and Norway.
Denmark, Norway, and Sweden have worked with floats, that are connected to a pump, which is activated, when the waves move the float.
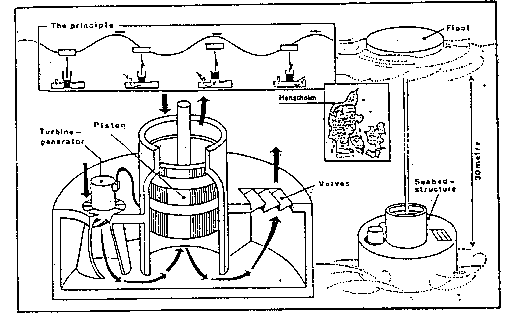
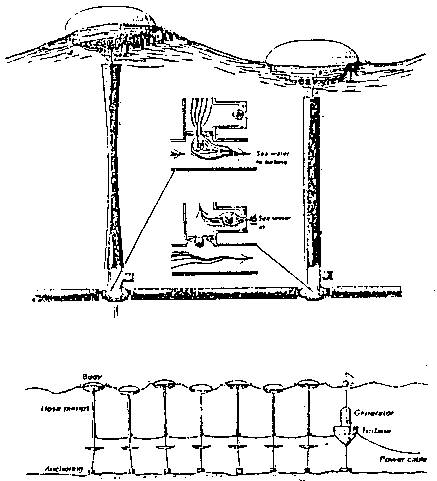
Figure 10.4 shows the Danish system, which is built and tested near Hanstholm. This principle uses a large single acting pump standing on the sea bed. A piston is connected to a float with an elastic wire, and when a wave moves the float, the piston is lifted, and water is drawn through a submerged turbine generator unit, thus producing electricity. When the wave crest has passed, the float is lowered, and the weight of the piston presses the water out through valves.
The Swedes use a hose pump, which is inserted between the float and a large damper disk, which is slack anchored to the seabed. When the waves lift the float, the hose is lengthened, and its volume is reduced. Hereby the water is pressed out and accumulated in a hose, that transport water from several pumps to a joint high pressure water turbine. When the wave lowers the float, the hose turns back to its original volume, and sea water is drawn in through valves.
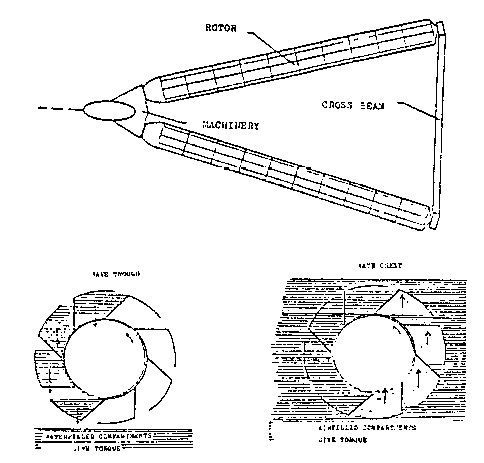
In Sweden they have researched into a wave rotor, as shown in figure 10.6. It consists of two oblong cylinders, which in principle resemble waterwheels. When a wave is lifted over the cylinder, the enclosed air will turn the wheel, e.g. anti-clockwise. When the wave has lowered, the enclosed water mass will continue to turn the wheel in the same direction, due to gravity.
Still there has only been a few prototype plants running. One of the reasons is, that it is still expensive to secure the installations' reliability and function under the often violent conditions at sea.
Energy Costs
Still there is no type of wave generators superior to all others. Some are better to absorb the energy from the waves, others are cheap or more durable. When all is said and done, it is about to construct a machine, which has a competitive kWh-price.
The cost is often defined as:
where
Aan are the annual costs for interest and repayment of investment debt. As rate of interest is often used the real interest, and as instalment period 25 years. Dan are the annual operation and maintenance costs. ' is the annual mean efficiency of the wave generator.
Pfm is annual mean power of waves per meter wavefront. b is the effective breadth of the wave front, which can be utilized by the wave generator.
Determination of a sea area's annual mean potential
The power per meter wave front of waves with the height H (from crest to trough) can e.g. be written:
Where
p is the density of water in kg/m3,
g is the gravity acceleration in m/sì
T is the wave period in sec.
This means that Pw - 13 MW/m for the largest waves with H = 30 m and T = 15 sec.
Normal predominant waves have a mean height of 1-2 m, and a period of 5-7 sec. That is a power of 13 kW/m, or only 1/1000 of the power of the largest waves.
In nature waves are irregular and can be described by statistic models.
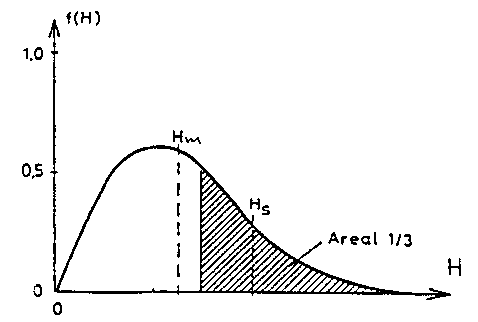
If the wave conditions are measured, e.g. in 20 minutes, the mean wave height Hm and the significant wave height Hs can be calculated. The significant wave height is defined as the average of the highest 33% of the waves.
It is said, that the waves in this relatively short period are characterized by a sea state Hs Figure 10.7 shows an example of the frequency of the wave heights H for a given sea state Hs.
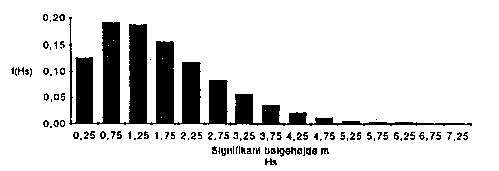
If the wave heights are measured for 20 minutes every third hour during some years, then the annual distribution of sea states can be found. Figure 10.8 shows an example from ER in the North Sea.
A given sea state Hs contains a power level per meter wave front, which with good approximation can be described by: Pinf ~ 2.05£(Hs)(2.5) (kW/m). In figure 10.9 is shown the variation of Pinf
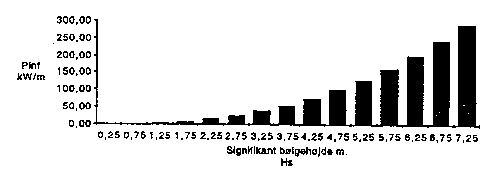
The wave energy potential in a sea area, e.g. the annual mean potential Pfm, can be calculated by weighting the individual sea states' power Pinf with the matching frequencies, and sum up all the contributions. In figure 10.10 an example from ER is shown, which results from figure 10.8 and 10.9. In this case it appears that sea states around Hs = 3.0 m contribute the most to the annual mean potential.

Wave generators' annual mean of absorbed power
In the efforts to utilize power from the waves, we could easily be led to believe that the optimum would be to aim at a wave generator, which utilized as much as possible of the sea states with the highest contribution to the annual mean power, Pfm. However, this strategy leads to very big plants, that are expensive, as their total capacity in the form of installed power is utilized only a small part of the year.
Wave generators that have the largest energy absorption in small waves, and do not increase the absorption subsequently, often prove to be the most profitable, even though the efficiency is only 1020%.
If the production curve is known for a certain wave generator, this means absorbed power per meter wave front as function of the sea states Hs, then it is possible to calculate the annual mean production and the average annual efficiency of the generator.
Figure 10.11 shows an example of such a production curve for the Danish wave generator. Such a curve can be determined by model tests.

If the absorbed power is weighted with the frequency of the sea states, and these contribution are summed up, it gives annual mean absorbed power, which is 1.65 kW/m for the Danish pointabsorber located at ER in the North Sea. The annual mean efficiency then is:
Perspectives
In the short term it is obviously about testing and developing the principles known today, thus their economy improves to a level, where it gets commercially interesting to construct wave power plants.
In the longer term wave power plants have to be built on very long distances to give a significant contribution to a non-polluting energy supply. If appropriate agreements are made with the fisheries and shipping authorities, such wave power plants are not expected to create severe commercial or environmental inconveniences.
The most energy containing waves occur at coast stretches, which are very scattered populated, e.g. in Australia, Southern Africa, and Southern America. Installations, that are built in these areas, can not be connected to the grid, like in Europe, and any utilization must be combined with long term energy storage in transportable form, e.g. as hydrogen and oxygen. Wave power plants could be producing hydrogen, e.g. by electrolysis of sea water. The hydrogen can be compressed and transported to small power plants based on fuel cells.
Literature
Energi fran havets vagor (Energy from the waves), Lennart Claeson. Efn-report no. 21, Sweden, 1987.
Wave Energy, Tony Lewis. Current Research Activities and Recommendations for European Research Programme. Final Report to DGXII. Cork, Ireland, 1992.
Planning a full scale wave power conversion test 1988-89, Kim Nielsen and Christian Scholten. Proceedings of ICOER 89. Hawai, USA, 1989.

