| Solid waste management situation in Bangalore: |
Many corporation wards in Bangalore city are characterized by having a high degree of fermentable component in municipal solid wastes (MSW) from residential areas. These wastes are typified with low calorific value (800-1800 kCals/kg), high moisture content (50-80%, low net cal value), high proportion of organic matter (>60%) and low recyclable content such as paper, plastics, metals etc. The fermentable components of MSW are predominantly vegetable and fruit wastes that can range between 65 and 90% (Rajabapaiah 1998, Ramachandra and Saira 2003; Ramachandra 2006, 2011; Chanakya et al. 2007, 2009). As and when the city begins source segregation into fermentables, it is expected that a significant component of fermentable fraction will be produced and needs to be picked up on a daily basis. Only 68% of wastes generated is being collected by the agencies in Bangalore.
The quantum of waste generated in Bangalore city varies from 2300 to 3600 MT/day and the composition of waste is given in Table 1. The quantity is likely to grow in the next few years due to the increasing population and will present a formidable challenge to authorities unless an integrated approach is taken. As the daily per capita organic fraction of MSW production varies between 0.2-0.5kg (Ramachandra et al., 2013, 2014), depending upon lifestyles in the cities (indicated by city population). Thus, due to the small size of the total fermentable MSW generated at the household scale only composting and vermicomposting seem feasible at the household level. Many commercial and non-commercial devices for household composting and vermicomposting have been tried in Bangalore (Chanakya et al. 2007; Ramachandra 2006). Area or community scale options indicated above have been more successful in Bangalore and in various places in India. Area or zone wise collection has been shown to simplify collection systems and it enables collection of waste of similar composition (Sathishkumar et al. 2001). Leaf litter and garden waste, vegetable and fruit waste, domestic and kitchen waste, etc. thus are manually carted and treated at scales between 0.05-0.25 tpd scale. Composition of waste (Table 1) clearly shows the predominance of fermentable materials at all locations in the process of generation to its reaching the dump site. In the residential areas, parks and vegetable markets, the presence of a large fraction of fruit and vegetable waste (fermentable fraction, 70-90%) increases the moisture content of waste to about 70-80% (Shwetmala et al., 2014). When composting of such high moisture feedstock is attempted by the standard windrow method, there is excessive generation of leachates and its fermentation results in malodours. High levels of such waste arise even in the business districts where there is a concentration of fresh fruit juice vending shops in the area. Citrus fruit skins, pineapple cores, sugarcane bagasse, other fruit waste, etc. are generated in large quantities in certain pockets of the city. These form nearly 80% of the waste collected area (Sathishkumar et al. 2001). It is, therefore, important that such waste materials are treated rapidly in decentralized units and two options, namely, aerobic composting and biomethanation are available.
Table 1: Composition of municipal solid waste at different stages
Components (%) |
Street bin, before rag picking |
Street bin, after rag picking |
Dump site |
Bangalore overall |
Fermentables |
65 |
78 |
70 |
72 |
Paper |
8 |
4 |
11.4 |
11 |
Miscellaneous |
12 |
15 |
8.7 |
1.9 |
Glass |
6 |
1 |
0.5 |
1.4 |
Polythene /plastics |
6 |
1.9 |
9.1 |
6..2 |
Metals |
3 |
0.1 |
0.3 |
1 |
Dust and sweepings |
NA |
NA |
NA |
6..5 |
The steps, in order of priority, which must be taken for Bangalore are given below:
-
Minimise the production of waste or source reduction: Source reduction is a basic solution to the garbage accumulation. Less waste means less of a waste problem. In many cases, source reduction can be done not necessarily by adopting a high technology but only by inculcation of better personal habits in the people. A reduction in the amount of waste can be achieved by change of consumption pattern and lifestyle, use of more recyclable materials, practice of waste segregation at source and change of manufacturing designs and packaging. Earlier studies indicate that nearly 20 percent reduction in waste generation is possible through simple housekeeping measure that requires no or marginal investment. Proper design and packaging of products with minimum volume of material and longer useful life can reduce the waste considerably.
-
Maximise waste recycling and reuse: Though recycling of solid wastes is extensively practised in Bangalore, the full official recognition of the need for promotion of recycling is yet to come. It is only in recent years that the role of this sector has received some attention. Municipal authorities should actively support recyclables at source schemes by strengthening the informal sector, for example by the provision of sites for sorting of recyclables or perhaps by developing bonus schemes for the workers in the informal sector. There are considerable benefits of increasing solid waste recycling and reuse. Source separation and recycling of waste reduces the volume of the waste to be disposed. Promoting recycling as an alternative to the existing forms of waste disposal may be economically gainful. Authorities may seek competitive bids as the recycling may be a profitable commercial operation generating a net income. Further, thousands of poor people may support themselves and their families by directly or indirectly participating in waste collection and recycling. Many organisations such as Clean Environs, Waste Wise and Centre for Environmental Education in Bangalore help street children and other unemployed people to collect waste from households and give them a right to sell it too.
-
Encourage waste processing at decntralied levels: Organic waste in Bangalore constitutes around 70 percent and is therefore amenable to composting and biogas generation for energy. It is a form of source reduction or waste prevention as the materials are completely diverted from the disposal facilities and require no management or transportation. Diverting such materials from the waste stream frees up dumping space for the material that cannot be composted. Currently composting is provided for only two markets in Bangalore which should be extended to other markets, hotels, restaurants, and households. Composting is quite viable if there is a market for compost. Thus a better understanding of the process, benefits to the environment and public education can promote the practice of composting at least in the cities where sites and skilled manpower are available and markets can be developed. It is also essential to provide basic training and education of workers in technical, health, and safety aspects. City municipality should compost garden and park waste to reduce the quantum of waste for final disposal. Many resident associations in Bangalore have set up their own composting plants. Biogasification is an excellent option in handling the organic wastes. Once the MSW is segregated into fermentable and non-fermentable fractions, even at a >90% efficiency of sorting, MSW becomes amenable for biogas production. Biogasification has several advantages like net energy output and low odour emissions during treatment. Digested material, compost, with or without a post-composting stage, is safe for disposal as manure. A study carried out at Centre for Sustainable Technologies (formerly ASTRA) at Indian Institute of Science revealed that plug flow digesters are very good for biogasification of MSW as it is an excellent feedstock for biogas production and has a very high gas production (both gas production rate as well as specific gas production) to warrant viable decentralized treatment by anaerobic fermentation to biogas. It also requires very little pre-treatment.
-
Promote safe disposal of wastes: Wastes are either burnt or dumped in open spaces and these practices should be restricted as they are deleterious to health and the environment. Landfilling occupies the lowest rung in the integrated waste management, though it is a better option than dumping the waste in open spaces. It relies on containment rather than treatment (for control) of wastes. The purpose of landfilling is to bury or alter the chemical composition of the wastes so that they do not pose any threat to the environment or public health. Landfills are not homogenous and are usually made up of cells in which a discrete volume of waste is kept isolated from adjacent waste cells by a suitable barrier. Commonly used barrier is a layer of natural soil (clay), which restricts downward or lateral escape of the waste constituents or leachate. Sanitary landfilling normally has a double liner to prevent leaching into the groundwater. Appropriate run-off controls, leachate collection and treatment, liners for protection of the groundwater (from contaminated leachate), biogas recovery mechanism (landfill gas contains high percentage of methane due to anaerobic decomposition of organic wastes), monitoring wells, and appropriate final cover design constitute integral components of an environmentally sound sanitary landfill. Proper and regular monitoring should be done at landfill sites.
-
Spatial Decision Support systems: GIS-GPS-MIS systems have proved to be efficient spatial decision support systems (Figure 2) for revolutionizing the waste management systems in Bangalore. A management information system (MIS) aids to manage large amount of spatial and attribute data related to the wards and generate reports (daily, weekly etc) at various levels (city, zone, range etc.) with details of the waste, types of vehicles etc. In Bangalore, trucks are the only means of removing garbage and other waste materials from the city. These vehicles perform multiple trips in a day and it is essential to monitor and track these trucks to improve efficiency. In this regard, global positioning system (GPS) would be helpful and cost effective. It also helps in optimising truck routes thereby increasing the efficiency of the transport mechanism. Analysis of spatial data i.e. land use and land cover pattern, transport network, collection network etc., along with information related to quantity related to quantity and quality of wastes (through GIS: Geographic Information System) enable the authorities involved in waste management to come out with feasible options. These tools have been selected because 80% of information used by the health official has spatial components (city, zone, range and health ward level). Training can be imparted to its personnel in handling and updating the data.
The ISWM approach is designed to minimize the initial generation of waste materials through source reduction, then through reusing and recycling to further reduce the volume of the material being sent to landfills or incineration compared to the conventional approach of simply focusing on disposal of solid waste. Good municipal solid waste management practices require collection of critical information which is not just for keeping the records up to date but for taking corrective measures as well as proper planning for the future. There is also a need for integration and assimilation of information from various levels of jurisdiction. Thus, the strategic approaches for ISWM involve the integration of available data, guidelines and framework and elimination of the constraints. The main objective here is to arrive at a proper storage with least negative environmental impact, efficient collection system, engineered processing and disposal according to the constituents present in the waste stream. Analysis of spatial data, i.e. land use and land cover pattern, transport network, collection network etc., along with the information related to the quantity and quality of wastes (through Geographic Information System) enables the authorities involved in the solid waste management to come out with feasible options. To keep a city clean and maintain healthy environment, the administration has to adopt this approach and set goals for installations to reduce the amount of solid waste being generated, increase the solid waste diversion rate and comply with the existing regulations.
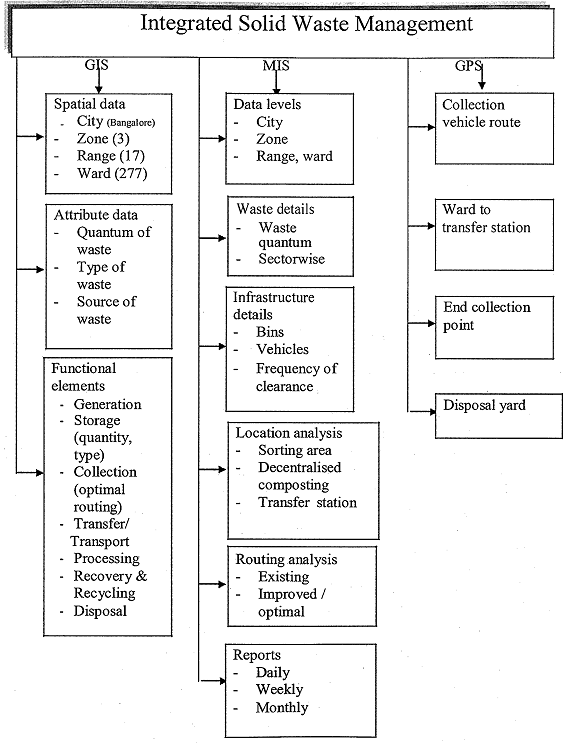
Figure 2: Integrated solid waste management using Geographic Information System (GIS), Management Information System (MIS) and Global Positioning System (GPS)
Focus of the ISWM program includes the following:
- Assessment of present condition and organizational set up
- Reduce, reuse and recycle solid waste to the greatest extent possible.
- Cooperate to the extent practicable in recycling programs conducted by the civilian community (on installations that do not have recycling programs).
- Pursue the use of joint or regional solid waste management programs and facilities with the government and non-government agencies.
- Financial support towards infrastructure and maintenance
- Facilitating community participation in solid waste management activities Intellectual input – research on design, materials, concept
- Privatize solid waste management facilities or contract for waste disposal services, including recycling.
- Divert 60% of non-hazardous solid waste from incineration and landfills. Integrated solid waste management programs can demonstrate an economic benefit (when compared with only landfill and incineration disposal).
- Complying with applicable regulations regarding solid waste management and recycling.
- Overall monitoring and coordination