Corresponding author :
Energy Research Group (CES), Centre for Ecological
Sciences, Indian Institute of Science, Bangalore, Karnataka 560 012, India.
Tel.: +91 80 23600985/22932506/22933099; fax: +91 80 23601428/23600085/23600683 [CES-TVR].
E-mail addresses: cestvr@ces.iisc.ac.in , energy@ces.iisc.ac.in , shwetmala@ces.iisc.ac.in.
URL: http://ces.iisc.ac.in/energy
Citation : Ramachandra, T.V., Shwetmala, Emissions from India’s transport sector: Statewise synthesis, Atmospheric Environment (2009), doi:10.1016/j.atmosenv.2009.07.015 |
Abstract
A decentralized emission inventories are prepared for road transport sector of India in order to design and implement suitable technologies and policies for appropriate mitigation measures. Globalization and liberalization policies of the government in 90’s have increased the number of road vehicles nearly 92.6% from 1980-81 to 2003-04. These vehicles mainly consume non renewable fossil fuels, and are a major contributor of green house gases, particularly CO2 emission. This paper focuses on the statewise road transport emissions (CO2, CH4, CO, NOx, N2O, SO2, PM and HC), using region specific mass emission factors for each type of vehicles. The country level emissions (CO2, CH4, CO, NOx, N2O, SO2 and NMVOC) are calculated for railways, shipping and airway, based on fuel types. In India, transport sector emits an estimated 258.10 Tg of CO2, of which 94.5% was contributed by road transport (2003-04). Among all the states and Union Territories, Maharashtra’s contribution is the largest, 28.85 Tg (11.8%) of CO2, followed by Tamil Nadu 26.41 Tg (10.8%), Gujarat 23.31 Tg (9.6%), Uttar Pradesh 17.42 Tg (7.1%), Rajasthan 15.17 Tg (6.22%) and, Karnataka 15.09 Tg (6.19%). These six states account for 51.8 % of the CO2 emissions from road transport.
Keywords : Greenhouse Gases, emission, India, transport sector, globalization
Introduction
Transport heralds the development of a region. The demand for infrastructure augmentation increases with the region’s pursuit of development goals. The basic infrastructures required for the region’s economic growth are roads, railways, water and air connectivity. With the increase in economic activities, the dependence of fossil fuel based energy sources and consequent green house gas (GHG) emissions have increased rapidly in recent times. The transport sector in India consumes about 16.9% (36.5 mtoe: million tonnes of oil equivalent) of total energy (217 mtoe in 2005-06). Various energy sources used in this sector are coal, diesel, petroleum (gasoline) and electricity. Road, rail and air are responsible for emission of 80%, 13% and 6% respectively (TEDDY, 2006). Vehicular emissions account for about 60% of the GHG’s from various activities in India (Patankar, 1991).
Globalization and liberalization policies of the government has spurted the economic activities. Consequent to this policy change are increase in urbanization and concentrated economic activities in certain load centers resulting in higher mobility. This fuelled the rapid increase in number of vehicles and traveling distance resulting in the higher consumption of energy with an average annual rate of 2.9%. During the last two decades, number of registered motor vehicles has increased dramatically from 5.4 million in 1980-81 to 72.7 million in 2003-04 (TEDDY, 2006). Energy consumption also varies with the modes of transport and public transport system has least average energy consumption per passenger kilometer (Singh, 2006). The urban population of India, which constitutes 28% of the total, is predominantly dependent on road transport. Around 80% of passenger and 60% of freight movement depend on road transport (MoF, 2000). Traffic composition of six mega cities of India (Delhi, Mumbai, Bangalore, Hyderabad, Chennai and Kolkata) shows that there is significant shift from the share of slow moving vehicles to fast moving vehicles and public transport to private transport (Jalihal et al., 2005). Among different type of motor vehicles, percentage of two wheelers has shown rapid growth (doubling in every 5 years) and it constitutes 70% of total motor vehicles of India (MoSRTH, 2004). Total number of road vehicles in India as per the latest available statistics (March 2004) were 72.7 million (MoSRTH, 2007).
Indian railways has important role for long journey movement of both people and freight. In last ten years, there is a sharp increase in number of passenger and goods movement and consequent fuel consumption. Current energy consumption in railways is around 5.1% of total transport energy with about 77.5% from diesel and balance is through electricity (TEDDY, 2007). During 2004-05 Indian civil aviation accounted for more than 24% increase in the number of international and domestic flights, with consequent increase of aviation fuel from 0.98 mt (1976-77) to 6.2 mt in 2005-06. Shipping sector has aided in the movement of about 18 mt of cargo (TEDDY, 2007).
The focus of this work is to develop the statewise inventory of GHG’s from Indian transport sector. Fig.1. depicts India with cities that are important in terms of industrial and economic activities. Emissions from shipping, railways and aviation sectors were computed using the country level data. However, data is available at disaggregated levels for the road sector.
Fig. 1. India with important metropolitan cities
Methods
Emissions from the transport sector depend mainly on type of transport and fuel apart from type of combustion engine, emission mitigation techniques, maintenance procedures and vehicle age. The major pollutant emitted from transport are Carbon dioxide (CO2), Methane (CH4), Carbon monoxide (CO), Nitrogen oxides (NOx), Nitrous oxide (N2O), Sulphur dioxide (SO2), Non-methane volatile organic compounds (NMVOC), Particulate matter (PM) and Hydrocarbon (HC). Diesel is used in public passenger and cargo vehicles, while private two wheelers, light motor vehicles (passenger), car and jeeps use gasoline. In the National capital, Delhi, most of the buses and omni buses and 5% of total cars and jeeps use Compressed Natural Gas (Das and Parikh, 2004).
Quantification of emission factors :
Region specific emission factors of road transport, based on the type of vehicle compiled from various literatures including regulatory agencies (Mittal & Sharma, 2003; EEA, 2001; CPCB, 2007; Kandlikar & Ramachandran, 2000; UNEP, 1999) are listed in Table 1. It is assumed that, diesel is used as fuel in buses, omni buses, taxi, trucks, lorries, light motor vehicles (goods), trailers and tractors, while two wheelers, light motor vehicles (passenger), car and jeeps use gasoline. In Delhi, most of the buses and omni buses and 5% of total cars and jeeps also use Compressed Natural Gas (Das and Parikh, 2004). CO, HC, NOx and PM emissions from CNG based buses were 1.77, 0.88, 2.81 and 0.032 g km-1 and for cars and jeeps were 0.78, 1.55, 0.92 and 0.02 g km-1, respectively (CPCB, 2007). The region specific emission coefficients for emission estimates and net calorific values (NCV) of different type of fuels (ALGAS, 1998; IPCC, 1996; Singh et. al., 2008) are listed in Table 2. Thermal power plant emission factors were used to compute CO and NOx emissions from coal used in railways (Chakraborty et. al., 2008).
Table 1. Emission factors for road vehicles (g km-1)
| |
Bus |
Omni buses |
Two wheelers |
Light motor vehicles (Passenger) |
Cars and jeeps |
Taxi |
Trucks and lorries |
Light motor vehicles (Goods) |
Trailers and tractors |
Othersa |
Reference |
| CO2 |
515.2 |
515.2 |
26.6 |
60.3 |
223.6 |
208.3 |
515.2 |
515.2 |
515.2 |
343.87 |
Mittal and Sharma, 2003 |
| CO |
3.6 |
3.6 |
2.2 |
5.1 |
1.98 |
0.9 |
3.6 |
5.1 |
5.1 |
3.86 |
CPCB, 2007 |
| NOx |
12 |
12 |
0.19 |
1.28 |
0.2 |
0.5 |
6.3 |
1.28 |
1.28 |
3.89 |
CPCB, 2007 |
| CH4 |
0.09 |
0.09 |
0.18 |
0.18 |
0.17 |
0.01 |
0.09 |
0.09 |
0.09 |
0.11 |
EEA, 2001 |
| SO2 |
1.42 |
1.42 |
0.013 |
0.029 |
0.053b |
10.3c |
1.42 |
1.42 |
1.42 |
1.94 |
Kandlikar and Ramachandran, 2000 |
| PM |
0.56 |
0.56 |
0.05 |
0.2 |
0.03 |
0.07 |
0.28 |
0.2 |
0.2 |
0.24 |
CPCB, 2007 |
| HC |
0.87 |
0.87 |
1.42 |
0.14 |
0.25 |
0.13 |
0.87 |
0.14 |
0.14 |
0.54 |
CPCB, 2007 |
aAverage of above value are used for Others
bIndian Institute of Petroleum (IIP), Automotive Research Association of India (ARAI) used in UNEP, 1999
cMittal and Sharma, 2003 |
Quantification of emission :
Emissions from road were quantified based on the number of vehicles and distance travelled in a year per different vehicle type, which is given by
|
Ei = ∑ (Vehj × Dj) × Ei,j,km |
(1) |
Where, Ei = Emission of compound (i)
Vehj = Number of vehicles per type (j)
Dj = Distance travelled in a year per different vehicle type (j)
Ei,j,km = Emission of compound (i) from vehicle type (j) per driven kilometer |
Bottom-up approach (Gurjar et al., 2004) was adopted for estimation of gaseous and particulate emission based on annual average utilization for different vehicle category, number of registered vehicles and the corresponding emission factors. Annual utilization of buses, omni buses, two-wheelers, light motor vehicles (passenger), cars and jeeps, and taxi were assumed to be 100000, 100000, 6300, 33500, 12600 and 12600 km, respectively (buses, two-wheelers, car and auto rickshaw as per Singh, 2006). Similarly for trucks and lorries, light motor vehicles (goods), and trailers and tractors were assumed as 25000 to 90000, 63000 and 21000 km yr-1 respectively (WGRTIPC, 2007). These values were assumed based on five year planning reports of India. For other section of vehicles, annual utilization was calculated based on average of all above values.
Statewise data is not available for railways, shipping and aviation, so emission was calculated based on the different type of fuel consumption (MoPNG, 2007; CMIE, 2007). The CO2 emission in railways, water and air transport (Garg et al., 2001) was estimated based on the consumption of fuel (MoPNG, 2007; CMIE, 2007) and emission factor and is given by:
|
Ei = ∑ Fuelj,k × EFi,j |
(2) |
Where, Ei = Emission of compound (i)
Fuelj,k = Consumption of fuel (j) for transport type (k)
EFi,j = Emission factor for compound (i) emitted from fuel(j)
|
Emissions of CH4, CO, NOx, N2O and NMVOC were estimated (IPCC, 1996) using:
|
Emissions (kt) = Fuel consumption (kt) × NCV (TJ kt-1) × Gas specific emission coefficients (kg TJ-1) |
(3) |
Computation of GHG emission per unit area in metropolitan cities :
Emission loads per unit area were computed to understand the level of emission with increased urbanization, and is given by:
 |
(4) |
Where Ai = Geographical area of ith city, and jth type of vehicle. Total number of vehicles (MoSRTH, 2007) and area (Census of India, 2001) of major metropolitan cities were used in this regard.
Results and discussion
Measurement and quantifications of GHG’s from transport sector is essential for a very fast developing economy like India, in order to design and implement suitable technologies and policies with the appropriate mitigation measures.
Estimates of transport emission:
State and sectorwise inventory of number of vehicles, type and amount of fuel used, age of vehicle is important to develop strategies at regional levels for GHG reduction. Hence an attempt is made to compile these information from various government agencies for GHG emission inventory estimates. However, for railways and aviation sectors, only fuel consumption is available at the National level, which has been used to quantify emissions.
Table 2. Net Calorific Values and emission coefficients used for different fuel types
| |
NCV
(TJ/103 tonnes) |
CO2
(ton ton-1) |
CH4
(kg TJ-1) |
CO
(kg TJ-1) |
NOx
(kg TJ-1) |
NMVOC
(kg TJ-1) |
N2O
(kg TJ-1) |
| High Speed Diesel |
43.33 |
3.18 |
5 |
1000 |
800 |
200 |
0.6 |
| Light Diesel Oil |
43.33 |
3.18 |
5 |
1000 |
800 |
200 |
0.6 |
| Fuel Oil |
40.19 |
3.13 |
5 |
1000 |
800 |
200 |
0.6 |
| Coal |
— |
1.76 |
— |
5.51 g kg-1 |
4.02 g kg-1 |
— |
— |
| Aviation Turbine Fuel |
|
2.94 |
2.64 g kg-1 |
1034 g kg-1 |
3.52 g kg-1 |
— |
— |
| Source: ALGAS, 1998; IPCC, 1996; Chakraborty et al., 2008; Singh et al., 2008 |
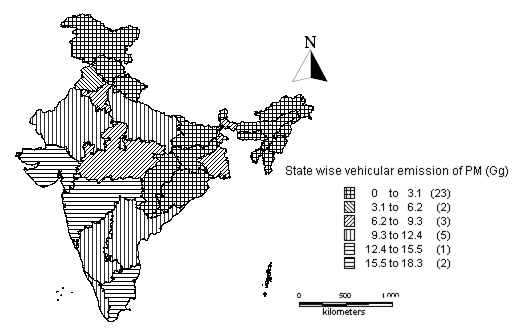
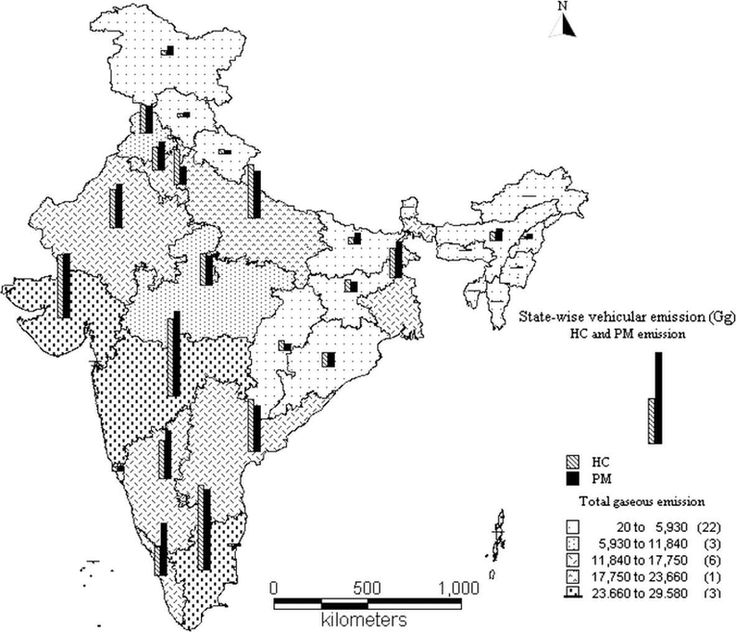
Indian road transport contributes a significant quantities of 243.82 Tg CO2 (94.5%) and smaller quantities of CO, CH4, NOx, SO2, HC and PM. CO2 emission in the road sector, quantified based on 2003-04 data, is given in Fig. 2a. This illustrates that industrially and economically advanced states (Maharastra, Gujarat, Tamil Nadu) contribute maximum compared to other states and average emission for the country is 6.97 Tg. Among the states and UT, Maharashtra’s contribution is the largest, 28.85 Tg (11.8%) of CO2, followed by Tamil Nadu 26.41 Tg (10.8%), Gujarat 23.31 Tg (9.6%), Uttar Pradesh 17.42 Tg (7.1%), Rajasthan 15.17 Tg (6.22%) and Karnataka 15.09 Tg (6.19%). The total of these six states accounts for 51.8 % of the CO2 emissions from road transport. Total CO2 emission from road transport in year 2003-04 is approximately 2.3 times more than in comparison to year 2000 emission. CO, CH4, NOx, SO2, HC emissions and PM is given in Fig.2b to Fig.2g. This shows average statewise emission of CO, CH4, NOx, SO2, HC and PM are 3.62, 63.25, 20.26, 20.67 and 4.37 Gg, respectively. The result further confirms that Gujarat, Maharastra and Tamil Nadu have higher proportion of emissions of CO, CH4, NOx, SO2, HC and PM.
Fig. 2a. CO2 emission from road transport
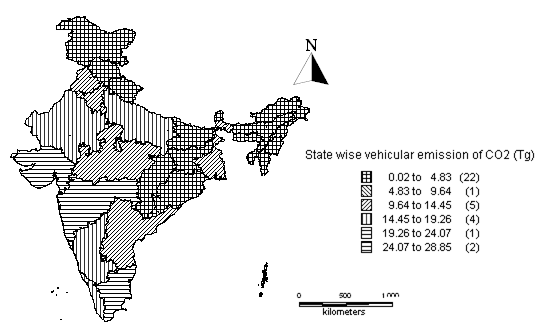
Fig. 2b. CO emission from road transport
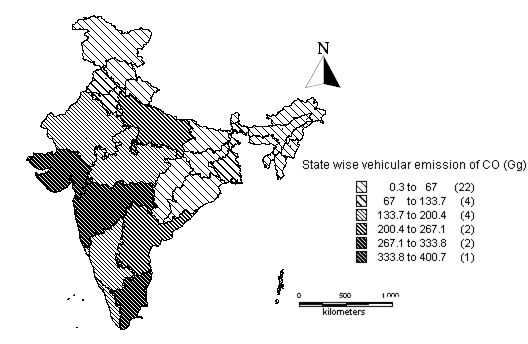
Fig. 2c. CH4 emission from road transport
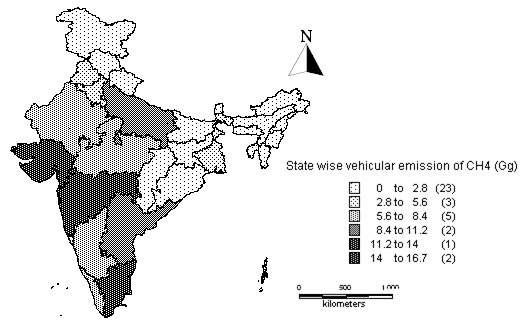
Fig. 2d. NOx emission from road transport
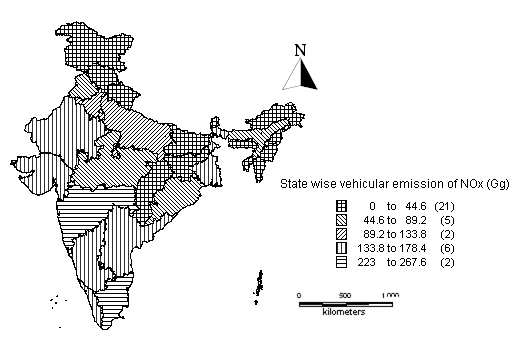
Fig. 2e. SO2 emission from road transport
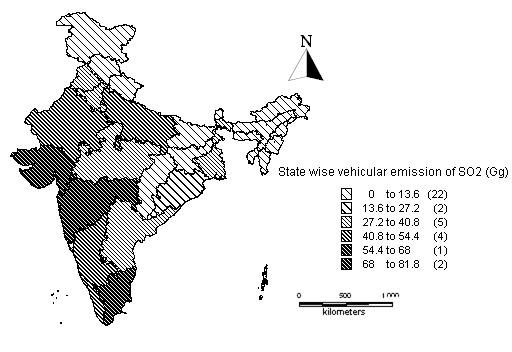
Fig. 2f. HC emission from road transport
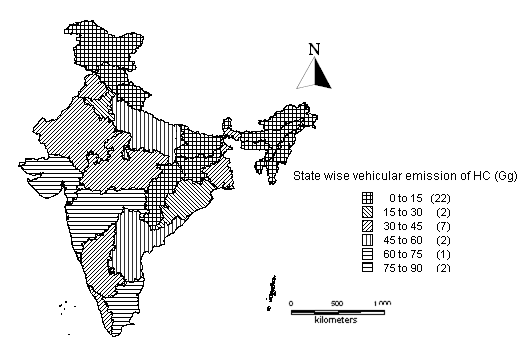
Fig. 2g. PM emission from road transport
In Maharashtra, there is significant increase in state GDP from 2478 to 4380 billion Rs. during 1999 and 2005 (CMIE, 2008). This has also contributed to higher number of private vehicles resulting in higher emissions. With the increase in city size, the traveling distance has become longer; the relative importance of walking and cycling has come down significantly.
The emissions calculated for different type of road transport vehicles are summarized in Table 3. Among different type of vehicles, trucks and lorries contribute 28.8% CO2 (70.29 Tg), 39% NOx (0.86 Tg), 27.3% SO2 (0.19 Tg), and 25% PM (0.03 Tg), which constitute 25% of the total vehicular emission of India. Similarly two wheelers are major source of CO (0.72 Tg; 23.7%), CH4 (0.06 Tg; 46.4%), and HC (0.46 Tg; 64.2%) and buses are emitting NOx (0.68 Tg; 30.7%) and PM (0.03 Tg; 20.5%).
Table 3. Emission from different vehicle types of India (Gg)
| Categories |
CO2 |
CO |
NOx |
CH4 |
SO2 |
PM |
HC |
| Bus |
28748.16 |
207.26 |
679.73 |
5.02 |
79.24 |
31.36 |
51.72 |
| Omni buses |
8508.42 |
60.94 |
200.53 |
1.49 |
23.45 |
9.28 |
15.11 |
| Two wheelers |
8701.08 |
719.64 |
62.15 |
58.88 |
4.25 |
16.36 |
464.49 |
| Light motor vehicles (Passenger) |
4378.10 |
370.29 |
92.93 |
13.07 |
2.11 |
14.52 |
10.16 |
| Cars and jeeps |
23901.22 |
212.30 |
22.14 |
18.17 |
5.67 |
3.22 |
28.01 |
| Taxi |
2367.08 |
10.23 |
5.68 |
0.11 |
117.05 |
0.80 |
1.48 |
| Trucks and lorries |
70288.92 |
491.15 |
859.51 |
12.28 |
193.73 |
38.20 |
118.69 |
| Light motor vehicles (Goods) |
44654.58 |
442.04 |
110.94 |
7.80 |
123.08 |
17.33 |
12.13 |
| Trailers and tractors |
46563.85 |
460.94 |
115.69 |
8.13 |
128.34 |
18.08 |
12.65 |
| Others |
5705.22 |
57.41 |
64.54 |
1.83 |
32.19 |
3.98 |
8.96 |
Vehicular emissions vary with type, efficiency and type of fuel used. Emission analysis based on the vehicle type reveal that bus and omni buses contribute higher CO2 (CO2: 96.5%, NOx: 2.28%) compared to two wheelers (CO2: 86.8%, CO: 7.18%, HC: 4.6%), passenger light motor vehicles (CO2: 86.8%, CO: 7.6%, NOx: 1.9%), cars and jeeps (CO2: 98.8%), taxi (CO2: 94.6%, SO2: 4.68%), trucks and lorries (CO2: 97.6%, NOx: 1.2%), goods light motor vehicles (CO2: 98.4%), and trailers and tractors (CO2: 98.4%) are different.
Total Indian transport emission of CO2, CO, NOx, CH4, SO2, PM, HC, N2O and NMVOC are summarized in Table 4. During 2003-04, total transport emission of CO2 was 258.10 Tg. CO2 contribution of road sector, aviation, railways and shipping was 243.82 Tg (94.5%), 7.60 Tg (2.9%), 5.22 Tg (2%) and 1.45 Tg (0.6%), respectively. Road sector and aviation mainly contribute 3.03 Tg (53.3%) and 2.57 Tg (45.1%) of CO. Among all type (road, shipping, railways and aviation) of transport, road and aviation are the major contributor of air pollution. Emissions from shipping and airway generally not accounted for the National emission inventories, because they occur mostly in international waters and air. Fuel consumption in water and air transport is used to calculate the emission to reflect the respective sectors emission contribution in India. During 2004-05, aviation sector has become second major source of transport emissions as there is tremendous increase in the number of passenger movement and also international and domestic flights. Estimate of 10Gg for 1990 based on fuel consumption pertaining to coal-related CO2 emission from railway transport sector (Garg et al. (2001), is much higher than the value for the emission of CO2 (5.28 Gg) computed for 2003-04.
Table 4. Total emission from Indian transport for 2003/04 (Gg)
|
CO2 |
CO |
NOx |
CH4 |
SO2 |
PM |
HC |
N2O |
NMVOC |
| SHIPPING |
|
|
|
|
|
|
|
|
|
| High Speed Diesel |
782.2800 |
10.6592 |
8.5273 |
0.0533 |
— |
— |
— |
0.0064 |
2.1318 |
| Light diesel oil |
162.1800 |
2.2098 |
1.7679 |
0.0110 |
— |
— |
— |
0.0013 |
0.4420 |
| Fuel oil |
510.1900 |
6.5510 |
5.2408 |
0.0328 |
— |
— |
— |
0.0039 |
1.3102 |
| RAILWAYS |
|
|
|
|
|
|
|
|
|
| Coal |
5.2800 |
0.0155 |
0.0121 |
|
0.0421 |
|
|
|
|
| Electricity |
NOT CONSIDERED |
| High Speed Diesel |
5186.5800 |
70.6712 |
56.5370 |
0.3534 |
— |
— |
— |
0.0424 |
14.1342 |
| Light diesel oil |
6.3600 |
0.0867 |
0.0693 |
0.0004 |
— |
— |
— |
0.0001 |
0.0173 |
| Fuel oil |
25.0400 |
0.3215 |
0.2572 |
0.0016 |
— |
— |
— |
0.0002 |
0.0643 |
| AVIATION |
|
|
|
|
|
|
|
|
|
| High Speed Diesel |
85.8600 |
1.1699 |
0.9359 |
0.0058 |
— |
— |
— |
0.0007 |
0.2340 |
| Light diesel oil |
6.3600 |
0.0867 |
0.0693 |
0.0004 |
— |
— |
— |
0.0001 |
0.0173 |
| Fuel oil |
222.2300 |
2.8535 |
2.2828 |
0.0143 |
— |
— |
— |
0.0017 |
0.5707 |
| Aviation Turbine Fuel |
7294.1400 |
2565.3540 |
8.7331 |
6.5498 |
— |
— |
— |
— |
— |
| ROAD TRANSPORT |
243816.6443 |
3032.1843 |
2213.8552 |
126.7809 |
709.0928 |
153.1271 |
723.4093 |
— |
— |
| TOTAL |
258103.1443 |
5692.1632 |
2298.2880 |
133.8038 |
709.1348 |
153.1271 |
723.4093 |
0.0568 |
18.9219 |
GHG emission per unit area (for metropolitan cities) :
Emission per unit area for metropolitan cities is summarized in Table. 5. Chennai, Bangalore, Kolkata, Delhi and Hyderabad are the five major metropolitan cities of India with large number of industries and play a vital role in Indian economy. In the case of Mumbai, GDP has increased from 90.2 to 149.9 billion Rs. during 1997 to 2005, while human population has increased from 10.8 to 11.9 million (Das and Parikh, 2004). These increases have also increased the total passenger travel demand from 32 to 61 billion passenger kms. Similar situation prevails in other major metropolitan cities in India.
Table 5. Emission from vehicular transport of metropolitan cities
Metropolitan
city |
Number of all road vehicles in metropolitan city |
Ratio |
Geographical area of metropolitan city (km2) |
CO2
(Mg km-2) |
CO
(Mg km-2) |
CH4
(Mg km-2) |
HC
(Mg km-2) |
NOx
(Mg km-2) |
PM
(Mg km-2) |
SO2
(Mg km-2) |
| Hyderabad* |
1355700 |
0.24 |
172.70 |
18258.86 |
281.47 |
13.26 |
78.05 |
197.12 |
13.91 |
55.94 |
| Visakhapatnam |
411691 |
0.07 |
182.70 |
5034.01 |
77.60 |
3.66 |
21.52 |
54.35 |
3.84 |
15.42 |
| Patna |
335623 |
0.45 |
108.34 |
18244.82 |
189.16 |
5.91 |
32.91 |
149.03 |
10.42 |
55.60 |
| Delhi** |
4236675 |
1.00 |
431.09 |
20843.82 |
284.43 |
15.56 |
87.74 |
129.99 |
9.13 |
42.38 |
| Ahmedabad |
1075213 |
0.15 |
281.08 |
12438.69 |
165.52 |
6.67 |
35.49 |
93.20 |
7.52 |
32.99 |
| Surat |
692118 |
0.10 |
212.52 |
10967.65 |
145.94 |
5.88 |
31.30 |
82.18 |
6.63 |
29.09 |
| Vadodara |
586438 |
0.08 |
113.87 |
2481.43 |
21.33 |
0.81 |
5.52 |
29.16 |
1.47 |
8.66 |
| Bangalore |
1890692 |
0.48 |
226.24 |
32013.25 |
405.25 |
16.14 |
86.03 |
323.75 |
22.18 |
93.29 |
| Bhopal |
391579 |
0.10 |
298.48 |
3786.22 |
47.58 |
1.92 |
11.60 |
27.29 |
2.19 |
12.26 |
| Indore |
644771 |
0.17 |
160.45 |
11973.75 |
150.46 |
6.06 |
36.69 |
86.31 |
6.92 |
38.77 |
| Mumbai |
1199416 |
0.13 |
438.00 |
8562.01 |
118.91 |
4.95 |
24.69 |
67.80 |
5.41 |
23.67 |
| Nagpur |
543322 |
0.06 |
217.56 |
7955.70 |
110.49 |
4.60 |
22.94 |
63.00 |
5.03 |
22.00 |
| Pune |
754902 |
0.08 |
430.00 |
5366.96 |
74.54 |
3.10 |
15.48 |
42.50 |
3.39 |
14.84 |
| Ludhiana |
770784 |
0.22 |
159.37 |
14847.91 |
183.90 |
7.52 |
43.43 |
98.33 |
8.09 |
38.70 |
| Jaipur |
823715 |
0.21 |
484.64 |
6571.53 |
72.76 |
2.83 |
17.61 |
65.61 |
4.13 |
18.35 |
| Chennai |
2014776 |
0.23 |
174.00 |
34903.50 |
429.13 |
18.99 |
118.95 |
353.67 |
23.01 |
108.04 |
| Kanpur |
424652 |
0.07 |
266.74 |
4570.50 |
59.85 |
2.56 |
15.07 |
32.01 |
2.65 |
12.30 |
| Lucknow |
614794 |
0.10 |
310.10 |
5616.32 |
73.55 |
3.15 |
18.52 |
39.34 |
3.26 |
15.12 |
| Varanasi |
365913 |
0.06 |
91.90 |
11370.76 |
148.91 |
6.38 |
37.49 |
79.64 |
6.60 |
30.61 |
| Kolkata |
875156 |
0.34 |
186.23 |
22402.15 |
213.94 |
9.10 |
59.66 |
273.55 |
14.23 |
72.07 |
| |
20007930 |
0.34 |
4946.01 |
258209.86 |
3254.71 |
139.04 |
800.68 |
2287.85 |
160.00 |
740.09 |
*Area figure covers area falling in Hyderabad Dist. Ratio= proportion of vehicles in metropolitan city (to that of the state)
**Urban area as in 1991.
Source: MoUD, 2008/Census of India 2001 ; MoSRTH, 2007
With the increase in economic activities number of transport is increasing in restricted area of metropolitan cities. It increases the transport emission load of Indian cities. The introduction of vehicles with stricter emission control may decrease the overall emissions, but the vehicle population growth rate might neutralize that impact in overall emissions (Sharma and Pundir, 2008).
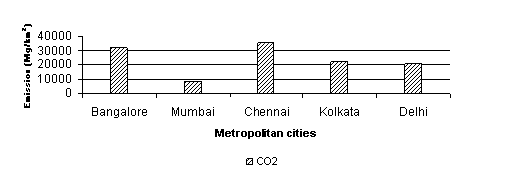
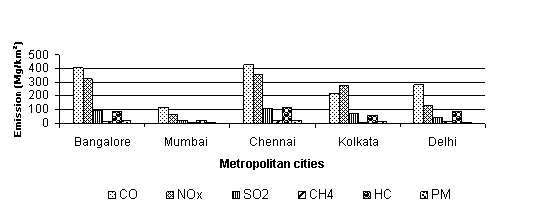
CO2 emission per unit area in five major metropolitan cities (Chennai, Bangalore, Kolkata, Delhi and Mumbai) of India is depicted in Fig 3. Similarly, Fig 4 and 5 depict emissions of CO, CH4, HC, NOx, PM and SO2 per unit area. Number of vehicles in important Indian cities is 20 million, with a share of 28% of total vehicles of India. Chennai, Bangalore, Kolkata, Delhi and Mumbai with 10.2 million vehicles constitute 51.1% of total vehicles of important Indian cities and 14% of total vehicles of India. Total emission per unit area of metropolitan cities is 0.25 Tg km-2 of CO2. Chennai has the largest contribution of 0.034 Tg km-2 (13.5%) followed by Bangalore with 0.032 Tg km-2 (12.4%), Kolkata with 0.022 Tg km-2 (8.7%), Delhi with 0.02 Tg km-2 (8%) and Hyderabad with 0.018 Tg km-2 (7.1%).
Fig. 3. Total emission from road transport in India
One of the main contributors of emissions in Indian transport is from the road sector. Encouraging the use of efficient public transport in place of private transport will help to reduce the number of vehicles. Introduction of more efficient vehicles and fuels, such as CNG or battery operated vehicles, will reduce emissions. However, various urban policies such as metro railway, transport management and emission control practices will further curtail transport emissions.
Fig. 4. Vehicular emission per unit area in major metropolitan cities of India
Conclusions
In India, number of vehicles and there consequent emissions were different for each of the state or UT. Therefore, a decentralized emission inventories were prepared for road transport sector in order to design and implement suitable technologies and policies for appropriate GHG mitigation measures. First time an attempt has been made to calculate decentralized or statewise road transport emission of India, using number of different categories of vehicles and region specific mass emission factors and a country level emission were calculated for shipping, railways and aviation, using different type of fuel consumption.
The total CO2 emission for Indian transport was 258.10 Tg in 2003-04. Among all type of transport, road and aviation were first and second major contributor of air pollution. The road transport sector has contributed 94.5% and 53.3% of total transport emission of CO2 and CO. Among all the states and UT, Maharashtra’s contribution is the largest, 28.85 Tg (11.8%) of CO2, followed by Tamil Nadu 26.41 Tg (10.8%), Gujarat 23.31 Tg (9.6%), Uttar Pradesh 17.42 Tg (7.1%), Rajasthan 15.17 Tg (6.22%) and, Karnataka 15.09 Tg (6.19%). The total of these six states accounts for 51.8 % of the CO2 emissions from road transport. The aviation has contributed 2.9% and 45.1% of CO2 and CO of total transport emission. Shipping is most environment friendly mode of transport. It has contributed only 0.6% of CO2 emission, while railways have contributed 2.0% and 1.2% of CO2 and CO of total transport emission. For aviation, railways and shipping, emissions were also calculated for 2004-05 and 2005-06. Total emission of CO2 from railways, shipping and aviation has increased by 24.2% from 14.29 Tg in 2003-04 to 17.74 Tg in 2005-06. Similarly CO and CH4 emissions have increased from 32.3% and 31.8%, respectively.
Fig. 5. Vehicular emission per unit area in major metropolitan cities of India
Acknowledgments
We thank the Ministry of Environment and Forests, Government of India and Indian Institute of Science for the financial and infrastructure support. We are grateful to Prof. Joshi and colleagues at Energy Research Group for suggestions during discussions.
References
- ALGAS, 1998. India National Report on Asia Least Cost Greenhouse Gas Abatement Strategy. ADB and UNDP, Manila, Philippines.
- Census of India, 2001. Area and Density – Metropolitan Cities, Chapter IV, Report 14 - area , population and density of cities and towns of India -2001, Town and Country Planning Organisation, Ministry of Urban Development, Government of India, New Delhi. http://www.censusindia.net
- Chakraborty, N., Mukherjee, I., Santra, A.K., Chowdhury, S., Chakraborty, S., Bhattacharya, S., Mitra, A.P., Sharma, C., 2008. Measurement of CO2, CO, SO2, and NO emissions from coal-based thermal power plants in India. Atmospheric Environment 42, 1073-1082.
- CMIE, 2007. India's Energy Sector. Center for Monitoring Indian Economy, Mumbai.
- CMIE, 2008. National Income Statistics. Center for Monitoring Indian Economy, Mumbai.
- CPCB, 2007. Transport Fuel Quality for the year 2005. Central Pollution Control Board, Government of India, New Delhi (also cited in TEDDY, 2007).
- Das, A., Parikh, J., 2004. Transport scenarios in two metropolitan cities in India: Delhi and Mumbai. Energy Conversion and Management 45, 2603-2625.
- DfT, 2004. The Future of Transport. Department for transport, UK, 140.
- EEA, 2001. Joint EMEP/CORINAIR Atmospheric Emission Inventory Guidebook. third ed., European Environment Agency, Copenhagen.
- Garg Amit, Bhattacharya Sumana, Shukla, P.R., Dadhwal, V.K., 2001. Regional and sectoral assessment of greenhouse gas emissions in India. Atmospheric Environment 35, 2679-2695.
- Gurjar, B.R., Aardenne, J.A.Van, Lelievelda, J., Mohan, M., 2004. Emission estimates and trends (1990-2000) for megacity Delhi and implications. Atmospheric Environment 38, 5663-5681.
- IPCC, 1996. Revised IPCC guidelines for national greenhouse gas inventories. Reference Manual, Vol. 3. Inter Governmental Panel on Climate Change, Bracknell, USA.
- Jalihal, S.A., Ravinder, K. and Reddy, T.S., 2005. Traffic characteristics in India. Proceedings of the Eastern Asia Society for Transportation Studies 5, 1009-1024.
- Jalihal, S.A., Reddy, T.S., 2006. Assessment of the Impact of Improvement Measures on Air Quality: Case Study of Delhi. Journal of transportation engineering, 482-488.
- Kandlikar, M., Ramachandran, G., 2000. The causes and consequences of particulate air pollution in urban India: a synthesis of the science. Annual Review of Energy and the Environment 25, 629–684.
- Mittal, M.L., Sharma, C., 2003. Anthropogenic emissions from energy activities in India: generation and source characterization (Part II: emissions from vehicular transport in India). Accessed on: 29 March 08.
URL: http://www.osc.edu/research/pcrm/emissions/India_Report_1Pagelayout.pdf.
- MoF, 2000. Economic survey 1999-2000. Ministry of Finance, Government of India, New Delhi.
- MoPNG, 2002a. Motor spirit and high-speed diesel: report on user profile and demand estimation. Ministry of Petroleum and Natural Gas, Government of India, New Delhi.
- MoPNG, 2002b. Annual report 2001–2002. Ministry of Petroleum and Natural Gas, Government of India, New Delhi.
- MoSRTH, 2004. Motor Transport Statistics. Ministry of Shipping, Road Transport and Highways, New Delhi.
- MoSRTH, 2007. Road Transport Year Book 2004/05. Transport Research Wing, Ministry of Shipping, Road Transport and Highways, Government of India, New Delhi.
- MoSRTH, 2007. The Working Group Report on Road Transport for the Eleventh Five Year Plan, 2007. Planning Commission, New Delhi, India: pp 1-83. Accessed on: 29 March 08. URL:
http://planningcommission.nic.in/aboutus/committee/wrkgrp11/wg11_roadtpt.pdf
- MOUD, 2008. http://urbanindia.nic.in/moud/moud.htm
- OCC, Nov 2001. Ready reckoner, Oil Coordination Committee, New Delhi, India.
- Patankar, P., 1991. Urban Transport in India in Distress. Central Institute of Road Transport, Pune, India.
- Sharma, C., Pundir, R., 2008. Inventory of green house gases and other pollutants from the transport sector: Delhi. Iranian Journal of Environmental Health Science Engineering 5(2), 117-124.
- Singh, A., Gangopadhyay, S., Nanda, P.K., Bhattacharya, S., Sharma, C., Bhan, C., 2008. Trends of greenhouse gas emissions from the road transport sector in India. Science of the total environment 390, 124-131.
- Singh, S.K., 2006. Future mobility in India: Implications for energy demand and CO2 emission. Transport Policy 13, 398-412.
- TEDDY, 2007. Teri Energy Data Directory and Yearbook, 2006-07. Tata Energy Research Institute, New Delhi.
- UNEP, 1999. Environmental impacts of trade liberalization and policies for sustainable management of natural resources: a case study on India’s automobile sector. New York, United Nations.
|


 Abstract