2.1 Study area
The city of Bangalore spans over an area of more than 741 km2 and is one among India’s fastest growing city. A current temporal analysis of wetlands, however, indicates a decline of 58% in Greater Bangalore which can be attributed to intense urbanization processes. This is evident from a 466% increase in built-up area from 1973 to 2007 [31]. The undulating topography, featured by a series of valleys radiating from a ridge, forms three major watersheds namely the Hebbal Valley, Vrishabhavathi Valley and the Koramangala and Challaghatta Valleys that forms important drainage courses for the interconnected lake system which carries storm water beyond the city limits [7]. Bangalore, being a part of peninsular India, had the tradition of harvesting water through surface water bodies to meet the domestic water requirements in a decentralised way. After independence, the source of water for domestic and industrial purpose in Bangalore is mainly from the Cauvery River and ground water. Untreated wastewater is let into the storm water drains which progressively converge at the water bodies [7].
The city of Mysore spans over an area of more than 130 km2 is a very first urbanising region. It has five major catchment districts. The topography of the city divides into five prominent drainage basins. The city’s wastewater is let into three wastewater treatment plants through gravity draws. The northern region in handled by a 30.0 MLD STP (Powered by aerators). The south-western regions waste water flows to STP (67.65 MLD) which uses Organic microbe-mix inoculum’s (OS-1&2) for treatment before entering Dalvai kere. Further south is the STP of 60 MLD at H. D. Kote Road working with microbial solutions as inoculums to treat the wastewater. All these plants consist of facultative aerated lagoons followed by sedimentation basins. During the study period the treatment pond basically was functioning as an algal pond. The different wastewater treatment plants, their installed capacities and total water supply in Bangalore and Mysore are provided in Table 1 and Table 2 respectively.
- Manmade lake systems: Varthur and Bellandur Lakes (~500 MLD), Bangalore South.
- Mechanical treatment systems: Aeration and Activated Sludge (75 MLD), Bangalore.
- Facultative pond based systems: STP (67.5 MLD), Mysore.
Table 1: Capacities of Sewage treatment Plants at Bangalore and Mysore.
Sl no. |
Location |
Capacity in MLD |
Treatment Facility |
|
Bangalore - CWSS I, II, III stages |
||
1 |
Vrishabhavati Valley |
180 |
Secondary : Trickling filters |
2 |
K & C Valley I |
163 |
Secondary: Activated sludge process |
3 |
Hebbal Valley |
60 |
Secondary: Activated sludge process |
4 |
Madivala |
4 |
Secondary: UASB + Oxidation ponds + Constructed Wetlands |
5 |
Kempambudhi |
1 |
Secondary: Extended Aeration |
6 |
Yelahanka |
10 |
Activated Sludge process + filtration + chlorination (Tertiary) |
|
|
|
|
|
Bangalore – CWSS IV stage, phase I |
||
7 |
Mylasandra |
75 |
Secondary: Extended Aeration |
8 |
Nagasandra |
20 |
Secondary: Extended Aeration |
9 |
Jakkur |
10 |
Secondary: UASB + Extended Aeration |
10 |
K.R. Puram |
20 |
Secondary: UASB + Extended Aeration |
11 |
Kadabeesananahalli |
50 |
Secondary: Extended Aeration |
12 |
K & C Valley II |
30 |
Secondary: Extended Aeration |
13 |
K & C Valley III |
55 |
Secondary: CMAS |
14 |
Rajacanal |
40 |
Secondary: Extended Aeration |
|
Total |
718 |
|
|
|
|
|
|
Mysore – HWSS I, II and III stages |
||
1 |
Kesare Valley |
30 |
Secondary: Alternate Extended Aeration |
2 |
Vidyranyapuram |
67.5 |
Secondary: Pond based Fermentative bacteria (OS) |
3 |
Rayankere |
60 |
Secondary: Pond based Microbe solution (Fermenta) |
|
Total |
157.5 |
|
|
|
|
|
*- Under progress
Table 2: Total water supply to Bangalore and Mysore cities
Sl.no |
Projects |
Supply capacity (MLD) |
|
Bangalore (CWSS) |
|
1 |
Arkavathy (TG Halli) |
60 |
2 |
Cauvery Stage I |
135 |
3 |
Cauvery Stage II |
135 |
4 |
Cauvery Stage III |
300 |
5 |
Cauvery Stage IV, Phase I |
270 |
6 |
Cauvery Stage IV, Phase II * |
(270) |
7 |
Cauvery Stage IV, Phase III* |
(500) |
|
|
900 (1670) |
|
|
|
|
Mysore (HWSS) |
|
1 |
Hongally WSS (I & II stage), |
30 |
2 |
Hongally WSS (III stage), |
45 |
3 |
Bellagola WSS |
43.5 |
4 |
Melapur WSS |
41.5 |
|
|
160 |
|
|
|
2.2 Field Sampling and Laboratory analysis
Field samplings of influent (1), middle (2) and effluent (3) water samples were carried out between March to August 2011(Figure 2 and 3). The qualities of influents and effluents were assessed to determine the efficiency of the treatment plant.
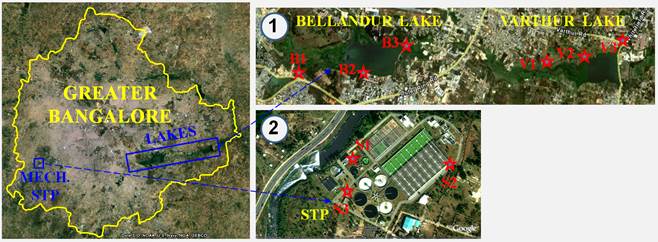
Figure 2: Greater Bangalore: 1) Lake systems and 2) Sewage Treatment plant
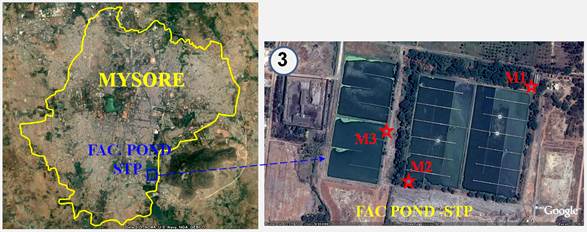
Figure 3: Mysore: 3) Facultative pond based STP
On site analysis was performed to record pH, water temperature, electrical conductivity (APHA method 205), oxidation reduction potential (ORP), total dissolved solids (TDS), salinity, dissolved oxygen (DO), dissolved free carbon-dioxide (free CO2) and turbidity using the standard methods. 1litre sub-sample was analysed according to standard methods (American Public Health Association [32], total biochemical oxygen demand over 5 days (BOD5) (APHA method 507), filtered BOD5, chemical oxygen demand (COD) (APHA, 5220 C), suspended solids (SS) (APHA method 209c), SAR (APHA 1206), turbidity (Hach turbidity meter, APHA method 214a), ammoniacal nitrogen (APHA method 417a), total nitrogen (TN) (APHA method 420a, total nitrogen), Phosphates (APHA, 4500-P D). In addition, visual clarity/transparency of the lake/STP wastewater was measured with a secchi disk. Algal species collected from the lake systems and facultative ponds (both uni-algal and as algal consortia) were cultured and evaluated for their biofuel potential. Lipid quantification (gravimetry), extraction (cell disruption, solvent treatment, thin layer chromatography and solvent separation) and FAME composition were conducted following earlier studies [6].
2.3 Process description
2.3.1 Lake systems: Lake Systems were initially constructed for storage of water to meet the local drinking and other domestic purposes. But, with time the water yield in the catchment has declined due to the unplanned urbanisation driven rapid land use changes and also resulting in the generation of large quantum of wastewater. The series of interconnected lakes convey the city’s wastewater. Consequently, these water bodies act as manmade lagoons performing primary, secondary and tertiary treatment due to the interaction of biotic and abiotic components with sufficient detention time [33, 34]. These water bodies are shallow and the wind causes a great deal of turbulence aiding oxygen diffusion for adequate aeration and mixing. This process is further supplemented by rapid generation of dissolved oxygen by algal photosynthesis [34]. Despite having a massive daily wastewater load of ~500 MLD, the prolific algal growth aided in the uptake of nutrients from these wastewaters further improvising the system’s efficiency. Hydraulic retention time (HRT) for Bellandur lake is ~7-8 d (Figure 4) and Varthur lake is ~5 d (Figure 5) respectively.
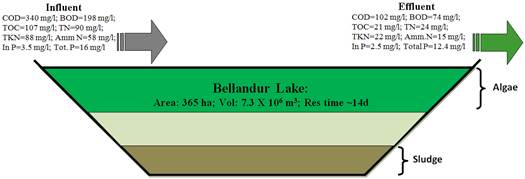
Figure 4: Inflow and Outflow process parameters at Bellandur Lake, Bangalore
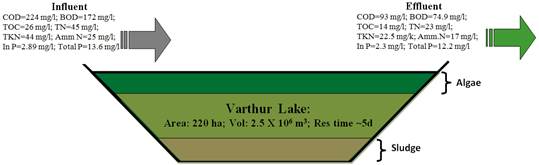
Figure 5: Inflow and Outflow process parameters at Varthur Lake, Bangalore

Figure 6: Inflow and Outflow process parameters at Facultative pond, Mysore

Figure 7: Inflow and Outflow process parameters at Aeration and Activated Sludge STP, Bangalore
2.4 Comparative Valuation of treatment systems - economics, environmental and social aspects
The total annual cost was calculated which essentially comprised of construction (Infrastructure), operation and maintenance (O & M), and land costs (Sato et al., 2007). Infrastructure cost includes procurement of screen, grit chamber construction, wastewater treatment infrastructure, sludge treatment infrastructure, etc. at STP’s. O&M costs include expenses on human resources (wages), energy requirement/power, repair, and essential chemicals. Rs. 4.8 Rs/kWh was taken as the cost involved in power consumption. The wear and tear involved the repair costs for infrastructure/civil structures, mechanical and electrical equipments that are estimated annually as a certain factor/percentage multiplied by total construction cost. The annual repair cost for civil work was calculated at 0.4% and 0.15% of the capital cost for Aeration with activated sludge processes (ASP) and pond processes, respectively. Likewise, the annual repair cost for mechanical and electrical equipment was calculated at 3% of the total construction cost. In addition, it was assumed that mechanical and electrical equipment requires replacement every 6 years. This replacement cost was included in the repair cost. The service life of STP was estimated at 30 years, which served as the period for life cycle cost [35]. The total annual cost was calculated by equation (1):
ACTOTAL = RFCAPITAL x ICTOTAL + OMC .... (1)
where ACTOTAL is the total annual cost, RFCAPITAL the capital recovery factor, ICTOTAL the initial cost (e.g., for construction, land), OMC the operation and maintenance cost (e.g., human resource, power/energy, repair, chemicals).