Bangalore city receives water of about 900 MLD from the Cauvery and about 600 MLD from groundwater. Out of this, wastewaters accounts to ~1200 MLD. The existing sewage treatment plants at Bangalore (Under CWSS I-IV) handles only half of the wastewaters generated (718 MLD) with a modest treatment level, and the rest of the wastewater generated are directed to several lakes and steams. Many of these plants are running at half the installed plant capacity with partial treatment. Such circumstances and associated reasons make it imperative to find a less energy intensive, cost effective and a sustainable wastewater treatment system for Bangalore to handle the city’s wastewaters and treat to acceptable levels. The existing lake systems are playing a major role in treatment of these wastewaters up to satisfactory levels by virtue of its high detention time with the interplay of biotic and abiotic factors [33-34, 36]. The study of the functional aspects of the interactions between biotic and abiotic elements [33-34, 36] in the lake systems have provided the basic understanding to design and formulate an optimal open algal pond treatment system which works on its own without much cost and maintenance to treat huge quantities of wastewaters.
In the case of Mysore the water supply accounts to 160 MLD and about 95 MLD is drawn from ground water sources which sums up to 255 MLD. Assuming 80% of the original water supply being wastewaters, the total wastewater generation in Mysore city hovers to ~204 MLD. Wastewater treatment plants in the city have a net capacity of treating 157.5 MLD indicating a shortfall for sewage treatment for another 50 MLD. The treatment plants were insufficiently running to its intended installed capacity resulting in voluminous untreated and partially treated water that finally joins river Cauvery 12 km and Kapila 40 km downstream and is thus a matter of grave concern for the future water requirement and its security.
3.2 Raw sewage characteristics:
Table 3 lists the raw wastewater characteristics and features and are comparable to domestic wastewater. Higher biodegradability of the wastewater is indicated by the BOD5/COD ratio of 0.60. A meagre 50 MLD is treated up to secondary levels through Aeration and Activated Sludge STP at Bangalore (Installed for 75 MLD) compared to the Bellandur and Varthur lake systems that receive an enormous volume of >500 MLD treating the wastewater up to secondary levels by virtue of its detention time and algal nutrient uptake activity. The Sewage treatment farm with facultative pond system at Mysore has been designed to treat 67.5 MLD but it works at less than half of its installed capacity (~30 MLD) during the study period.
Parameters |
Mean |
+ St Dev |
pH |
7.73 |
0.20 |
Temperature (0C) |
25.70 |
2.68 |
Elec. Conductivity (µS/cm) |
1013.80 |
277.70 |
Total Dissolved Solids (mg/l) |
774.33 |
156.02 |
Total Suspended Solids (mg/l) |
328.00 |
56.00 |
Turbidity (NTU) |
229.23 |
42.84 |
Dissolved Oxygen (mg/l) |
0.22 |
0.35 |
Free CO2 (mg/l) |
48.59 |
19.48 |
COD (mg/l) |
248.50 |
52.48 |
BOD (mg/l) |
152.58 |
31.79 |
Nitrates (mg/l) |
0.63 |
0.50 |
Ammonia (mg/l) |
72.00 |
16.00 |
TKN (mg/l) |
88.00 |
8.00 |
Phosphates (mg/l) |
2.34 |
0.76 |
Total Phosphates (mg/l) |
10.20 |
4.60 |
Alkalinity (mg/l) |
380.00 |
83.90 |
Total Hardness (mg/l) |
296.00 |
108.69 |
Calcium (mg/l) |
72.00 |
12.00 |
Magnesium (mg/l) |
28.00 |
6.60 |
Chlorides (mg/l) |
147.16 |
146.53 |
Sodium (mg/l) |
254.02 |
420.04 |
Potassium (mg/l) |
26.75 |
29.01 |
ORP (mV) |
-121.33 |
85.91 |
|
|
|
Table 3: Physico-chemical characterisation of raw sewage
Fermentative bacteria (Organic Solutions) are fed to this plant as inoculum which helps in COD/BOD, TSS and odour removal. Considering the population of both the cities the average per capita water usage in considered as 120 l/d. The quantity of BOD produced was estimated at 18.2 g/d/person and the amount of TSS was estimated at 39.36 g/d/person.
3.3 Biofuel prospects:
The algae abundant in facultative ponds and lakes showed total lipid contents ~25 - ~28 % (w/w). The morphological and cell surface studies (through electron microscopy) of euglenoides from these facultative ponds showed presence of nano lipid channels (pores) across the striae pattern that possibly help in cellular lipid secretions periodically under stress conditions [37]. The Raman spectroscopic analysis with a confocal attachment of algal lipids in-vivo revealed clusters of lipid scattered across the cell cytoplasm that were associated with pigments as chlorophyll and carotenoids [38]. The uni-algal species showed high unsaturated fatty acids (~52%) compared to the algal consortia grown in batch mode that showed ~24 % unsaturated fatty acids. The order of the dominant fatty acids in the unialgal species are palmitic acid C16:0 (42 %) > linoleic acid C18:2 (22 %) > linolenic acid C18:3 (23%) > stearic acid C18:0 (4 %) (Table 4) [6]. The uni-algal species showed higher polyunsaturated fatty acids (~47%) compared to mono-unsatuared ones (~4 %).
No. |
FAME (Chemical Name) |
Chemical Formula |
RT |
% FAME |
|
Uni-algal |
Consortia |
||||
1 |
Butanedioic acid, di-methyl ester |
C6:0 |
7.49 |
- |
2.76 |
2 |
Dodecanoic acid methyl ester |
C 12:0 |
19.023 |
0.04 |
- |
3 |
Methyl tetradecanoate |
C14:0 |
24.92 |
1.40 |
0.84 |
4 |
Tetradecanoic acid, 12-methyl ester |
C14:0-12 CH3 |
26.91 |
- |
1.61 |
5 |
Pentadecanoic acid methyl ester |
C 15:0 |
28.529 |
0.11 |
- |
6 |
Methyl 4,7,10,13-Hexadecatetraenoate |
C16:4(4,7,10,13) |
29.99 |
- |
1.90 |
7 |
7,10-Hexadecadienoic acid, methyl ester |
C16:2(7,10) |
30.27 |
- |
1.14 |
8 |
7,10,13-Hexadectrienoic acid, methyl ester |
C16:3(7,10,13) |
30.47 |
- |
1.67 |
9 |
7-Hexadecenoic acid, methyl ester |
C16:1(7) |
30.66 |
- |
1.38 |
10 |
9-Hexadecenoic acid methyl ester |
C 16:1 (9) |
31.038 |
3.36 |
- |
11 |
Hexadecanoic acid, methyl ester |
C16:0 |
31.61 |
42.05 |
42.30 |
12 |
Heptadecanoic acid, methyl ester |
C17:0 |
34.42 |
0.11 |
0.95 |
13 |
8,11,14-Eicosatrienoic acid, methyl ester |
C18:3(8,11,14) |
35.92 |
- |
0.05 |
14 |
Methyl Octadecatetraenoate |
C18:4(6,9,12,15) |
35.94 |
- |
0.30 |
15 |
6,9,12-Octadecatrienoicacid methyl ester |
C 18:3(6, 9,12) |
36.352 |
1.47 |
- |
16 |
9,12-Octadecadienoic acid, methyl ester |
C18:2(9,12) |
36.49 |
22.22 |
5.27 |
17 |
9-Octadecadienoic acid (Z)-methyl ester |
C18:1(9) |
36.74 |
- |
10.87 |
18 |
11-Octadecadienoic acid, methyl ester |
C18:1(11) |
36.84 |
1.09 |
1.42 |
19 |
9,12,15-Octadecatrienoic acid methyl ester |
C 18:3(9,12,15) |
37.131 |
22.98 |
- |
20 |
Octadecanoic acid, methyl ester |
C18:0 |
37.63 |
3.68 |
25.69 |
21 |
Eicosanoic acid, methyl ester |
C20:0 |
43.08 |
0.18 |
0.42 |
22 |
Docosanoic acid, methyl ester |
C22:0 |
48.39 |
- |
0.38 |
23 |
Tetracosanoic acid, methyl ester |
C24:0 |
51.69 |
1.31 |
0.36 |
24 |
Hexadecanoic acid, methyl ester |
C26:0 |
53.80 |
- |
0.38 |
25 |
Octacosanoic acid, methyl ester |
C28:0 |
55.52 |
- |
0.32 |
Saturated FA |
48.89 |
76.00 |
|||
Unsaturated FA |
51.11 |
24.00 |
|||
Monounsaturated FA |
4.45 |
13.67 |
|||
Polyunsaturated FA |
46.66 |
10.33 |
|||
Unsaturated to Saturated FA ratio |
1.05 |
0.32 |
|||
C16-C18 FA |
96.95 |
91.04 |
|||
|
Total Lipid Content (%) |
24.60 |
28.50 |
||
Table 4: FAME composition of Algal Lipids [6, 15].
The algal consortia tested in laboratory mostly comprising of euglenoides and members of Chlorophyceae showed ~76 % of saturated fatty acids compared to uni-algal species. In contrast to uni-algal species monounsaturated fatty acids were high (~14 %) compared to polyunsaturated ones. The order of dominant FAME is given by palmitic acid C16:0 (42 %) > stearic acid C18:0 (~26 %) > oleic acid C18:1 (~11 %) > linoleic acid C18:2 (~5 %) (Table 4). In both uni-algal and consortia of algae the percentage of C16 – C18 (desirable fatty acids from a bio-diesel perspective) is >90 %. The FAME gas-chromatograms of uni-algal species and wastewater algal consortia cultured in laboratory [15] reactors are elucidated in figure 8. Such algae have been also tested for its growth, nutrient removal and lipid production in continuous culture systems that yielded high biomass density close to 1 g/l with good lipid productivities ~50 mg/l/d with high P stocks (2-3 %) in algal cells [39] and thus can create new avenues in decentralised wastewater treatment and energy generation. During such continuous operations these mixed algal species form flocs, which float on the surface of the bioreactor (in the final stages) enabling easier harvesting and concentrating algae for biofuel production.
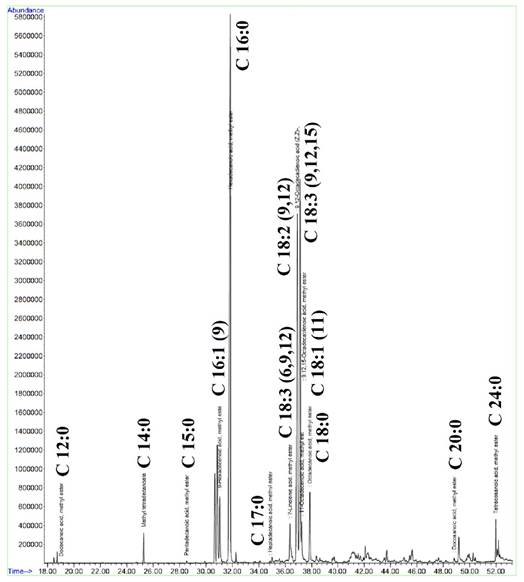
Figure 8. Gas Chromatogram of FAME Mix from Euglena sp. [6]
More than 1200 MLD of domestic wastewater is generated in Bangalore city [33]. There is a scope of resource recovery from the nutrient laden waters in the city [40-42]. The algal rich water bodies (urban algal ponds) help in 70-80 % nutrient and ~90 % C removal from influent wastewaters [33]. These algae could be harvested for use as bio-fuels. Algae proliferate due to nutrient enrichment in the water bodies, and subsequently die after the growth cycle. Apparently the organic matter, dead algal matter and other debris in the lower strata of these water bodies decompose and critically reduce dissolved oxygen (DO) rendering the system anaerobic favouring GHG emissions.
The present algal biomass productivity in the wastewater fed algal reactor systems tested in the laboratory was ~0.1 g/l/d. It is reported that species like Euglena can potentially produce 6.52 tonnes of lipid crude per hectare per annum [9]. If algal ponds are used for treating the entire wastewater generated in Bangalore, then on an average ~120 tonnes of algal biomass can be generated every day. If only 50% of the biomass is harvested, with an average lipid content of ~25 % (as per present experiment), then daily 15 tonnes of lipid crude could be produced. As per earlier experiments 20-30 % of the crude lipids is TAG, therefore ~3.75 tonnes/day of bio-diesel can be generated that yields ~1125 tonnes of bio-diesel/annum. Earlier studies have shown a reasonably high calorific value of the dried wastewater algae (heat value ~18 MJ/kg) showing the potential of whole cell algae for energy generation without cell disruption and expensive solvent treatments [43]. After lipid extraction the spent biomass that is left out mainly comprising of carbohydrates and proteins can be reutilised for energy generation via fermentation yielding bio-ethanol (heat value ~30 MJ/kg), or pyrolysis producing liquid crude (heat value >30 MJ/kg). In the due course the sludge produced in these algal bioreactors could be used for biogas generation (heat value ~21 MJ/m3) and the slurry left behind after bio-methanation can be used as potential manure [44].
3.4 Treatment plant Efficiency:
The treatment of wastewater has been assessed through conventional water quality parameters: COD, BOD, TSS, TDS, P and N. The differences at inlet and at outlets reveal the efficiencies of the respective treatment. The aeration based mechanical treatment systems showed high removal of COD (74%), BOD (63%; Figure 9) but has low removal efficiency of total nitrogen (TN) (~8%; Figure 10) and P (~2%; Figure 11). TSS removal is about ~88% (Figure 112). These results are tabulated in Table 5.
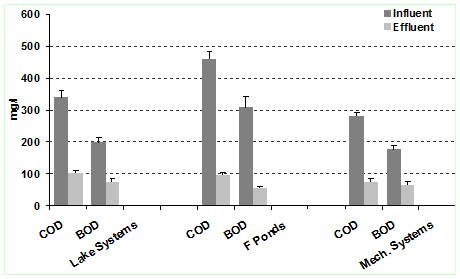
Figure 9: COD and BOD removal in the three systems
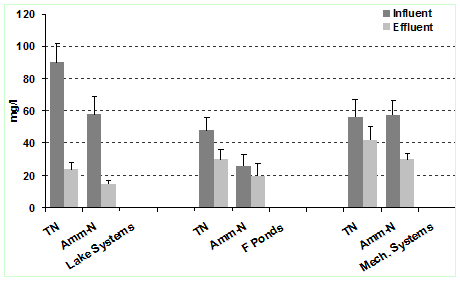
Figure 10: TN and Ammonia-N removal in the three systems
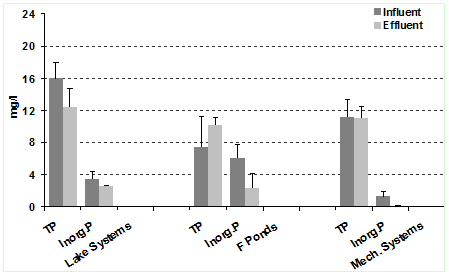
Figure 11: TP and Inorganic P removal in the three systems
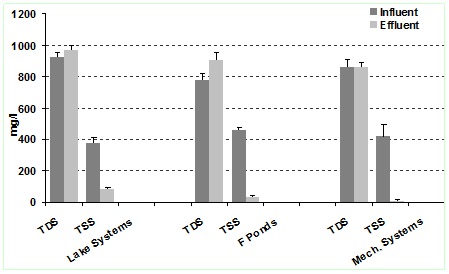
Figure 12: TDS and TSS removal in the three systems
Parameters |
Lake based Systems |
Facultative pond |
Mechanical Aeration |
|||||||||
Bellandur |
Varthur |
Mysore |
Bangalore |
|||||||||
Infl. |
Effl. |
%Rem |
Infl. |
Effl. |
%Rem |
Infl. |
Effl. |
%Rem |
Infl. |
Effl. |
%Rem |
|
COD(mg/l) |
340 |
102 |
70 |
224 |
93 |
58.5 |
458.7 |
96 |
79.07 |
282 |
73 |
74 |
BOD(mg/l) |
198 |
74 |
62 |
172 |
74.9 |
56.4 |
307 |
55.1 |
82.02 |
177 |
65.4 |
63 |
TSS(mg/l) |
380 |
83.6 |
78 |
288 |
79 |
72.5 |
460 |
32 |
93.4 |
418 |
9 |
98 |
Turbidity(NTU) |
386 |
71.2 |
81.5 |
325 |
65 |
80 |
326 |
16 |
95 |
329 |
6.58 |
98 |
TN(mg/l) |
90 |
24 |
73 |
45 |
23 |
48 |
47.25 |
30.4 |
35.7 |
62 |
57.4 |
8 |
Amm-N(mg/l) |
58 |
15 |
74.1 |
25 |
17 |
32 |
25.67 |
20.99 |
18.2 |
42 |
29.8 |
29 |
Nitrates(mg/l) |
0.72 |
0.88 |
-22 |
0.64 |
0.62 |
3 |
0.202 |
0.015 |
92.5 |
1.05 |
0.24 |
77 |
Inorg. P(mg/l) |
3.5 |
2.5 |
28 |
2.89 |
2.3 |
20.4 |
6.08 |
2.37 |
61 |
1.28 |
0.126 |
90 |
Total P(mg/l) |
16 |
12.4 |
22.5 |
13.6 |
12.2 |
10.2 |
7.36 |
10.12 |
-37.5 |
11.2 |
10.99 |
2 |
|
|
|
|
|
|
|
|
|
|
|
|
|
Facultative pond based treatment in Mysore has higher removal efficiency of BOD (82%; Figure 9) and TSS (93%; Figure 12) compared to N (36%; Figure 10) and almost no removal of P (Figure 11). In case of pond based systems, the removal efficiencies are dependent on its working/operations i.e. aerobically or facultatively (Table 5). As per earlier reports, the aerobic ponds have detention times of ~3–10 days and facultative ponds, 5–30 days [45]. Longer retention in facultative ponds aids in the higher removal of N and pathogens [46-48].
Earlier studies have reported high removal efficiency of BOD (90–95%), TSS (90–95%), and faecal coliforms (92–99.99%) and lower removal of TP (10–20%) and TN (15–25%) in the mechanical treatment systems. The stabilisation/facultataive pond based treatment has comparably high removal efficiency of TSS (90–95%), and faecal coliforms (90–99.90%) but has medium to high removal efficiency of BOD (75–95%), and low to medium removal efficiency of P (10–50%) and TN (10–60%) [49-53, 45, 54-56] as shown in Table 6.
Table 6: Comparative analysis of the STP treatment techniques with nutrient removal efficiencies
No. |
Place (STP’s) |
Treatment Approaches |
Effective Approach |
% Removal |
Reference |
1 |
Ixtapan de la Sal, Mexico |
[High rate Clarifier + Anaerobic pond + Facultative Pond + Maturation Pond.]; |
[High rate Clarifier +Anaerobic pond +Facultative Pond +Maturation Pond.] |
84% BOD |
28 |
2 |
Yamuna river basin, India |
UASB and Facultative pond units |
Facultative ponds |
67%COD |
21 |
3 |
Mpumalanga, South Africa (14 STP’s) |
Ponds; Activated Sludge; [Ponds + Trickling Filters]; |
[Activated Sludge + Ponds] |
99% F Coli. |
29 |
4 |
Santa Catarina, Brazil (Swine wastewater) |
Stabilisation ponds |
Aerobic Facultative pond |
83% COD |
30 |
5 |
Mysore, India (3 STP’s) |
[Alternate Aeration + Maturation pond]; |
Facultative Ponds |
82% COD |
23 |
6 |
Bangalore, India (2 STP’s) |
Extended Aeration; High rate aeration with Biofilters |
Extended Aeration |
28 % TS |
22 |
7 |
New Delhi, India (16 STP’s) |
Activated Sludge, Extended Aeration, Trickling Filters, High rate Aeration, Oxidation pond, BIOFORE (Phy, Chem & Bio treat.) |
Extended Aeration, Oxidation Pond and BIOFORE |
99% F Coli. |
19 |
8 |
|
Man made lakes: huge open lagoons |
Facultative pond based systems |
79% COD |
Present Study |
|
|
|
|
99% bacteria |
|
F Coli: Faecal coliform
The large lake based system showed a moderate removal efficiency of COD (70%; Figure 9), BOD (62%; Figure 9) with a comparably high removal of N (73%; Figure 10) and TSS (78%; Figure 12).. The characteristics of the effluent normally indicates of treatment efficacy and also the nature of discharge options for potential reuse.
3.4 Valuation of Sewage treatment systems
3.4.1 Economic evaluation:
Figure 13 compares initial investment costs of the existing treatment systems in Indian cities. These analyses are based on the cost required to treat - million litres per day (MLD). The analysis showed higher initial and OM costs for mechanical systems with ~100 lakhs/MLD and ~6.8 lakhs/MLD/annum compared to pond based systems with ~40 lakhs/MLD and ~1 lakhs/MLD/annum respectively. The mechanical treatment systems are either suspended growth processes or attached growth processes. The suspended growth processes mainly involves two techniques as extended aeration and activated sludge. The former operates at lower organic loading and high cell retention time. However the activated sludge process is conducive for small populations as a large bioreactor volume is required to attain high cell retention. The operating and the process costs of both the techniques are influenced by the SS removal capacity and the age of the treatment unit. In addition to this in case of activated sludge technique the costs are related to the removal efficacy of organics.

Figure 13: a) Comparative Capital and OM cost for different technologies and
b) Comparative Annual cost and annual resource recovery for different technologies
The attached growth processes are pronounced for small populations. During the bacterial bed processes the OM costs are determined by the age of the treatment unit alone. However the other variants of the attached systems as bio-disks and peat bed techniques [5] require material replacement at very frequent intervals, so the plant age becomes insignificant and the SS removal efficiency decides the OM costs of the treatment unit.
The final stages of the treatment involve various techniques for tertiary treatment as membrane bioreactors, ultrafiltration, micro-filtration, Ferric chloride-polyelectrolyte addition, reverse osmosis etc. These unit processes helps in achieving a better water quality at the end of the chains if the treatment cascades. In such cases the OM costs are directly influenced by the organic content left in the system and nutrient (N and P) removal efficiencies. The manmade lakes are almost free treatment units with the minimum cost. Operation and maintenance (OM) costs associated with wastewater treatment comprise of man power, energy/power, and replacement and reinstallation purchase of equipments, chemicals. Figure 13 a) illustrates cost requirement for mechanical treatment, which is ~2.5 times higher than a facultative pond system and ~5 times higher than manmade lake systems, if these options are implemented for treatment purposes. The higher cost in mechanical systems is due to highly mechanised equipment with energy intensive processes. In the present study massive algal biomass were observed in lakes and to an extent in certain parts of facultative ponds that had a lipid content ranging from 18~30 % (w/w) of the dry biomass. In such conditions the value added algal biomass in turn can generate revenue by algal biofuel production. Considering the worth of algae from such non-mechanically aerated systems, an annual resource recovery of ~0.75 lakhs/annum can be derived from man made lake systems compared to ~0.3 lakhs/annum in case of mechanically aerated systems only when sludge bio-methanation and recycled water selling is carried out. Thus the annual cost (OM-Resource Recovery Cost) is negative in case of lake systems compared to higher annual costs of >6 lakhs in case of mechanically aerated systems (Figure 13 b). The cost calculations are tabulated in Table 7.
The cost of community wastewater treatment (user cost) depends on thetreatment process, its efficiency, population size served and the method adopted for the effluent discharge. The smaller population incur more charges (user cost) than the larger population with a larger plant capacity. Therefore the user costs can too high to individuals in smaller communities, especially low-income dwellers. The pond based systems are cost effective as it can potentially reduce costs by at least one-half [57].
3.4.2 Environmental Evaluation:
The energy consumptions are mostly due to the operation and maintenance costs during aeration and pumping of water and solids [58]. Figure 14 depicts varied energy needs across different wastewater treatment technologies. Here the activated sludge/aeration tank based processes require more energy than either facultative ponds or lake based systems. Higher carbon footprint is associated with high energy use. For a population of 1000 people the activated sludge system maygenerate ~1400 ton of CO2 for operation and 50 ton of CO2for maintenance over a period of 15 years [59].
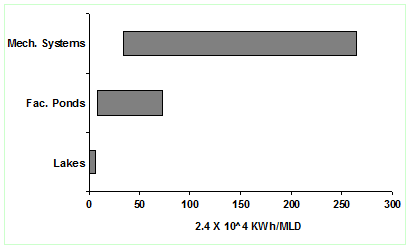
Figure 14: Total energy requirements in different wastewater treatment plants
Among many viable approaches, algal pond based systems helps in treating wastewater while generating energy. The type of materials selection for the treatment technology has its own embodied energy. The conventional mechanical treatment systems comprise of concrete infrastructures with an embodied energy of 18.4 to 1580 MJ/M litres [60]. The energy analysis (Figure 14) showed that the mechanically aerated systems requires much larger energy (~0.72 to 6.36 million units/MLD) compared to facultative ponds (~0.36 to ~1.68 million units /MLD) and a very low energy ~0.02-0.24 million units/MLD is required for lake systems accounted for energy cost (weed removal, sludge clearance etc.) incurred for electricity and maintenance.
3.4.3 Social Evaluation:
The public participation is an important criterion while selecting a suitable wastewater treatment system and for a particular community. People’s participation and their opinion on treatment and disposal options would help in the further refinement. In India most of the urban dwellers are unaware of the type of wastewater treatment happening around them. At the same time they pay charges to the urban bodies for sanitation services. One of the essential criterions for assessing the role of public is the assessment of level of knowledge/awareness among the users [61]. Today affordability and the appropriateness of the technology are considered critical leading to the adoption of cost-effective appropriate technology over more mechanized technology [62].
A larger plant capacity is indicative of a large population. Mechanical and pond based can meet the treatment requirements for a large population than other treatment processes. In this context the mechanically driven systems are opted over pond based systems in urban areas in India where there is low land/open space availability. In this context for assessment of sustainability of any treatment systems suitable ways of evaluation of such systems is a prerequisite. This involves computing appropriate mass balances, assessment of nutrients fluxes from a systems perspective and cause-consequence evaluation. This helps in proper estimation of nutrients in various sub-systems in the treatment process tha helps in evading the accumulation/deficiency of nutrients.
The gaseous by-products during the wastewater containment and treatment may generate foul odour. This results in hampering the aesthetics and raises societal concerns and seeks regulatory measures. Forced aerated systems have a higher foul odour generation potential compared to pond based systems due to unhandled solids/particulates. In mechanically aerated systems these aeration and activated sludge system at Bangalore the foul odour problems emanates from wastewater containment in pipes, storage basins, pumping units and at manholes in different locations. However the foul odour from treatment units can be due to higher total maximum daily load (TMDL) or due to accumulation of surface scum and also from sludge deposits. Sludge accumulation from facultative pond based systems may also contribute to the problem. According to WEF, 1992 the unit processes in treatment plants as Primary clarifiers and Trickling filters have a higher odour potential compared to aeration which has a moderate odour potential and finally the lagoon/pond based systems and secondary clarifiers have low/moderated odour potential. In the present study the lake systems were found to have a small odour compared to the other technologies attributed to a higher organic load and release of H2S.
Human resource requirement depends upon the plant capacity. According to WEF, 1992, an average of one member (staff) is needed to manage the treatment plant (1 MLD). Thus smaller pond based plants require small work force, contrary to mechanical driven systems that need more staff.
Awareness and the level of environmental aspects is a crucial social factor for the treatment practice survival processes. The level of sophistication /complexity of a wastewater treatment system often decides the type of operator skill needed for the plant operation based on their educational skills. In the present study the STP based on more mechanization as in case of the extended aeration based treatment process involved more technically sound labourers, supervisors and well qualified plant engineers unlike the pond based system where there is no much requirement of a technical staff. Earlier studies shows that factors like lack of proper systems understanding in process control and operation leads to limitation in the performance in treatment plants [46].
The open space availability is yet another important evaluation criteria where in the mechanical systems having a short hydraulic retention time (HRT) of 3-8 h [56], indicative of a much smaller land requirement compared to the facultative pond based systems that require more land area due to a longer detention time. The minimum land area requirement for energy intensive mechanical systems (extended aeration/ASP), Facultative pond systems and partial mix aerated ponds systems varies from 0.1acre/MLD, 12-42 acre/MLD and 7-12 acre/MLD [56]. The land requirement for the current study showed 0.08 Ha/MLD, 0.6 Ha/MLD and >1 Ha/MLD for Mechanical systems, Facultative pond based systems and Lake based systems respectively (Table 7). The land to total cost trade off of the various wastewater treatment systems currently studied is illustrated in Figure 15.
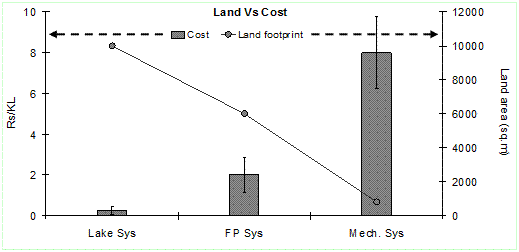
Figure 15: Land vs. cost trade off for wastewater treatment systems
Table 7: Valuation of treatment (Economies and Net annual costs) technologies
Evaluation Approaches |
Unit |
Existing |
Facultative |
Mechanical Systems |
Economic |
|
|
|
|
Construction costs |
Rs in Lakhs/MLD |
20 |
40 |
100 |
Operation and maintenance |
Rs in Lakhs/MLD |
0.62 |
1.16 |
6.6 |
User cost |
Rs/month |
-- |
18 |
30 |
Annual Res Recovery |
Rs in Lakhs/yr |
0.77 |
0.06 |
0.33 |
Net annual cost |
Rs in Lakhs/yr |
-0.15 |
1.1 |
6.27 |
|
|
|
|
|
Environmental |
|
|
|
|
Avg. Energy use |
kWh/MLD (kWh/m3) |
0.05 X 10⁶ |
1.7 X 10⁶ |
5.98 X 10⁶ |
Chemical oxygen demand(COD) |
% Removal |
70 |
79 |
74 |
Biochemical oxygen demand(BOD) |
% Removal |
62 |
82 |
63 |
Total suspended solids (TSS) |
% Removal |
78 |
93 |
88 |
Turbidity (NTU) |
% Removal |
80 |
95 |
98 |
Nitrogen (TN) |
% Removal |
73 |
36 |
8 |
Phosphorus (TP) |
% Removal |
22 |
-- |
2 |
|
|
|
|
|
Social |
|
|
|
|
Public participation |
Qualitative measure |
yes |
no |
no |
Community size served |
Population/MLD |
8000 |
13000 |
11428 |
Aesthetics |
Measured level of nuisance from odour |
Moderate |
Moderate |
High |
Human resources to operate plant |
Staff/MLD |
-- |
0.2 |
0.32 |
Level of education/awareness |
Operational requirements |
average |
good |
higher |
Availability of Open space |
Hectare/MLD |
1 |
0.6 |
0.08 |
3.5 Sustainability of the treatment systems:
Here the sustainability of the existing wastewater treatment systems has been studied considering the economic, environmental and social aspects.
The conventional mechanical systems are capital and energy intensive apart from higher running costs leading to high user cost. Furthermore such systems have high foul odour generation affecting the aesthetics of the surrounding region. These systems contribute less to the economy of a community by employing the less number of staff per plant capacity, than other treatment systems. Such energy intensive processes being control systems driven requires less human resources and meagrely contributes to the revenue/economy of the society when compared to other treatment systems as ponds. Despite these setbacks in achieving sustainability, the mechanical systems of wastewater treatment are efficient in BOD, TSS and pathogen removal.
The facultative pond based processes are economical while providing a large community open space and efficiently taps nutrients as N and P through bioremediation. Aeration of the pond systems usually adds additional costs in terms of infrastructure and energy (OM cost) compared to non-aerated pond systems [55]. Foul odour generation is seasonal (especially in summer) in ponds. However the studied facultative pond systems did not pose any type of odour. In terms of cost (infrastructure and OM) and energy usage the pond systems are beneficial with high solids, nutrient and pathogen removal providing maximum stabilisation to the treated effluent that makes them appropriate for treatment at decentralised/community levels.
The design of the existing pond systems can be further improvised by increasing the no of ponds and specifically constructing an anaerobic pond that provides better C removal and solid settling. The BOD in the effluent of the pond systems are mainly the algal BOD. Therefore a suitable algal trap mechanism (dark algal settling chamber) is envisioned. This design/alternative treatment option would function by integrating the wastewater treatment algal pond systems with the algal capture mechanism by provisions a novel settling chamber (unpublished design).
Although these pond systems require large area than mechanized systems, they can contribute more to the economy of the plant by generating revenue by algal biomass capture and subsequent lipid production.. Of all three systems, the facultative pond based treatment systems has the least overall impact (Table 7) and also the integrated nutrient treatment efficiency (Table 8). Advantages of facultative pond based systems are lower infrastructure and OM cost and low energy footprint and results in a small user cost with high BOD, SS, N and pathogen removal and low foul odour generation. The land intensive pond systems garners a large open space for societal interaction and provides better employment, which adds revenues to the local economy. Finally the algal biomass growing in this type of wastewater is useful as feedstock for biofuel thus fostering sustainability. The present study highlights algae based lake systems and facultative pond based systems to be more sustainable choice, considering economic, societal, and environmental issues.
Table 8: Nutrient Integrated Treatment Efficiencies
Treatment Unit |
Area (ha) |
Capacity/ |
Nutrient Integrated |
Desired |
Driving Factor |
Bellandur Lake |
365 |
595 |
58.75% |
90% |
TN |
Varthur Lake |
220 |
600 |
43.17% |
90% |
TN |
Facultative ponds |
25 |
67.5 |
62% |
90% |
BOD |
Aeration and Activated sludge STP |
7.5 |
75 |
42.75% |
90% |
TSS |
3.6 Nutrient Integrated Treatment Efficiency for the various Sewage Treatment systems
The investigation on the physical, chemical and biological parameters reveals efficiencies considering the influent wastewater characteristics, detention time and performance of micro-biota in bioremediation. This suggests the need to devise a cumulative efficiency indicator/index that determines the systems efficiency of the treatment unit which aid as an important decision making tool for further downstream treatment and management of the wastewater.
Colmenarejo et al. [26] reported an efficiency indicator in terms of treatment parameters (TSS, COD, BOD5 and NH3-N) to evaluate the efficacy of treatment units. In the present study, a new nutrient integrated treatment efficiency is suggested by considering the meanof TSS, BOD, TN and TP efficiencies in removal. Ideally the efficiency of such systems in the tropical climate should be closer to 90 %.
NITE = 1/4 [ETSS + EBOD5 + EN + EP]
Where, NITE is the Nutrient integrated treatment efficiency in (%),
ETSS is efficiency of turbidity removal (%),
EBOD5 is efficiency of BOD5 removal (%)
EN is efficiency of N removal (%)
EP is efficiency of P removal (%)
The above results reveals a very lower Nutrient integrated efficiency of the effluent indicating an immediate requirement of an additional detention unit which would help the improvement of the NITE values.