10.0 Unplanned and Unrealistic Urbanization in Bangalore: BNP’s Tragedy
Bangalore is experiencing unprecedented rapid urbanization and sprawl in recent times due to concentrated developmental activities with impetus on industrialization for the economic development of the region. This has led to large scale land cover changes with the serious environmental degradation,posing serious challenges to the decision makers in the city planning and management process involving a plethora of serious challenges such as climate change, enhanced greenhouse gases (GHG) emissions, lack of appropriate infrastructure, traffic congestion, and lack of basic amenities (electricity, water, and sanitation) in many localities, etc.(Ramachandra, et bal., 2012a; 2012b; 2014a; 2016) apart from threatening the very existence of BNP. Urbanization during 1973 to 2016 (1005% concretization or paved surface increase) has telling influences on the natural resources such as decline in green spaces (88% decline in vegetation), wetlands (79% decline) and sharp decline in groundwater table (Ramachandra et al., 2016).
Figure 1:Unrealistic Urban growth in Bangalore
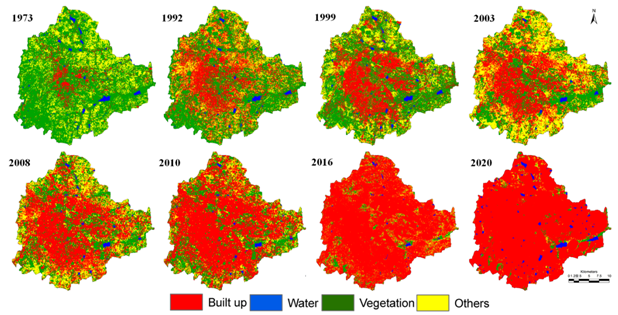
Figure 1 highlights unrealistic urbanization during the last two decades. Quantification of number of trees in the region using higher spatial and spectral resolution remote sensing data with field census reveal 1.5 million trees and human population is 9.5 million, indicating one tree for every seven persons in the city (Ramachandra et al., 2014a). This is insufficient even to sequester respiratory carbon (ranges from 540-900 g per person per day). Geo-visualisation of land use during 2020 through multi-criteria decision making techniques (AHP: Analytical Hierarchal Process) reveals that 93% of Bangalore landscape will be filled with buildings, etc. This growth would certainly pose serious threat to the existence of BNP, which has been helping in sequestering carbon and moderating the climate of Bangalore.
10.1 MODELING AND VISUALIZATION OF LIKELY CHANGES IN BNP
(Likely Implications without ESZ status)
The various systems existing such as forest/urban are very dynamic due to existing socio-economic and environmental factors acting at a variety of scales. Modeling and visualization helps in understanding and managing dynamic entities, so that system integrity is maintained. Dynamic modelling framework encompasses the decision support capability by integrating socio-economic and environmental factors representing spatial dynamics with a high level of geographical detail. Rapid advances in availability of temporal data and geospatial models have made it increasingly possible to design and simulate spatial patterns for land use change (Ramachandra et al., 2014b). CA (cellular automata), Markov chains, multivariate statistics, optimization, system dynamics,multi criteria evaluation (MCE), CLUE (Conversion of Land Use and its Effects model) and various other modeling approaches are existing to visualize complex pattern and prediction. The Markov model is based on a stochastic theory based on random process systems for the prediction and optimal control theory method (Jiang et al., 2009). The Markov explains the quantification of conversion states betweenthe land use types through the transfer rate among different land use types.Though, Markov model for land use changes has been widely used, butwith the traditional Markov model alone it is difficult to predict the spatial pattern of land use changes.CA model has a strong space conception, which is a strong capability of space-time dynamic evolution with complex space systems. So, Markov with CA model together can be used for to simulate the spatial variation of the system effectively.
The integrated Markov-cellular automata (CA_MARKOV) is a robust and effective modeling approach in analyzing spatio temporal land use land cover changes with integration of geographic information system (GIS) and temporal remote sensing data (Kamusoko et al., 2009; Bharath et al., 2016). CA-Markov based simulation provides vital information for understanding forest structure dynamics. CA is a discrete, spatially explicit extended dynamic system characterized by a simple structure of individual elements, called cells (Yang and Li, 2007), which evolve in discrete time steps according to a various transition rules (Bharath et al., 2014). CA-Markov analysis incorporates rules based on consideration of biophysical and socioeconomic data to define initial conditions, parameterise the Markov-cellular automata model, calculate transition probabilities, and the neighbourhood rules with transition potential maps. CA models consist of a simulation environment with a set of transition rules determine the attribute of each given cell consists of a finite number of k possible states, updated synchronously in discrete time steps according to a local, identical interaction rule. The state of a cell is determined by the previous states of a surrounding neighborhood of cells. The transition rules for neighborhood conditions are determined from empirical analyses of land use change map and other critical landscape features. The transition rules of CA models well patronage in quantifying temporal and spatial complexities of forest systems.
The present study aims in visualizing and quantifying changing forest cover by 2027 in BNP and 5 km buffer. The CA-Markov analysis has incorporated various land use decisions in transition rules from 1999-2009; 2009-2015, which are further aided for predicting 2021 and 2017. The land use maps of 1999-2015 were reclassed as five categories for effective visualization as explained in Table 1. The base land use map of 1999 and 2009 data for generating simulated land use map of 2015, which has validated with actual 2015 land use map (Figure 2). The transition areas and probabilities were computed from 1999-2009 land use maps (Table 2).The net neighbourhood influences were determined by 5×5 contiguity filter explains past land use changes and used to simulate future changes.The validation results showed in Table 3 provides a very good agreement between the actual and predicted maps of 2009, 2015 land use with kappa of 0.86. The Kappa-standard index of optimum point of the diagram as well as Kappa-location index were computed proves a significant correlation between the simulated and the actual maps (Table 3). The simulated land use map of 2015 has good accuracy as compared with actual land use of 2015. Based on the evaluation the land use map of 2021 has generated by using base land use maps of 2009-2015. The time stamp of 6 years was maintained based on existing land use datasets. The land use projections were made for 2021 and further projected land use map of 2027 has been generated based on 2015 land use and projected 2021 map. The projected land use of 2027 depicts the loss of forest cover from 41.38% to 35.59% and shows an increase in urban area from 4.49 to 9.62 % due to various layouts in the periphery. The barren land has reduced from 4.17 to 3.36 % by conversion of open spaces to urban. The forest cover present in southern parts represents minimal disturbances (connected to Tali reserve forest and Cauvery wild life sanctuary), whereas northern portion shows more transitions. The uncontrolled and unplanned growth of greater Bangalore would have irreversible impact on forests of BNP. The regions of Kolifram gate, BatterayanaDoddi village, Weavers colony, Kalkere region and Bannerghatta village, Anekal road represents higher loss in forest cover due to new paved surfaces created in the form of townships. The barren lands and fallow lands near to state highways and major roads were converted as layouts resulted in creating new agriculture areas in gomla and other fragmented forests. Bilwaradahalli village, Bhoothanahalli, Gulakamale, UttarahalliManavartha Kaval (Gullahatti Kaval) regions located in the periphery of BNP boundary are losing their forests due to new developments, quarriesand mining. Figure 5 highlights the regions which is likely to undergo major transition in 2027 in BNP and buffer area. The built-up area expansion in Anekal industrial area, Kalkere, Basavanapura and Weavers colony,UttarahalliManavartha Kaval are the major regions represents urban growth. The proposed layouts in the buffer region of BNP are overlaid on visualized growth by 2027 in Figure 6. The proposed layouts would pose serious threat on BNP’s forest cover and agriculture area in the periphery of BNP region, which are evident from the predicted land use of 2021 and 2027.
Table 1: Land use classes considered for the analysis.
S.NO. |
Land use categories |
Description |
1. |
Forest |
Moist deciduous forest, Dry deciduous forest, Scrub/grass lands and forest plantations |
2. |
Agriculture |
Agriculture fields, permanent sown areas, Coconut and other commercial plantations |
3. |
Open fields |
Rocks, Quarry pits, Barren land |
4. |
Water |
Rivers, Tanks, Lakes, Reservoirs, Drainages |
5. |
Built-up |
Residential Area, Industrial Area, Paved surfaces |
Table 2: Transition probability matrix based on land use of 1999-2009.
Given |
Probability of changing to |
Forest |
Agriculture |
Barren land |
Water |
Built-up |
Forest |
0.783 |
0.1649 |
0.0252 |
0.0022 |
0.0246 |
Agriculture |
0.025 |
0.9 |
0.025 |
0.025 |
0.025 |
Barren land |
0.1573 |
0.259 |
0.4493 |
0.0026 |
0.1318 |
Water |
0.1055 |
0.0803 |
0.0165 |
0.7011 |
0.0967 |
Built-up |
0.025 |
0.025 |
0.025 |
0.025 |
0.9 |
Table 3: Accuracy of the analysis.
Index |
Simulated 2015 |
Kno |
0.93 |
Klocation |
0.86 |
Kstandard |
0.87 |
Table 4: land use analysis of BNP 1999-2015.
Year |
1999 |
2009 |
2015 |
Categories |
Ha |
% |
Ha |
% |
Ha |
% |
Forest |
58300.50 |
47.90 |
51458.70 |
42.28 |
50372.60 |
41.38 |
Agriculture |
52760.60 |
43.35 |
58445.60 |
48.02 |
58977.00 |
48.45 |
Barren land |
7554.26 |
6.21 |
7349.00 |
6.04 |
5075.30 |
4.17 |
Water |
1170.80 |
0.96 |
1251.60 |
1.03 |
1834.00 |
1.51 |
Built-up |
1934.90 |
1.59 |
3216.00 |
2.64 |
5462.10 |
4.49 |
Total area |
121721.06 |
Table 5: Simulated and projected land use of BNP from 2015- 2027.
Year |
Simulated 2015 |
Projected 2021 |
Projected 2027 |
Categories |
Ha |
% |
Ha |
% |
Ha |
% |
Forest |
49444.88 |
40.62 |
45895.57 |
37.67 |
43315.05 |
35.59 |
Agriculture |
58208.18 |
48.64 |
60411.02 |
49.67 |
60207.03 |
49.46 |
Barren land |
6668.57 |
4.66 |
5030.71 |
4.13 |
4460.76 |
3.66 |
Water |
2011.68 |
1.65 |
2033.13 |
1.67 |
2031.11 |
1.67 |
Urban |
5387.75 |
4.43 |
8350.63 |
6.85 |
11707.15 |
9.62 |
Total area |
121721.06 |
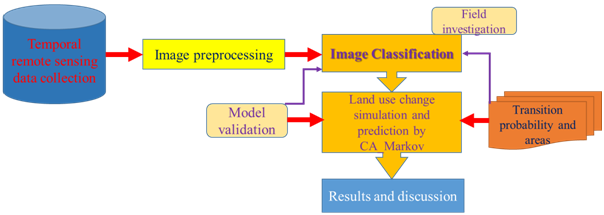 Figure 2: Method used for the analysis.
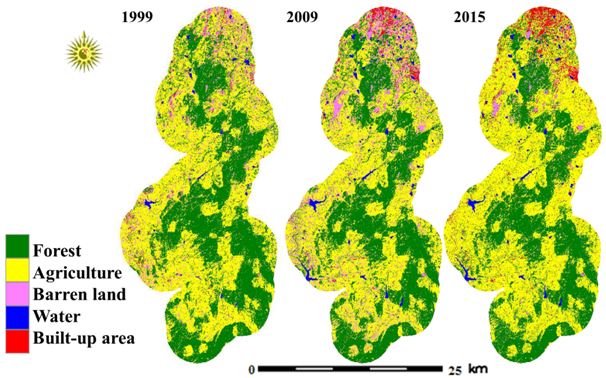 Figure 3: Land use maps of BNP from 1999 to 2015.
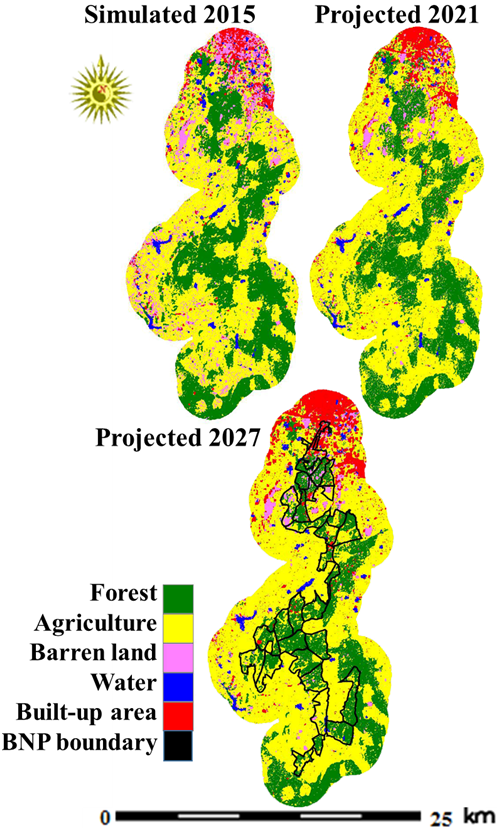 Figure 4: Simulate and projected land use of BNP 2015-2027.
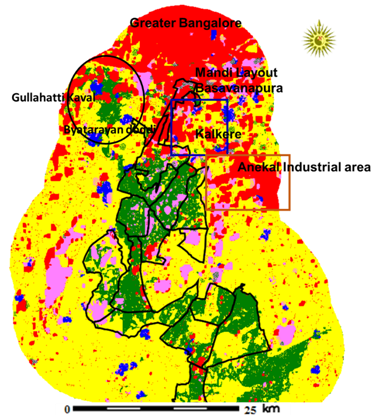 Figure 5: The regions likely to experience higher land use changes
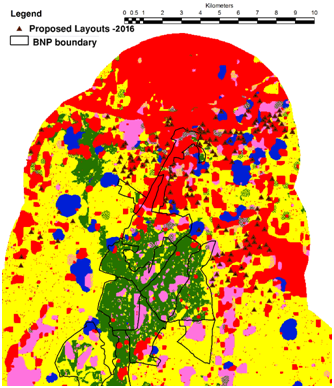 Figure 6: Proposed layouts overlaid on predicted land use of 2027.
References:
- Bharath, S, Rajan, K S,Ramachandra, T V, 2014. Status and future transition of rapid urbanizing landscape in central Western Ghats-CA based approach. ISPRS Annals of the Photogrammetry, Remote Sensing and Spatial Information Sciences, 2(8), 69.
- Bharath, S., Rajan, K.S., Ramachandra, T.V., 2016. Geo-visualisation of landscape dynamics in Sirsi and Haliyal forest divisions of Central Western Ghats, In proceedings of National Conference on Challenges of Civil Engineering Innovations (NCCCEI 2016), At Bangalore; Sri Venkateshwara College of Engineering NH 7, Vidyanagar, Bengaluru International Airport Road.
- Jiang, G.H., Zhang, F.R., Kong, X.B., 2009. Determining conversion direction of the rural residential land consolidation in Beijing mountainous areas, Transactions of the CSAE 25 (2), 214–221.
- Kamusoko, C., Aniya, M., Adi, B., &Manjoro, M., 2009. Rural sustainability under threat in Zimbabwe–simulation of future land use/cover changes in the Bindura district based on the Markov-cellular automata model. Applied Geography, 29(3), 435-447.
- Ramachandra T V and Uttam Kumar, 2009. Land surface temperature with land cover dynamics: multi-resolution,spatio-temporal data analysis of Greater Bangalore, International Journal of Geoinformatics, 5 (3):43-53
- Ramachandra T V, Asulabha K S, Sincy V, Sudarshan Bhat and BharathH.Aithal, 2016. Wetlands: Treasure of Bangalore, ENVIS Technical Report 101, Energy & Wetlands Research Group, CES, IISc, Bangalore, India
- Ramachandra T V, Bharath H. Aithal and Uttam Kumar, 2012b. Conservation of wetlands to mitigate urban floods, Resources, Energy, and Development 9(1): 1–22
- Ramachandra T.V., Bharath H. Aithal, Vinay S., Rao G.R., Gouri Kulkarni, Tara N M and Nupur Nagar, 2014a. Trees of Bengaluru, ENVIS Technical Report 75, ENVIS, Centre for Ecological Sciences, IISc, Bangalore 560012, Pp75
- Ramachandra, T.V., Bharath H. Aithal and Durgappa D. S. 2012a. Insights to urban dynamics through landscape spatial pattern analysis, Int. J Applied Earth Observation and Geoinformation, 18; 329-343, http://dx.doi.org/10.1016/j.jag.2012.03.005.
- Ramachandra, T.V., SetturuBharath and AithalBharath., 2014b. Spatio-temporal dynamics along the terrain gradient of diverse landscape, Journal of Environmental Engineering and Landscape Management, 22 (1), pp. 50-63.
Acknowledgement: We thank Dr. Sunil Panwar, Deputy Conservator of Forest (DCF), Bannerghatta National Park, Karnataka Forest Department, Bangalore-560 083 for entrusting the study and making all necessary arrangements (vehicle, staff, etc.) during field research. We are grateful to Mr.VishnuNarainand R K Mission, Shivanhalli for arranging local logistics (accommodation, food, etc.). We acknowledge the support from field staff of forest department for accompanying the research team and sharing their knowledge.