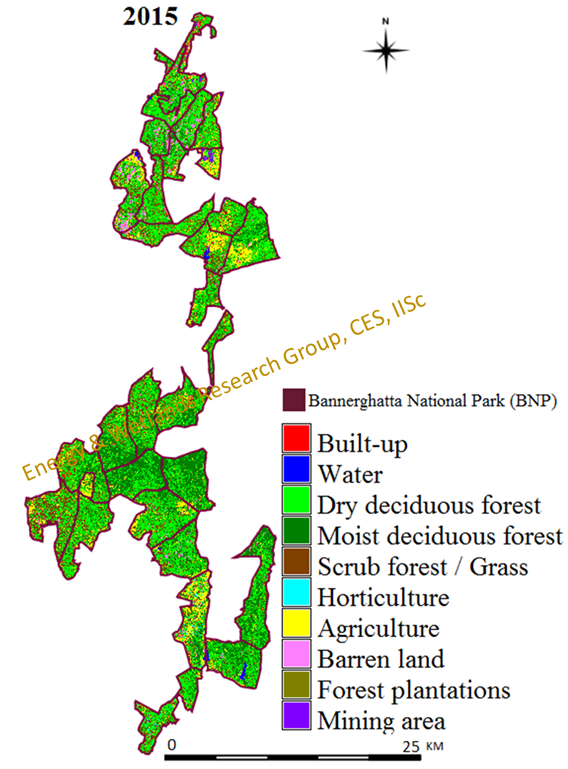
Land use Land cover (LULC) of Bannerghatta National park (BNP) is analysed using temporal remote sensing data to understand the status and land use changes. The land cover analysis reveals loss of vegetation cover from 85.78 to 66.37 % (1973-2015) and non- vegetative areas constitute 33.63% (2015). The land use analysis has been carried out in BNP and in buffer region (5km). Land use changes within BNP region are minimal as compared to buffer region. The moist deciduous forest covered 50.4% (1973)and now 28.5 % (2015) due to anthropogenic pressure in BNP and its environs. Forests in Ragihalli, Manjunatha, Yelavantha, Bettahalli regions with good protection measures show minimal disturbance. However, implications of unplanned urbanization are evident in the buffer regions. Land use analyses in the buffer region (5 km) analysis highlights of urban sprawl in peri-urban regions has fragmented, dispersed urban patches in periphery accounting to 5462 ha(built-up area). The region has lost moist deciduous cover from 26.1 to 13.8 % with an increase in horticulture 8.5 to 11%(1973-2015). The region had lostthe large tracts of deciduous cover in Kanakapura taluk, Anekal taluk regions due to intensified horticulture activities and deforestation. Urbanization in the vicinity of ecologically sensitive national park in the form of housing layouts, etc. highlights the extent of unplanned senseless urbanization and also mirrors the extent of fragmented governance. This has further impacted agricultural tract in northern portion. Now, new agriculture lands are being created in common lands (gomala, revenue lands, etc.) of Kanakapura taluk, Anekal taluk. The mining of resources is another major threat to BNP and estimate indicates that about 1538.7 ha is occupied by mining activities.Identification of localities for housing layouts, industrial complexes and commercial education institutions in the close proximity of NP further highlights lack of vision among regional planners and lack of appropriate acumen in the current breed of decision makers. This analysis suggests that there has is a need to identify and restrict activities in buffer regions to protect ecologically sensitive national park. BNP is vital for Bangaloreans as it helps in moderating climate, sequester carbon, oxygen production and wide array of flora of medicinal importance. The conservation of this region requiresinventorying, mapping and monitoring of biological resources.
Ecologically Sensitive Regions (ESRs’) are the ‘ecological units’ that may be easily affected or harmed. It is a bio-climatic unit (as demarcated by entire landscapes) wherein human impacts would cause irreversible changes in the structure of biological communities (as evident in number/ composition of species and their relative abundances) and their natural habitats’ (Section 3 of the Environment (Protection) Act 1986 (EPA)). This approach of conservation or ecological planning considers spatially both ecological and social dimensions of environmental variables.The eco-sensitive regions (ESR) in the vicinity of BNP (buffer regions) are identified based on forest cover status, faunal distribution, human-elephant conflict regions, elephant migratory paths, etc. This would also help in minimizing human animal conflicts, conservation of biodiversity, etc.Regions were prioritized asESR 1 to ESR 4. Among these, ESR-1 and ESR-2 should be considered as no-go area without any major anthropogenic activities.ESR-1 represents zone of highest conservation and no further degradation be allowed. ESR-2 has potentiality to become as ESR-1 provided with strict regulations and improvement of forests and its environs by more protection. These regions have to be conserved to protect habitat of wild fauna, which helps in minimizing human animal conflicts and instances of wild fauna straying to the city. ESR-3 is a moderate eco-sensitive region, where controlled developmental activities are allowed and ESR-4 can be utilised for sustainable development. The region has 69 villages under ESR-1, 78 villages under ESR-2, 79 villages under ESR-3 and 176 villages under ESR-4.
INTRODUCTION
Land use Land cover (LULC) information provides insight to bio-geophysical processes and spatio-temporal changes due to anthropogenic pressures. The land cover is referred as biophysical attributes of the earth’s surface, while land use refers to the use of land for human purpose or usage of the biophysical attributes (Lambin et al., 2001; Ramachandra et al.; 2012a; 2012b). Land cover categories include forest, mountains, desert, water whereas, land use refers to the human induced changes in the land cover for agricultural, industrial, residential, recreational purposes. Forests support livelihood as grazing land for animals, etc. Land cover changes by anthropogenic activities such as illegal logging, mining and continued unsustainable exploitation of resources, etc. have been posing serious threats to the survival of ecosystems. The land management policies, population, agricultural production and urban expansion are considered as main drivers of LULC change. Deforestation, is the widespread phenomenon of land cover change resulted in the loss of more than a third of all forest cover worldwide over the past half century (Sexton et al., 2013; Ramachandra et al., 2014). Deforestation results with the degradation of forests, or the long term reduction of tree canopy cover below the 10% and thereby lower country’s economy, its capacity to supply products and services(FAO, 2009).Fragmented forests are likely to suffer from being smaller, more isolated with greater edges beyond the direct impacts of forest loss and expanding anthropogenic activities (Rands et al., 2010; Ramachandra et al., 2013a; 2013b).LULC changes alter the homogeneous landscape into heterogeneous mosaic of patches. This leads to the division of habitat into smaller and more isolated patches. The fragmentation results in the division of continuous forest area which alters the structure of the landscape affecting ecosystem functional abilities, evident from the decline of biodiversity, hydrology, etc. (Ramachandra et al, 2013a, 2013c). Uncontrolled LULC changes in a forested landscape will result in destruction and degradation of natural ecosystems, natural resources availability (Vinay et al., 2013), biodiversity (Bharath et al., 2014; Ramachandra et al., 2013b), induces change in local climate (Chase et al., 1999; Bharath et al., 2013; Ramachandra et al., 2015a: 2015 b) as well as to global climate (Yang et al., 1999). Unplanned urbanization leads to urban sprawl in the outer peripheral region gradually affecting the local ecology and environment (Ramachandra et al., 2012a; 2012b; 2012c; 2014).This type of transformation brings changes in the agricultural practices, policies, settlement structures, livelihood and industrial settings. The impact of deforestation in forest landscapes is evident from impaired hydrological processes, biochemical cycles soil erosion and water yield.LULC changes are prime factors for soil degradation (Ross et al., 2006) and reduced ecosystem services by affecting the ability of biological systems to support human needs.
LULC mapping and monitoring provide vital information of landscape and environmental status, distributions, and spatial patterns.LULC information also reflectsthe overall perspective of the landscape characteristics,changing economic and socialconditions in a region. The advancement of technologies in vegetation mapping has been providinga precise evaluation of the spatio-temporal patterns of forestdynamics andenvironmental consequences.For sustainable utilization of the forested ecosystems, it is essential to know thelimitations of various land uses, natural characteristics, quality, productivity, suitability.There is a growing awareness of LCLC change impacts on hydrologic, ecologic, climatic, and biologicprocesses over space and time. LULC change information at temporal scale helps the decision makers, planers to enumeratethe influence of human action on land surface conditions,ecosystem processesrequired for effective management of natural resources. Data acquired through space borne sensors (Remote sensing data)help in monitoring LULC change because of the repetitive coverage at short intervals. Remote Sensing (RS) with improvements in spectral, spatial andtemporal resolutions with Geographical Information System (GIS)techniques have been useful in monitoring land use changes of even inaccessible areas within a short span oftime.RS technique has proven to be a cost effective tool, which provides synoptic coverage of areas of interest and facilitatesto quantify LULCchange,and consequent impacts due to industrialisation, urbanisation and other developmental activities. These specifications of RS can therefore greatly contribute to local, regional as well as global mapping and monitoring of change in LULC.Objective of the current study is to assess the current status and trendsin spatio-temporal patterns of forest cover in and around BNP region during 1989 to 2015.
METHOD
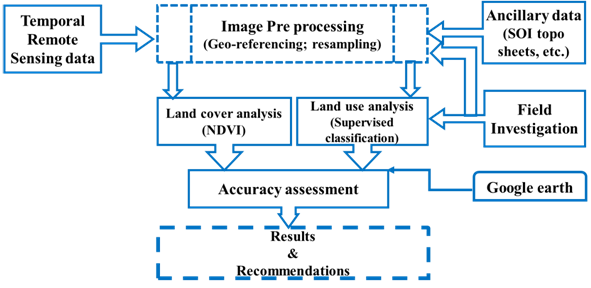
LULC changes in BNP region has been analysed with the help of temporal remote sensing data (RS), ancillary data (collateral data compiled from government agencies) and field investigations. Multi resolution RS data acquired through the sensors of U.S. Geological SurveyEarth Observation Satellites (EOS), Indian remote sensing system (IRS) at temporal scale has been used for spatio-temporal analyses. Figure 1, outlines the method followed in the analysis. RS data used in the study are (i) Landsat MSS (1973), TM (1989, 1999), Landsat ETM+ (2009), downloaded from public domain (http://landsat.org), (ii) IRS p6L4X (2015) (http://nrsc.gov.in)) and online Google Earth portal (http://earth.google.com). The ancillary data is used to assist the interpretation of different land use types from remote sensing data. Topographic maps provided ground control points to rectify remotely sensed data and scanned paper maps (topographic maps). Survey of India (SOI) topo sheets (1:50000 and 1:250000 scales) and vegetation map of South India developed by French Institute (1986) of scale 1:250000 was digitized to identify various forest cover types and temporal analyses to find out the changes in vegetation. Pre-calibrated GPS (Global Positioning System - Garmin GPS unit) for field measurements. Ground control points are used to geometrically correct remote sensing data and verify the classified land use information.
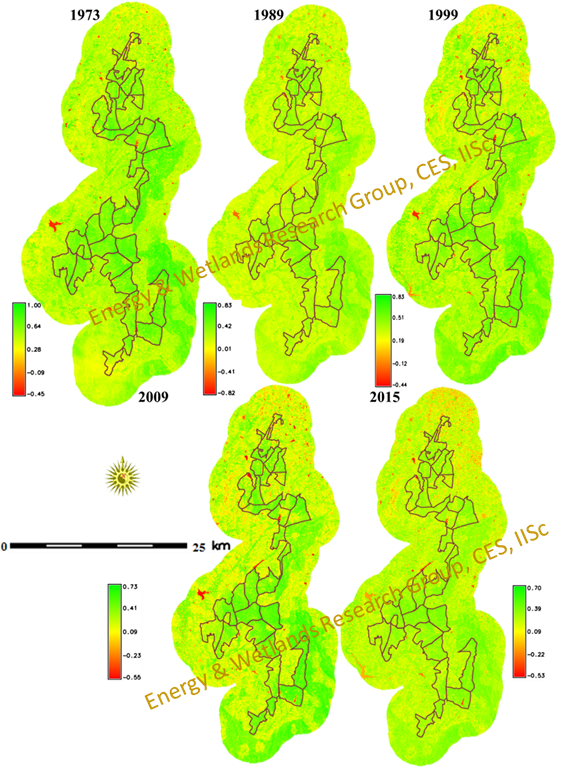
Land cover analysis is done using NDVI (Normalized Difference Vegetation Index), given in equation 1. NDVI is the most commonly used vegetation index to distinguish healthy vegetation from others or from non-vegetated areas using red and near infrared reflectance values of RS data. NDVI provides information about the spatial and temporal distribution of vegetation communities, quality, biomass, and the extent of land degradation in various ecosystems (Reed et al., 1994).NDVI also known as a greenness index, value ranges between -1 to +1. NDVI is sensitive to the presence, density and condition of vegetation and is correlated with absorbed photo synthetically active radiation (PAR) and vegetation primary production.Based on grey scale corresponds to a pixel digital number dense green vegetation and non-vegetation features were separated.
RESULTS AND DISCUSSION
The LULC analysis is carried out by using temporal remote sensing data. Temporal variations in NDVI values derived from satellite data helped to quantify spectrally distinct vegetation, non-vegetation features in land cover. The vegetation indices based analysis reveals the loss of vegetation cover from 85.78 to 66.37 % by 2015in BNP with 5km buffer (Table 1, Figure 2). The study area has witnessed large scale land cover transformation due to anthropogenic developmental activities from 1973 to 2015. The land cover analysis has shown considerable changes in vegetation cover and increase in non-vegetation features covering an area of 39559.26 ha by 2015 as compared with 1973 (16725.85 ha). The fast economic and social transformation in Bangalore metropolitan region has large scale impact on BNP and its environs. In the last few decades, the accelerated process of industrialisation and population growth had resulted greater impact on vegetation cover.
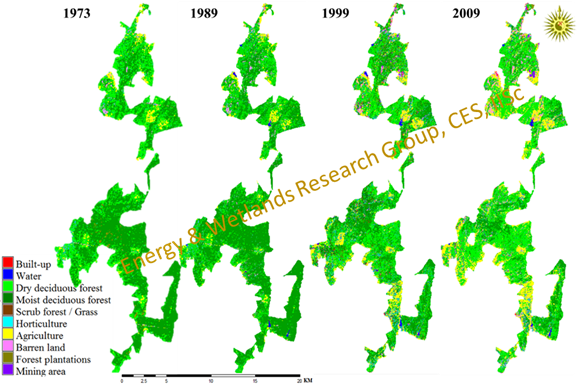
The land use analysis has carried out from 1973 to 2015 for (i) BNP region and (ii) BNP region with 5km buffer. Figures3 and table 2 details land use changes in BNP region during 1973 to 2015.
Year |
1973 |
1989 |
1999 |
2009 |
2015 |
|||||
Category |
Ha |
% |
Ha |
% |
Ha |
% |
Ha |
% |
Ha |
% |
Vegetation |
107087.77 |
87.98 |
104039.5 |
85.5 |
99992.21 |
82.2 |
94693.2 |
77.8 |
89419.0 |
73.46 |
Non-vegetation |
14633.13 |
12.02 |
17681.5 |
14.5 |
21728.69 |
17.8 |
27027.6 |
22.2 |
32301.9 |
26.54 |
Total area |
121720.9 |
|||||||||
Year |
1973 |
1989 |
1999 |
2009 |
2015 |
|||||
Category |
Ha |
% |
Ha |
% |
Ha |
% |
Ha |
% |
Ha |
% |
Dry deciduous forest |
8966.2 |
34.4 |
9156.7 |
35.1 |
10442.5 |
40.1 |
10506.9 |
40.3 |
10600.5 |
40.7 |
Moist deciduous forest |
13130.5 |
50.4 |
12253.4 |
47.0 |
8940.2 |
34.3 |
7879.9 |
30.2 |
7610.6 |
29.2 |
Grass/Scrub forest |
1003.6 |
3.9 |
1113.1 |
4.3 |
1603.9 |
6.2 |
1867.6 |
7.2 |
2001.6 |
7.7 |
Water |
81.0 |
0.3 |
109.5 |
0.4 |
120.7 |
0.5 |
126.0 |
0.5 |
195.4 |
0.7 |
Horticulture |
239.3 |
0.9 |
565.0 |
2.2 |
569.1 |
2.2 |
530.5 |
2.0 |
483.2 |
1.9 |
Agriculture |
1985.4 |
7.6 |
1990.9 |
7.6 |
3021.8 |
11.6 |
3536.8 |
13.6 |
3532.5 |
13.6 |
Urban |
26.4 |
0.1 |
123.7 |
0.5 |
291.5 |
1.1 |
302.2 |
1.2 |
420.0 |
1.6 |
Barren land |
609.7 |
2.3 |
681.3 |
2.6 |
775.7 |
3.0 |
1043.8 |
4.0 |
907.3 |
3.5 |
Forest plantations |
9.3 |
0.0 |
57.6 |
0.2 |
74.8 |
0.3 |
163.1 |
0.6 |
195.5 |
0.8 |
Mining area |
0.5 |
0.0 |
0.5 |
0.0 |
211.6 |
0.8 |
95.0 |
0.4 |
105.4 |
0.4 |
Total area |
26051.87 |
|||||||||
BNP region had 50.4% of moist deciduous forest cover in 1973 and now left with 30.3 % by 2015 due to anthropogenic pressure. Though there is strict vigilance in forests of BNP grazing is the most disturbing factor of vegetation change and regeneration. The moist deciduous vegetation has transformed to dry deciduous forest in pockets such as Anekal, Harohalli, Marlawadi due to anthropogenic pressure. The dry deciduous forest covers 39.4 % of BNP region and scrub vegetation covers 7.7 %. The BNP region has increase in agriculture area from 7.62 to 13.6 % by 2015. The rural settlement, peri urban settlement and industrial areas are major driving forces acting in land use change of BNP. Disrupting forest cover of BNP can be witnessed in many villagesdue to intense deforestation, agriculture and population pressure. The new water bodies have been created in BNP for wild life covers an area of 195.36 ha. The forest cover with minimal changes is observed in Ragihalli, Manjunatha, Yelavantha, Bettahalli regions due to higher protection. The strict protection measures resulted in good regeneration of forests in Bannerghatta Wildlife Division (Ragihalli state forest) Harohalli, Kodihalli ranges, which is noticed during the field work. The land use changes from 1989 to 2009 in southern part of BNP(which is not a part of BNP till 2011) were most prominent due to less protection, intense grazing and agriculture activities. The northern part of the park boundarysets a suburban landscape that is mainly an expansion of Bangalore city area (under BDA) with increasing built-up area, a dense roadnetwork and residential plots.
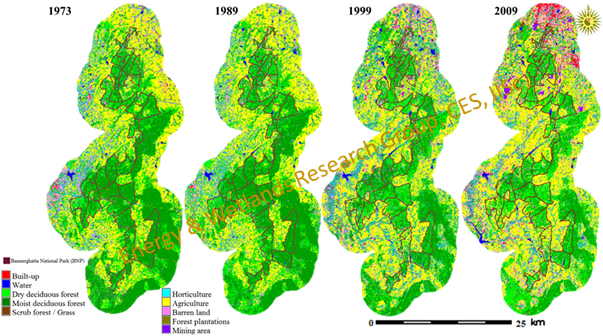
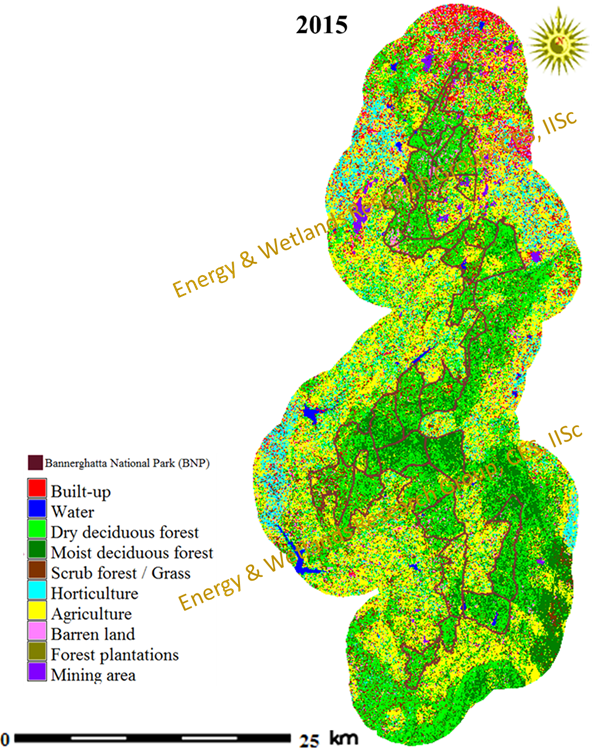
The BNP with 5km buffer region land use analysis reflects the impact of urban expansion and status of forest in the periphery of BNP. The buffer region is very important for maintaining wild life migration, refugee and grazing grounds for livestock. The western and eastern part of the BNP andbuffer region are composed of agricultural village communities. There is a predominance of sugar cane, ragi, eucalyptus in the eastern part; paddy, coconut and mango plantations in the western part. Figure 4 and table 3 reflects change in forest cover of BNP buffer region from 1973-2015. The large tracts of deciduous cover in Kanakapura taluk, Anekal taluk region are lost due to intensification of horticulture area in recent years and consequent land use changes. The region has lost moist deciduous cover from 26.1 to 13.8 % (1973-2015) and increase in horticulture 8.5 to 11 %. Large scale land use changes in the region are due to stone quarries, mining of sand and medium scale industries in the periphery of BNP, which hasalso led to increase in built-up area from 0.4 to 4.5 %. The analyses also highlights the implications of urban sprawl as peri-urban growth with fragmented new urban patches in periphery. Bangalore’s metropolitan growth has intrinsic relation with vegetation loss in peri urban landscape such as BNP buffer region (Bharath et al., 2012). The increase in population of Kanakapura taluk and Maralwadi town region resulted in more transition of forests to other land use. The encroachment in Kanakpura forests, revenue lands, gomala region has resulted in deforestation in buffer region, evident from Figures 5 and 6 by 2015. The changes in the form of suburban residential development, encroachment and illegal logging by communities,grazing animal population and illegal stone quarries, mining triggered a declining trend in forest cover. This change has aggravated human-animal conflict and many wild animals were killed in road accidents. When compared with 1999, therewas further loss in forest area (by 2015) with an increase in built-up area up to 4.5 % due to many residential layouts, educational institutions, industries. This has further impacted agricultural tract in northern portion and few new agriculture lands were created in gomala, revenue lands of Kanakapura taluk and Anekal taluk. The region has 9254.21 ha of scrub forests and which can be reforested for better protection of ecosystem in BNP.About 1538.7 ha land released for mining of resources is another major threat in BNP and its environs.
Year |
1973 |
1989 |
1999 |
2009 |
2015 |
|||||
Category |
Ha |
% |
Ha |
% |
Ha |
% |
Ha |
% |
Ha |
% |
Dry deciduous forest |
32415.6 |
26.6 |
31609.3 |
26.0 |
26433.6 |
21.7 |
24042.3 |
19.8 |
22729.9 |
18.7 |
Moist deciduous forest |
31725.9 |
26.1 |
29694.3 |
24.4 |
25941.5 |
21.3 |
16916.1 |
13.9 |
16822.2 |
13.8 |
Grass/Scrub forest |
4876.8 |
4.0 |
4500.4 |
3.7 |
4914.4 |
4.0 |
8967.2 |
7.4 |
9254.2 |
7.6 |
Water |
377.8 |
0.3 |
922.5 |
0.8 |
1170.8 |
1.0 |
1251.6 |
1.0 |
1834.0 |
1.5 |
Horticulture |
10361.3 |
8.5 |
11768.4 |
9.7 |
12707.1 |
10.4 |
13470.5 |
11.1 |
13363.2 |
11.0 |
Agriculture |
36027.9 |
29.6 |
37222.3 |
30.6 |
40053.5 |
32.9 |
44975.1 |
36.9 |
45613.8 |
37.5 |
Urban |
490.6 |
0.4 |
581.6 |
0.5 |
1934.9 |
1.6 |
3216.0 |
2.6 |
5462.1 |
4.5 |
Barren land |
4461.8 |
3.7 |
4251.7 |
3.5 |
6833.9 |
5.6 |
6114.5 |
5.0 |
3536.6 |
2.9 |
Forest plantations |
921.4 |
0.8 |
1060.5 |
0.9 |
1011.0 |
0.8 |
1533.1 |
1.3 |
1566.3 |
1.3 |
Mining area |
61.8 |
0.1 |
109.9 |
0.1 |
720.3 |
0.6 |
1234.5 |
1.0 |
1538.7 |
1.3 |
Total area |
121720.9 |
|||||||||
9. Eco-Sensitive Regions / Zones of BNP
Ecologically Sensitive Regions /Zones (ESRs’/ Zones) are the ‘ecological units’ that are susceptible to even small changes in the structure / integrity of the landscape (Ramachandra et al., 2013a; 2013b). It is a bio-climatic unit (as demarcated by entire landscapes) wherein human impacts have locally caused irreversible changes in the structure of biological communities (as evident in number/ composition of species and their relative abundances) and their natural habitats’ (Section 3 of the Environment (Protection) Act 1986 (EPA)). This approach of conservation or ecological planning considers spatially both ecological and social dimensions of environmental variables. Ecological sensitive regions with exceptional biotic and abiotic elements are being degraded or lost as a result of unplanned developmental activities. Landscapes sustainability as a basic goal for development requires comprehensive picture of the biophysical and socio-cultural information of a region and this approach provides an opportunities and constraints for decision-making and sustainable management of natural resources. Conservation by prioritisation of sensitive regions has been widely used to improve ecosystem by conservations practices(Ramachandra et al., 2013a; 2013b; 2013c). This study prioritizes the regions in the BNP buffer regions of 5 km, considering attributes (biological, Geo climatic, Social, etc.) as ESR1(Regions of highest sensitivity or Ecologically Sensitive Region 1), ESR2 (Regions of higher sensitivity), ESR3 (Regions of high sensitivity) and ESR4 (Regions of moderate sensitivity).
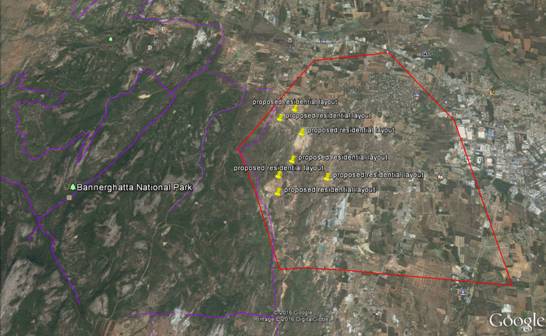
Unplanned rapid urbanisation in Bangalore during the last two decades has transformed the Bangalore landscape into concrete jungle (77% landscape covered with paved surfaces as on 2016), evident from 1005% urban growth with the loss of 88% vegetation cover and 79% water bodies during the last four decades (Ramachandra et al., 2012b; 2012c; 2014; 2015b). This has contributed to dispersed growth / urban sprawl in peri-urban regions of the city, apparent from senseless approvals for formation of housing layouts (in the immediate vicinity of BNP). This mirrors the extent of poor planning and lack of understanding in urban planning apart from complete disregard to human miseries due to frequent human-animal conflicts (Ramachandra et al., 2015a). Mushrooming housing layouts (authorized and unauthorized), information technologycorridors, express ways,peripheral ring road, satellite townships, etc. have made inroads into the green belt of BNP threatening the existence of BNP. The residential and commercial regions such as Jayanagar, Dorasani Palya, J.P. Nagar, Kalena Agrahara, Hulimavu, Gottigere are in close proximity within 10 km radius of park boundary. The BNP boundary has complex shape pattern with narrow width and surrounded by human settlements, agriculture fields restricting animal moment. BNP is one of the oldest habitat for many endemic faunal species such as elephants. BNP forms part of “Mysore Elephant Reserve” constitute an important corridor for adjoining habitats like Cauvery wildlife sanctuary, Tali reserve forest, Kanakapura state forest, etc. The region is repository of exceptional plant and animal diversity. However, due to irresponsible regional planning involving the large scale land use changes in the immediate vicinity, the region is prone to large-scale human-animal conflicts. The wildlife movement is hindered by traffic, people, mining and industries in and around BNP. This necessitates inventorying, mapping and sustainable management of eco-sensitive regions/ zones. Enrichment of the region with native vegetation and creation of water ponds would provide better protection of wildlife and threatened flora.
The conservation of eco-sensitive regions would be an effective, ecological and economical method that is widely used to conserve wild taxa.The effective conservation and management of eco-sensitive regions will result in reduction of crop damage instances, human-animal conflict, illegal poaching, etc. Enrichment of region with native vegetation also act as carbon sink, while improving regional hydrology and environment. The Union Ministry of Environment and Forests and Climate Change (MoEFCC) had set up Pronab Sen Committee in the year 2000 to identify parameters for designating Ecologically Sensitive Areas in the country to counter the rapid deterioration of the environment in India (MoEF, 2000). The committee has defined ecological sensitivity or fragility as permanent and irreparable loss of extant life forms from the world.
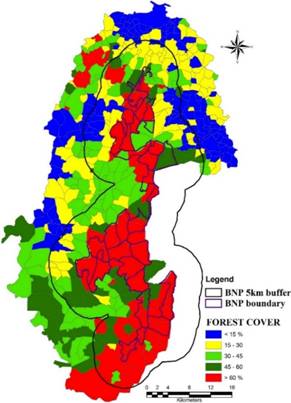
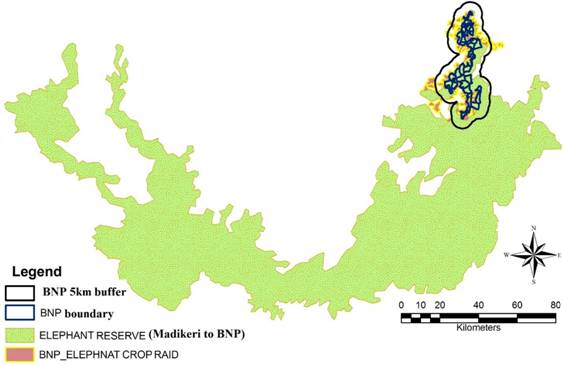
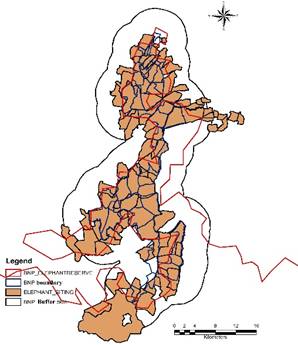
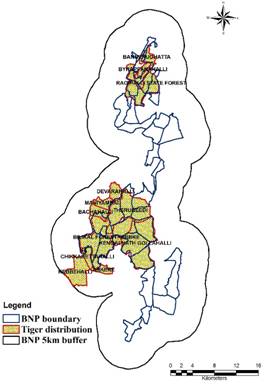
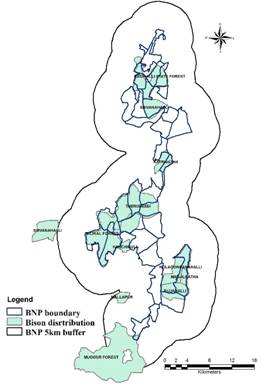
The inventorying and mapping of eco-sensitive zones / regions was carried out by examiningland cover status, wildlife habitats, elephant migratory path, elephant infested areas (crop damage)and native forest cover.Figures5 and 6 depict forest cover in 2015. Elephant infested or villages consistently affected due to elephant raids in and around BNP have been considered for identifying eco-sensitive zones, as elephant constitutes an indicator species of the park. The eco-sensitive regions have marked by zone of influence of elephant infested villages in and around BNP (details of these villages are included in Annexure 1).Forest regeneration initiatives through native vegetation and provision of water ponds would help in minimizing the instances of wild animals straying to the nearby villages. The eco-sensitive regionsalso aids as a national heritage of biological importance for the benefit of education. Eco-sensitive regions are treasuring more significant natural elements that could be degraded or lost as a result of uncontrolled or incompatible development. These regions are identified as being necessary to maintain the essential character and integrity of the existing environment, based on the quality, the scarcity and their role in the ecosystem and culture.The forest cover map has been created to mark the rich biodiversity regions (Figure 7). The BNP region hasvillages with major forest covers greater than 60 % and within buffer there are villages having forest cover > 45% in state forest areas, gomala lands, revenue lands. Human population is another important indicator in zonation, because land degradation results due to population pressure. Figure 8 shows villages near to Bangalore and highways have population density (PD) greater than 600 persons per sq.km. The villages in core area of BNP have PD less than 150 persons per sq.km and periphery of park has PD greater than 300. The faunal distribution in and around BNP maps were generated to categorize effective region for conservation. The faunal details were collected from earlier literature, field analysis, local stakeholders, interviewing forest watchers of all ranges of BNP. The region has rich faunal species such as elephant (Elephas maximus), Indian Sloth Bear (Melursus Ursinus), leopard (Panthera pardus fusca), tiger (Panthera tigris), spotted deer / chital (Axis axis), bison (Bos gaurus) etc. The villages in and around these regions are facing higher crop raid by wild fauna. Figures 9 and10 depict of elephant corridor and illustrates that BNP is located vitally at a terminal point on the northern side of Mysore Elephant Reserve. Figure 11 lists the villages wherein crops affected by elephants in BNP and Figure 12 lists the villages in BNP with 5kms buffer. Figures 13 to 17 shows various faunal species distribution, these maps imply the need for conservation, effective management to reduce human-animal conflict.
The eco-sensitive regions have been mapped based on forest cover, faunal details, elephant migratory path and elephant infested villages (human animal conflict areas). Each criterion is described by an indicator mapped to a value normalised between 10 to 1. The value 10 corresponds to very higher priority for conservation whereas 1 is converse to above. The value 7, 5 and 3 corresponds to high, moderate, low levels of conservation. The villages having forest cover greater than 50% is assigned weight as 10, less than 10% assigned as 1and 7, 5 and 3 corresponds intermediate ranges. The endangered species such as tiger, elephant distributed areas assigned weight as 10 and least concern has assigned as 3, other as 0. The villages with greater population density are assigned 0, intermediate values (3, 5, 7) for moderate and least PD were assigned as 10. The weightage metric score associated with each theme is generated. Interdisciplinary frameworks that incorporating individual as well as nonlinear feedback of various driving forces are critical to research that explicitly incorporates humans in ecosystems (Palmer et al. 2004).Developing a weightage metric score analysis requires combining knowledge from a wide array of disciplines (Termorshuizen & Opdam, 2009; Tooth et al., 2011), planning should acknowledge and actively integrate present and future needs for landscape. The approach has chosen a framework proposed by Beinat, 1997 for weightaging eco-sensitive regions because it provides an objective and transparent system for combining multiple data sets together to infer the significances. The weightage is defined as,

Where n is the number of data sets, Vi is the value associated with criterion i, and Wi is the weight associated to that criterion. The table expresses the theme wise decision variable considered and their significance. Each criterion is described by an indicator mapped to a value normalised between 10 to 1. The value 10 corresponds to very higher priority for conservation whereas 1 is converse to above. Based on the metric score the prioritisation map is prepared as ecologically sensitive regions (ESR) of 1, 2, 3 and 4 by combining all weights associated with different theme. Ecologically sensitive regions (ESRs) as proposed here intended at comprehensively attaining the biodiversity richness, more public participation in conservation and enrichment of their lively hood options.
Figure 18 shows69 villages(Table 5) represent ESR 1, 78villages(Table 6) represent ESR 2, 79villages (Table 7)represent ESR 3 and the rest 176villages(Table 8) represents ESR 4. The ESR 1 represents zone of highest conservation, no further degradation allowed. The ESR-1 reflects all villages within 1km of BNPwhich are to be treated as high sensitive region of conservation. ESR 2 represents a zone of transition for highest conservation and moderate conservation regions. ESR 3 represents moderate conservation region and only regulated development is allowed in these areas. ESR 4 represents least diversity areas and the developments are allowed as per the requirement by strict vigilance from regulatory authorities.
Table 9 lists the number of villages in the respective eco-sensitive zones. All these regions are under various levels of degradation due to anthropogenic pressures and also due to senseless bureaucratic decisions (such as setting up housing layouts, sand and granite mining, etc.). These regions have scope for rejuvenation and sustainable management by involving all local stakeholders. Further developments should be refrained in ESR 2 and actions are to be taken to improve the native vegetation cover. The Community based Conservation (CBC) of ESR 2 & 3 is essential as conservation of biological diversity (or wildlife) depends on the extent of involvement of local communitiesin decision-making, monitoring and regular management. Local communitiesknowledge and experience of wildlife and their habitats, would be invaluable in conservation endeavors. This would also help the BNP administration in delineating the region for further usage by local communities on sustainable basis. The uncontrolled development should be discouraged in and around of pristine lakes, primeval forest patches, perennial water bodies. The village forest committees’ (VFCs) should be formed on priority for promoting conservation initiatives. The members should be involved for afforestation, wild life protection and controlling deforestation activities. Monitoring committee should be formed under the guidance of district forest officer (DFO) with powers conferred by subsection-3 of Environment Protection Act, 1986. The committee should include a representative from forest department, a representative from urban development (BDA), a representative of non-government organization, who are active in the field of conservation, an expert in forest ecology and environment, one of the village forest committee members (VFC), a representative from local stake holders.
 |
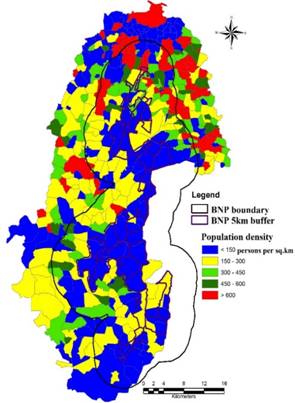 |
Figure 7: Forest cover -BNP and 5 km buffer |
Figure 8: Population density - BNP with buffer |
 |
|
Figure 9: Elephant migratory path across various forest divisions from Madikeri to BNP |
|
 |
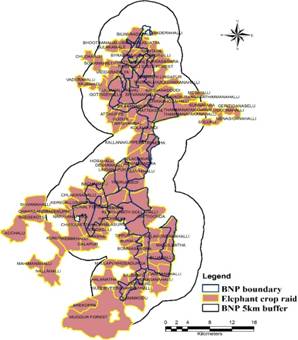 |
Figure 10: BNP and Elephant migratory path |
Figure 11: Crop infested regions due to elephants in BNP |
 |
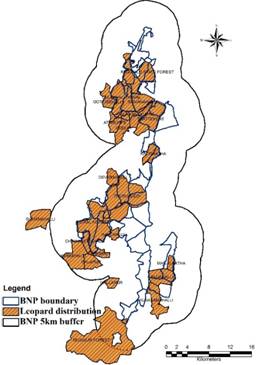 |
Figure 12: Elephant crop infested villages of BNP and buffer region |
Figure 13: Leopard siting distribution in BNP |
 |
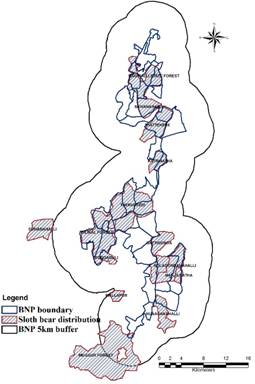 |
Figure 14: Tiger distribution in BNP |
Figure 15: Sloth bear distribution in BNP |
 |
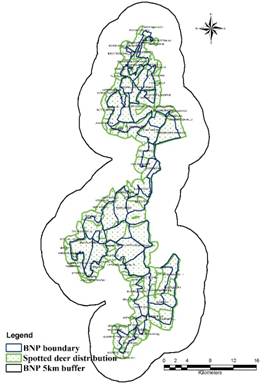 |
Figure 16: Wild bison distribution in BNP |
Figure 17: Spotted deer distribution in BNP. |
 |
|
Figure 18: Ecological sensitive regions of BNP (10 km buffer) |
|
 |
|
Figure 19: proposed layouts within 0.5 km of BNP |
|
SNO |
ACTIVITIES |
ECOLOGICALLY SENSITIVE REGIONS |
|||
ESR-1 |
ESR-2 |
ESR-3 |
ESR-4 |
||
1 |
FORESTS |
||||
|
|||||
|
|||||
|
|||||
|
|||||
|
|||||
|
|||||
|
|||||
|
|||||
|
|||||
3 |
AGRICULTURE&HORTICULTURE |
||||
|
|||||
|
|||||
|
|||||
|
|||||
|
|||||
|
|||||
|
|||||
|
|||||
5 |
INDUSTRIES (Larger scale) |
||||
|
|||||
|
|||||
|
|||||
|
|||||
|
|||||
|
|||||
|
|||||
6 |
INDUSTRIES (Small scale) |
||||
|
|||||
|
|||||
|
|||||
|
|||||
|
|||||
|
|||||
|
|||||
|
|||||
|
|||||
|
|||||
|
|||||
7 |
TOURISM INDUSTRY |
||||
|
|||||
|
|||||
|
|||||
|
|||||
8 |
MINING AND MINERAL EXTRACTION |
||||
|
|||||
|
|||||
|
|||||
9 |
WASTE DISPOSAL |
||||
|
|||||
|
|||||
|
|||||
|
|||||
|
|||||
|
|||||
10 |
TRANSPORTATION |
||||
|
|||||
|
Subject to EIA; Strict regulation and social audit |
||||
|
EIAs, strict regulation ) |
||||
|
|||||
11 |
ENERGY |
||||
|
|||||
|
|||||
|
|||||
|
|||||
|
|||||
|
|||||
|
|||||
Remarks |
|||||
|
|||||
Ecologically sensitive regions |
AREA (Ha) |
AREA (Sq. Km) |
NO OF VILLAGES |
ESR-1 |
63590.38 |
635.90 |
69 |
ESR-2 |
26436.21 |
264.36 |
78 |
ESR-3 |
30343.21 |
303.43 |
79 |
ESR-4 |
56477.6 |
564.78 |
176 |
Total |
176847.4 |
1768.47 |
402 |
SNO |
LOCATION |
TALUK |
HOUSE HOLDS |
POPULATION_2011 |
FOREST % |
ESR_STATUS |
1 |
Ragihalli State Forest |
Anekal |
0 |
0 |
76.17 |
1 |
2 |
Thattekere |
Anekal |
303 |
1479 |
58.49 |
1 |
3 |
Kannaikana Agrahara |
Anekal |
528 |
2030 |
38.75 |
1 |
4 |
Bilwaradahalli |
Anekal |
324 |
1342 |
46.99 |
1 |
5 |
Bannerughatta |
Anekal |
930 |
3958 |
59.10 |
1 |
6 |
Bhoothanahalli |
Anekal |
393 |
1773 |
45.95 |
1 |
7 |
Mantapa |
Anekal |
270 |
1213 |
46.82 |
1 |
8 |
Begihalli |
Anekal |
221 |
911 |
24.99 |
1 |
9 |
Bukkasagara |
Anekal |
271 |
1258 |
19.57 |
1 |
10 |
Mahanth Lingapur |
Anekal |
500 |
2317 |
17.50 |
1 |
11 |
Ragihalli |
Anekal |
357 |
1590 |
34.69 |
1 |
12 |
Bagganadoddi |
Anekal |
95 |
474 |
37.53 |
1 |
13 |
Shivanahalli-Ragihalli |
Anekal |
359 |
1529 |
42.79 |
1 |
14 |
Indlavadiura |
Anekal |
113 |
569 |
39.69 |
1 |
15 |
Thammanayakanahalli |
Anekal |
432 |
2271 |
51.70 |
1 |
16 |
Gottikere |
Bangalore South |
2651 |
11201 |
25.39 |
1 |
17 |
Basavanapura |
Bangalore South |
495 |
1968 |
46.71 |
1 |
18 |
Thattaguppe |
Bangalore South |
453 |
2028 |
13.48 |
1 |
19 |
Vaddarapalya |
Bangalore South |
333 |
1537 |
20.27 |
1 |
20 |
Mallapur |
Kanakapura |
126 |
536 |
52.05 |
1 |
21 |
Muggur Forest |
Kanakapura |
2 |
9 |
92.28 |
1 |
22 |
Chikkamukodlu |
Kanakapura |
134 |
568 |
77.50 |
1 |
23 |
Honniganahalli |
Kanakapura |
116 |
528 |
82.46 |
1 |
24 |
Gullahalli Kaval |
Kanakapura |
163 |
815 |
65.38 |
1 |
25 |
Gottigehalli |
Kanakapura |
213 |
1091 |
28.56 |
1 |
26 |
Bilakanakuppe |
Kanakapura |
138 |
619 |
63.80 |
1 |
27 |
Attikuppe |
Kanakapura |
210 |
1050 |
43.61 |
1 |
28 |
Godur2 |
Kanakapura |
337 |
1535 |
40.09 |
1 |
29 |
Kolalgundi |
Kanakapura |
124 |
575 |
59.13 |
1 |
30 |
Katrinatha |
Kanakapura |
36 |
182 |
60.47 |
1 |
31 |
Kallanakuppe |
Kanakapura |
512 |
2362 |
39.89 |
1 |
32 |
Elachavadi |
Kanakapura |
243 |
1216 |
53.29 |
1 |
33 |
Devarahalli |
Kanakapura |
286 |
1291 |
39.68 |
1 |
34 |
Bhimasandra |
Kanakapura |
29 |
120 |
68.94 |
1 |
35 |
Linganapura |
Kanakapura |
137 |
662 |
62.21 |
1 |
36 |
Therubeedi |
Kanakapura |
335 |
1518 |
78.48 |
1 |
37 |
Bantanalu |
Kanakapura |
4 |
17 |
83.32 |
1 |
38 |
Bachahalli |
Kanakapura |
59 |
228 |
66.16 |
1 |
39 |
Chlakanahalli |
Kanakapura |
425 |
1818 |
35.94 |
1 |
40 |
Bilikal Forest |
Kanakapura |
0 |
0 |
87.18 |
1 |
41 |
Kengalnath Gollahalli |
Kanakapura |
51 |
233 |
89.14 |
1 |
42 |
Kerelallusandra |
Kanakapura |
347 |
1424 |
41.85 |
1 |
43 |
Narayanapura |
Kanakapura |
201 |
819 |
46.50 |
1 |
44 |
Kebbre |
Kanakapura |
147 |
649 |
61.17 |
1 |
45 |
Gattigonda |
Kanakapura |
719 |
3631 |
52.48 |
1 |
46 |
Hanchiguli |
Kanakapura |
189 |
788 |
54.89 |
1 |
47 |
Chikkabettahalli |
Kanakapura |
182 |
770 |
59.27 |
1 |
48 |
Na1 |
Kanakapura |
0 |
0 |
84.22 |
1 |
49 |
Kolagondanahalli |
Kanakapura |
706 |
3502 |
64.52 |
1 |
50 |
Halasuru |
Kanakapura |
127 |
503 |
44.95 |
1 |
51 |
Doddaguli |
Kanakapura |
340 |
1522 |
40.58 |
1 |
52 |
Arkere |
Kanakapura |
202 |
861 |
46.28 |
1 |
53 |
Tippuru |
Kanakapura |
237 |
1066 |
46.58 |
1 |
54 |
Bijhalli |
Kanakapura |
140 |
654 |
53.28 |
1 |
55 |
Manjilnatha |
Kanakapura |
0 |
0 |
97.66 |
1 |
56 |
Bommasandra1 |
Kanakapura |
124 |
474 |
59.45 |
1 |
57 |
Bijjahalli |
Kanakapura |
276 |
1124 |
77.67 |
1 |
58 |
Hosadurga |
Kanakapura |
822 |
3653 |
59.02 |
1 |
59 |
Hunasanahalli |
Kanakapura |
648 |
2888 |
56.44 |
1 |
60 |
Ganganahalli |
Kanakapura |
189 |
799 |
70.85 |
1 |
61 |
Salbanni |
Kanakapura |
130 |
578 |
60.81 |
1 |
62 |
Tattikere |
Kanakapura |
211 |
851 |
56.48 |
1 |
63 |
Guddeveeranahosahalli |
Kanakapura |
166 |
785 |
59.37 |
1 |
64 |
Banimkodu |
Kanakapura |
481 |
2016 |
61.41 |
1 |
65 |
Kallakere |
Kanakapura |
150 |
659 |
42.43 |
1 |
66 |
Gollahalli4 |
Kanakapura |
39 |
195 |
30.86 |
1 |
67 |
Jangalapalya |
Kanakapura |
109 |
420 |
27.95 |
1 |
68 |
Bannerughatta Kaval |
Kanakapura |
0 |
0 |
71.42 |
1 |
69 |
Byrappanahalli |
Kanakapura |
107 |
472 |
78.53 |
1 |
SNO |
LOCATION |
TALUK |
HOUSE HOLDS |
POPULATION_2011 |
FOREST % |
ESR_STATUS |
1 |
Hullavalli |
Anekal |
468 |
2228 |
25 |
2 |
2 |
Sakalavara |
Anekal |
165 |
725 |
43 |
2 |
3 |
Bhujangadasana A. Kere |
Anekal |
92 |
325 |
56 |
2 |
4 |
Ramasandra |
Anekal |
55 |
260 |
43 |
2 |
5 |
Amani Bidarakere |
Anekal |
8 |
25 |
44 |
2 |
6 |
Harapanahalli |
Anekal |
233 |
929 |
10 |
2 |
7 |
Kallubalu |
Anekal |
194 |
815 |
16 |
2 |
8 |
Giddenahalli |
Anekal |
76 |
318 |
11 |
2 |
9 |
Kadujakkanahalli |
Anekal |
132 |
669 |
16 |
2 |
10 |
Indlavadi |
Anekal |
351 |
1730 |
16 |
2 |
11 |
Thimmasandra |
Anekal |
32 |
158 |
7 |
2 |
12 |
Chikkanahalli1 |
Anekal |
56 |
285 |
10 |
2 |
13 |
Chikkahosahalli |
Anekal |
232 |
1187 |
13 |
2 |
14 |
Lakshmipura |
Anekal |
303 |
1456 |
33 |
2 |
15 |
Yalenahalli |
Bangalore South |
99 |
441 |
24 |
2 |
16 |
Kalenagrahara |
Bangalore South |
287 |
1482 |
21 |
2 |
17 |
Kammanahalli |
Bangalore South |
0 |
0 |
25 |
2 |
18 |
Gollahalli3 |
Bangalore South |
623 |
2653 |
24 |
2 |
19 |
Pillaganahalli |
Bangalore South |
679 |
2772 |
0 |
2 |
20 |
Mylasandra |
Bangalore South |
488 |
2129 |
16 |
2 |
21 |
Badamanavarthekaval (P) |
Bangalore South |
0 |
0 |
65 |
2 |
22 |
Gulakamale |
Bangalore South |
394 |
1835 |
35 |
2 |
23 |
Alakabelalur |
Bangalore South |
4 |
17 |
8 |
2 |
24 |
Sunkadakatte |
Bangalore South |
29 |
125 |
19 |
2 |
25 |
Nettigere |
Bangalore South |
268 |
1340 |
10 |
2 |
26 |
Rayagodlu |
Bangalore South |
217 |
983 |
11 |
2 |
27 |
Kembathahalli |
Bangalore South |
245 |
1123 |
31 |
2 |
28 |
Pillaganahalli1 |
Bangalore South |
679 |
2772 |
16 |
2 |
29 |
Hommadevanahalli |
Bangalore South |
290 |
1259 |
31 |
2 |
30 |
Tharalu |
Bangalore South |
303 |
1259 |
26 |
2 |
31 |
Yadamadu |
Kanakapura |
189 |
750 |
9.52 |
2 |
32 |
Kaggalahalli |
Kanakapura |
248 |
1130 |
8 |
2 |
33 |
Gabbadi |
Kanakapura |
352 |
1520 |
34 |
2 |
34 |
Kebbedoddi |
Kanakapura |
0 |
0 |
34 |
2 |
35 |
Godur1 |
Kanakapura |
337 |
1535 |
0 |
2 |
36 |
Dyavsandra |
Kanakapura |
93 |
517 |
35 |
2 |
37 |
Konasandra |
Kanakapura |
170 |
832 |
41 |
2 |
38 |
T.Maniyambal |
Kanakapura |
67 |
296 |
36 |
2 |
39 |
Banavasi |
Kanakapura |
404 |
1844 |
37 |
2 |
40 |
Chikkamralavadi |
Kanakapura |
358 |
1636 |
33 |
2 |
41 |
Marasahalli |
Kanakapura |
149 |
646 |
35 |
2 |
42 |
Hosahalli2 |
Kanakapura |
77 |
369 |
34 |
2 |
43 |
Thokasandra |
Kanakapura |
279 |
1223 |
30 |
2 |
44 |
Ajjegowdanavalse |
Kanakapura |
127 |
577 |
30 |
2 |
45 |
Virupasandra |
Kanakapura |
376 |
1754 |
17 |
2 |
46 |
Aralalu |
Kanakapura |
368 |
1657 |
19 |
2 |
47 |
Bekuppe |
Kanakapura |
466 |
2192 |
26 |
2 |
48 |
Tigalarahosahalli |
Kanakapura |
393 |
1780 |
25 |
2 |
49 |
Nidagallu Aralalusandra |
Kanakapura |
39 |
158 |
22 |
2 |
50 |
Nidagallu |
Kanakapura |
190 |
812 |
43 |
2 |
51 |
Kebbehalli |
Kanakapura |
372 |
1670 |
50 |
2 |
52 |
Yakkuli |
Kanakapura |
100 |
400 |
33 |
2 |
53 |
Galapur |
Kanakapura |
261 |
1222 |
0 |
2 |
54 |
Dodkaballi |
Kanakapura |
463 |
2057 |
27 |
2 |
55 |
Tattiguppe |
Kanakapura |
143 |
614 |
38 |
2 |
56 |
Ajjabasavanahatti |
Kanakapura |
53 |
251 |
33 |
2 |
57 |
Yeramgere |
Kanakapura |
262 |
1183 |
37 |
2 |
58 |
Balepura |
Kanakapura |
29 |
117 |
47 |
2 |
59 |
Kempalanatta |
Kanakapura |
102 |
449 |
59 |
2 |
60 |
Anekadaburu |
Kanakapura |
140 |
615 |
45 |
2 |
61 |
Balagondanahalli |
Kanakapura |
20 |
101 |
40 |
2 |
62 |
Muggur |
Kanakapura |
140 |
621 |
44 |
2 |
63 |
Kotnur |
Kanakapura |
0 |
0 |
16 |
2 |
64 |
Raghavanapalya |
Kanakapura |
44 |
171 |
29 |
2 |
65 |
Hullukasavanahalli |
Kanakapura |
33 |
159 |
33 |
2 |
66 |
Nallasandra |
Kanakapura |
128 |
614 |
31 |
2 |
67 |
Jakkasandra |
Kanakapura |
192 |
940 |
26 |
2 |
68 |
Huyalappanahalli |
Kanakapura |
169 |
839 |
28 |
2 |
69 |
Doddamaralavadi |
Kanakapura |
677 |
3191 |
40 |
2 |
70 |
Maniyambal |
Kanakapura |
373 |
1697 |
49 |
2 |
71 |
Mavathoor |
Kanakapura |
166 |
728 |
36 |
2 |
72 |
Herandyapanahalli |
Kanakapura |
664 |
3136 |
54 |
2 |
73 |
Galapur1 |
Kanakapura |
261 |
1222 |
51 |
2 |
74 |
Halanatha |
Kanakapura |
371 |
1808 |
52 |
2 |
75 |
Na |
Kanakapura |
0 |
0 |
35 |
2 |
76 |
Kudigalani |
Kanakapura |
32 |
136 |
25 |
2 |
77 |
Vaderahalli1 |
Kanakapura |
21 |
75 |
39 |
2 |
78 |
Yerahalli |
Kanakapura |
0 |
0 |
61 |
2 |
SNO |
LOCATION |
TALUK |
HOUSE HOLDS |
POPULATION_2011 |
FOREST % |
ESR_STATUS |
1 |
Hullimangala |
Anekal |
450 |
2092 |
38.72 |
3 |
2 |
Bhingipura |
Anekal |
276 |
1246 |
32.71 |
3 |
3 |
Nanjapur |
Anekal |
88 |
442 |
47.65 |
3 |
4 |
Jigani |
Anekal |
1918 |
7871 |
13.36 |
3 |
5 |
Vaderamanchanahalli |
Anekal |
189 |
717 |
7.68 |
3 |
6 |
Konasandra1 |
Anekal |
122 |
581 |
11.71 |
3 |
7 |
Bhingipura |
Anekal |
10 |
19 |
10.23 |
3 |
8 |
Dyavasandra |
Anekal |
65 |
295 |
9.38 |
3 |
9 |
Bommandahalli |
Anekal |
129 |
662 |
12.04 |
3 |
10 |
Nosenooru |
Anekal |
226 |
1037 |
10.65 |
3 |
11 |
Kadujakkanahalli1 |
Anekal |
132 |
669 |
0.00 |
3 |
12 |
Nosenoorugollahalli |
Anekal |
82 |
400 |
20.00 |
3 |
13 |
Suragajakkanahalli |
Anekal |
187 |
912 |
10.33 |
3 |
14 |
Aduru |
Anekal |
115 |
636 |
11.13 |
3 |
15 |
Sonnayakanapura |
Anekal |
219 |
1046 |
15.91 |
3 |
16 |
Gowranahalli |
Anekal |
297 |
1635 |
11.55 |
3 |
17 |
Anekal |
Anekal |
7212 |
33506 |
9.93 |
3 |
18 |
Medihalli |
Anekal |
108 |
498 |
10.03 |
3 |
19 |
Agasathimmanahalli |
Anekal |
7 |
17 |
18.05 |
3 |
20 |
Sunnavara |
Anekal |
183 |
846 |
21.51 |
3 |
21 |
Pattangere Gollahalli |
Anekal |
43 |
201 |
47.32 |
3 |
22 |
Kalanaikanahalli |
Anekal |
47 |
239 |
38.10 |
3 |
23 |
Bidarakadahalli |
Anekal |
0 |
0 |
54.28 |
3 |
24 |
Koodlu |
Bangalore South |
1292 |
5201 |
14.41 |
3 |
25 |
Devar Chikkanahalli |
Bangalore South |
0 |
0 |
10.47 |
3 |
26 |
Dodda Kalsandra |
Bangalore South |
672 |
2700 |
15.81 |
3 |
27 |
Arkeri |
Bangalore South |
0 |
0 |
11.04 |
3 |
28 |
Uttarahalli Manavartha Kaval |
Bangalore South |
87 |
355 |
52.78 |
3 |
29 |
Chandrashekarapura |
Bangalore South |
40 |
178 |
15.04 |
3 |
30 |
Anjanapura |
Bangalore South |
529 |
2217 |
42.25 |
3 |
31 |
Vitasandra |
Bangalore South |
209 |
960 |
27.76 |
3 |
32 |
Bettadasanapura |
Bangalore South |
292 |
1391 |
12.64 |
3 |
33 |
Somanahalli |
Bangalore South |
747 |
3455 |
10.54 |
3 |
34 |
Nelaguli |
Bangalore South |
187 |
956 |
12.72 |
3 |
35 |
Shivanahalli |
Kanakapura |
629 |
2970 |
35.67 |
3 |
36 |
Vaderahalli |
Kanakapura |
236 |
1103 |
11.29 |
3 |
37 |
Gabbadi Kaval |
Kanakapura |
7 |
25 |
41.57 |
3 |
38 |
Hosakote |
Kanakapura |
126 |
651 |
34.39 |
3 |
39 |
Godur |
Kanakapura |
337 |
1535 |
0.00 |
3 |
40 |
Marasandra |
Kanakapura |
151 |
671 |
21.04 |
3 |
41 |
Chulakanakere Kaval |
Kanakapura |
31 |
145 |
53.58 |
3 |
42 |
Bheemasandra |
Kanakapura |
59 |
257 |
30.99 |
3 |
43 |
Gadaranahalli |
Kanakapura |
69 |
327 |
43.66 |
3 |
44 |
Rampura |
Kanakapura |
0 |
0 |
44.59 |
3 |
45 |
Anehosahalli |
Kanakapura |
153 |
708 |
33.98 |
3 |
46 |
Malligemetlu |
Kanakapura |
339 |
1532 |
31.06 |
3 |
47 |
Paduvanagere |
Kanakapura |
362 |
1557 |
43.96 |
3 |
48 |
Ballagere |
Kanakapura |
262 |
1105 |
35.77 |
3 |
49 |
Guthalahunase |
Kanakapura |
172 |
730 |
30.51 |
3 |
50 |
Anamanhalli |
Kanakapura |
227 |
1059 |
11.04 |
3 |
51 |
Aranakuppe |
Kanakapura |
190 |
852 |
10.40 |
3 |
52 |
Bardanahalli |
Kanakapura |
269 |
1058 |
21.43 |
3 |
53 |
Chakasandra |
Kanakapura |
228 |
1119 |
19.66 |
3 |
54 |
Kunur |
Kanakapura |
393 |
1931 |
43.82 |
3 |
55 |
Kodihalli |
Kanakapura |
1243 |
5895 |
31.79 |
3 |
56 |
Hosahalli |
Kanakapura |
220 |
1125 |
34.29 |
3 |
57 |
Nallahalli |
Kanakapura |
947 |
4493 |
46.01 |
3 |
58 |
Mahimanahalli |
Kanakapura |
321 |
1502 |
40.10 |
3 |
59 |
Channasandra |
Kanakapura |
160 |
817 |
55.96 |
3 |
60 |
Hukkunda |
Kanakapura |
530 |
2759 |
30.95 |
3 |
61 |
Chikkakoppa |
Kanakapura |
112 |
511 |
49.07 |
3 |
62 |
Mullahalli |
Kanakapura |
477 |
2134 |
45.86 |
3 |
63 |
Madarahalli |
Kanakapura |
123 |
607 |
39.70 |
3 |
64 |
Doddakoppa |
Kanakapura |
234 |
1228 |
40.85 |
3 |
65 |
Gollahalli2 |
Kanakapura |
239 |
1081 |
41.92 |
3 |
66 |
Purasagondanahalli |
Kanakapura |
72 |
325 |
38.03 |
3 |
67 |
Kottekoppa |
Kanakapura |
417 |
1832 |
48.84 |
3 |
68 |
Arekoppa |
Kanakapura |
411 |
1970 |
45.75 |
3 |
69 |
Bennagodu |
Kanakapura |
92 |
416 |
52.26 |
3 |
70 |
Begur |
Kanakapura |
2069 |
9237 |
18.70 |
3 |
71 |
Nyanappanahalli |
Kanakapura |
0 |
0 |
9.86 |
3 |
72 |
Hulimavu |
Kanakapura |
0 |
0 |
16.76 |
3 |
73 |
Vajarahalli |
Kanakapura |
516 |
2200 |
26.88 |
3 |
74 |
Alahalli |
Kanakapura |
1364 |
7137 |
23.28 |
3 |
75 |
Thippasandra |
Kanakapura |
111 |
487 |
25.13 |
3 |
76 |
Mallasandra |
Kanakapura |
8 |
38 |
44.73 |
3 |
77 |
Kaggalipura |
Kanakapura |
1532 |
6907 |
17.84 |
3 |
78 |
Obichudahalli |
Kanakapura |
196 |
906 |
26.36 |
3 |
79 |
Soluru |
Kanakapura |
92 |
493 |
37.41 |
3 |
SNO |
LOCATION |
TALUK |
HOUSE HOLDS |
POPULATION_2011 |
FOREST % |
ESR_STATUS |
1 |
Bangalore |
Bangalore South |
0 |
4301326 |
13.4 |
4 |
2 |
Hoskerehalli |
Bangalore South |
0 |
0 |
14.21 |
4 |
3 |
Halge Vaderahalli |
Bangalore South |
0 |
0 |
19.46 |
4 |
4 |
Kathreguppe |
Bangalore South |
0 |
0 |
5.43 |
4 |
5 |
Ittamadu |
Bangalore South |
0 |
0 |
4.13 |
4 |
6 |
Venkatapura |
Bangalore South |
0 |
0 |
14.5 |
4 |
7 |
Agara |
Bangalore South |
0 |
0 |
41.33 |
4 |
8 |
Jaksandra |
Bangalore South |
0 |
0 |
12.79 |
4 |
9 |
Karisandra |
Bangalore South |
0 |
0 |
8.97 |
4 |
10 |
Rupena Agrahara |
Bangalore South |
0 |
0 |
9.99 |
4 |
11 |
Kadarenahalli |
Bangalore South |
0 |
0 |
7.76 |
4 |
12 |
Chikka Kalsandra |
Bangalore South |
0 |
0 |
5.04 |
4 |
13 |
Arehalli |
Bangalore South |
698 |
2858 |
11.44 |
4 |
14 |
Haralakunte |
Bangalore South |
0 |
0 |
21.22 |
4 |
15 |
Sarakki |
Bangalore South |
0 |
0 |
12.35 |
4 |
16 |
Jarganahalli |
Bangalore South |
0 |
0 |
12.78 |
4 |
17 |
Bommanahalli |
Bangalore South |
0 |
0 |
4.22 |
4 |
18 |
Madivala |
Bangalore South |
0 |
0 |
8.68 |
4 |
19 |
Vaddara Palya1 |
Bangalore South |
175 |
718 |
20.47 |
4 |
20 |
Marenahalli |
Bangalore South |
0 |
0 |
9.37 |
4 |
21 |
Gopanayakanahalli |
Bangalore South |
0 |
0 |
7.95 |
4 |
22 |
Uttarahalli |
Bangalore South |
0 |
0 |
13.9 |
4 |
23 |
Yellukunte |
Bangalore South |
0 |
0 |
8.23 |
4 |
24 |
Haralur |
Bangalore South |
296 |
1186 |
25.99 |
4 |
25 |
Nainappasettipalya |
Bangalore South |
0 |
0 |
6.35 |
4 |
26 |
Sarakki Agrahara |
Bangalore South |
0 |
0 |
10.12 |
4 |
27 |
Bilekhalli |
Bangalore South |
0 |
0 |
17.16 |
4 |
28 |
Channasandra |
Bangalore South |
0 |
0 |
24.27 |
4 |
29 |
Ganakallu |
Bangalore South |
556 |
2490 |
27.82 |
4 |
30 |
Kodichikkanahalli |
Bangalore South |
0 |
0 |
9.73 |
4 |
31 |
Bikaspur |
Bangalore South |
0 |
0 |
13.7 |
4 |
32 |
Yalachenahalli |
Bangalore South |
0 |
0 |
4.28 |
4 |
33 |
Sarakki Kere |
Bangalore South |
0 |
0 |
5.21 |
4 |
34 |
Subramanyapur |
Bangalore South |
1190 |
4817 |
14.57 |
4 |
35 |
Hongasandra |
Bangalore South |
0 |
0 |
6.66 |
4 |
36 |
Thurahalli |
Bangalore South |
187 |
838 |
37.4 |
4 |
37 |
Vasantpur |
Bangalore South |
565 |
2516 |
11.04 |
4 |
38 |
Puttenahalli |
Bangalore South |
0 |
0 |
20.47 |
4 |
39 |
Badamanavarthekaval1 (P) |
Bangalore South |
0 |
0 |
75.43 |
4 |
40 |
Konankunte |
Bangalore South |
3291 |
13316 |
8.43 |
4 |
41 |
Gabbalalu |
Bangalore South |
523 |
2147 |
22.86 |
4 |
42 |
Koodlu1 |
Bangalore South |
1292 |
5201 |
13.4 |
4 |
43 |
Hemmigepura |
Bangalore South |
312 |
1658 |
39.42 |
4 |
44 |
Hemmigepura |
Bangalore South |
0 |
0 |
26.25 |
4 |
45 |
Choodasandra |
Bangalore South |
145 |
672 |
28.51 |
4 |
46 |
Badamanavarthe Kaval |
Bangalore South |
430 |
2060 |
55.31 |
4 |
47 |
Basapur |
Bangalore South |
133 |
604 |
22.94 |
4 |
48 |
Rajanamaduvu |
Bangalore South |
80 |
415 |
32.65 |
4 |
49 |
Devagere |
Bangalore South |
210 |
1179 |
34.07 |
4 |
50 |
Chikkathogaru |
Bangalore South |
127 |
575 |
27.42 |
4 |
51 |
Doddathogaru |
Bangalore South |
995 |
4087 |
18.54 |
4 |
52 |
Agara2 |
Bangalore South |
781 |
3612 |
42.09 |
4 |
53 |
Gangasandra |
Bangalore South |
111 |
619 |
43.57 |
4 |
54 |
Vasanthanahalli |
Bangalore South |
284 |
1079 |
46.76 |
4 |
55 |
Chinnakurchi |
Bangalore South |
154 |
796 |
55.97 |
4 |
56 |
Saludoddi |
Bangalore South |
0 |
0 |
42.54 |
4 |
57 |
Uttari |
Bangalore South |
214 |
1038 |
31.11 |
4 |
58 |
Chudahalli |
Bangalore South |
184 |
998 |
12.63 |
4 |
59 |
Naganayakanahalli |
Bangalore South |
101 |
576 |
24.15 |
4 |
60 |
Hulugondanahalli |
Kanakapura |
365 |
1847 |
7.14 |
4 |
61 |
Harohalli |
Kanakapura |
2316 |
11338 |
26.38 |
4 |
62 |
Bannikuppe |
Kanakapura |
350 |
1651 |
7.67 |
4 |
63 |
Maralagere |
Kanakapura |
55 |
218 |
36.18 |
4 |
64 |
Devarakaggalahalli |
Kanakapura |
105 |
515 |
7.04 |
4 |
65 |
Jakkasandra1 |
Kanakapura |
310 |
1938 |
23.88 |
4 |
66 |
Keeranagere |
Kanakapura |
126 |
629 |
34.35 |
4 |
67 |
Doddasadenhalli |
Kanakapura |
293 |
1488 |
32.14 |
4 |
68 |
Cheelur |
Kanakapura |
581 |
2739 |
19.5 |
4 |
69 |
Avaremala |
Kanakapura |
461 |
2247 |
42.93 |
4 |
70 |
Chikkasadenahalli |
Kanakapura |
136 |
632 |
29.84 |
4 |
71 |
Chikkadevarahalli |
Kanakapura |
59 |
299 |
36.17 |
4 |
72 |
T. Hosahalli |
Kanakapura |
293 |
1338 |
27.63 |
4 |
73 |
Mrasandra |
Kanakapura |
0 |
0 |
31.74 |
4 |
74 |
Agara1 |
Kanakapura |
211 |
944 |
28.73 |
4 |
75 |
Ramapura |
Kanakapura |
232 |
1166 |
8.97 |
4 |
76 |
Rayasandra |
Kanakapura |
366 |
1645 |
28.96 |
4 |
77 |
Tungani |
Kanakapura |
393 |
1798 |
7.57 |
4 |
78 |
Ganalu |
Kanakapura |
423 |
1936 |
7.42 |
4 |
79 |
Aralalusandra |
Kanakapura |
290 |
1331 |
13.84 |
4 |
80 |
Banantimari State Forest |
Kanakapura |
0 |
0 |
53.55 |
4 |
81 |
Agrahara |
Kanakapura |
95 |
411 |
3.97 |
4 |
82 |
Kallahalli |
Kanakapura |
354 |
1627 |
8.36 |
4 |
83 |
Thammasandra |
Kanakapura |
454 |
2061 |
25.87 |
4 |
84 |
Kanakapura |
Kanakapura |
0 |
0 |
13.42 |
4 |
85 |
Hanumanahalli |
Kanakapura |
47 |
238 |
32.75 |
4 |
86 |
Virupasandra1 |
Kanakapura |
376 |
1754 |
0 |
4 |
87 |
Seegekote |
Kanakapura |
290 |
1349 |
33.66 |
4 |
88 |
Acchalu |
Kanakapura |
496 |
2411 |
42.43 |
4 |
89 |
Horalagallu |
Kanakapura |
547 |
2557 |
45.17 |
4 |
90 |
Maralabekuppe |
Kanakapura |
964 |
4987 |
45.98 |
4 |
91 |
Sompura |
Kanakapura |
82 |
454 |
32.59 |
4 |
92 |
Singasandra1 |
Kanakapura |
0 |
0 |
13.03 |
4 |
93 |
Raghuvanahalli |
Kanakapura |
126 |
627 |
28.72 |
4 |
94 |
Purappana Agrahara |
Kanakapura |
385 |
1584 |
16.46 |
4 |
95 |
Varahasandra |
Kanakapura |
89 |
479 |
31.09 |
4 |
96 |
Hosahalli1 |
Kanakapura |
285 |
1242 |
14.98 |
4 |
97 |
Rayasandra1 |
Kanakapura |
179 |
1019 |
36.67 |
4 |
98 |
Naganathapura |
Kanakapura |
279 |
1081 |
17.43 |
4 |
99 |
Lingadeeranahalli |
Kanakapura |
131 |
626 |
25.7 |
4 |
100 |
Gollahalli |
Kanakapura |
0 |
0 |
30.75 |
4 |
101 |
Thalaghattapura |
Kanakapura |
833 |
3607 |
20.8 |
4 |
102 |
Sreeramapura |
Kanakapura |
146 |
755 |
54.31 |
4 |
103 |
Doddanagamangala |
Kanakapura |
286 |
1360 |
16.83 |
4 |
104 |
Beratena Agrahara |
Kanakapura |
84 |
340 |
18.04 |
4 |
105 |
Dodda Tegur (P) |
Kanakapura |
0 |
0 |
4.15 |
4 |
106 |
Chikkanagamangala |
Kanakapura |
128 |
653 |
24.22 |
4 |
107 |
Konappana Agrahara |
Kanakapura |
2918 |
11038 |
14.81 |
4 |
108 |
Veerasandra |
Kanakapura |
620 |
2235 |
29.02 |
4 |
109 |
Hebbagodi |
Kanakapura |
114 |
557 |
18.32 |
4 |
110 |
Kammasandra |
Kanakapura |
620 |
2549 |
21.26 |
4 |
111 |
Maragondahalli |
Kanakapura |
799 |
4046 |
19.46 |
4 |
112 |
Gollahalli1 |
Kanakapura |
427 |
1638 |
20.6 |
4 |
113 |
Andapura |
Kanakapura |
34 |
155 |
31.69 |
4 |
114 |
Bommasandra |
Kanakapura |
551 |
2194 |
22.89 |
4 |
115 |
Thirupalya |
Kanakapura |
802 |
2817 |
14.29 |
4 |
116 |
Seegehalli |
Kanakapura |
32 |
174 |
29.93 |
4 |
117 |
Yarandahalli |
Kanakapura |
588 |
2025 |
18.36 |
4 |
118 |
Vabasandra |
Kanakapura |
115 |
565 |
27.94 |
4 |
119 |
Kachanaikanahalli |
Kanakapura |
585 |
2231 |
24.41 |
4 |
120 |
Kithiganahalli |
Kanakapura |
578 |
2220 |
25.32 |
4 |
121 |
Kylasanahalli |
Kanakapura |
249 |
1151 |
14.43 |
4 |
122 |
Banahalli |
Kanakapura |
519 |
2071 |
11.81 |
4 |
123 |
Hosahalli3 |
Kanakapura |
130 |
638 |
27.46 |
4 |
124 |
Bandenallasandra |
Kanakapura |
129 |
645 |
9.26 |
4 |
125 |
Hennagara |
Kanakapura |
373 |
1761 |
9.93 |
4 |
126 |
Rajapura |
Kanakapura |
143 |
730 |
8.14 |
4 |
127 |
Iggaluru |
Kanakapura |
327 |
1524 |
23.6 |
4 |
128 |
Hinnakki |
Kanakapura |
221 |
1078 |
9.46 |
4 |
129 |
Ramakrishnapura |
Kanakapura |
33 |
170 |
34.02 |
4 |
130 |
Marasuru |
Kanakapura |
395 |
1709 |
25.46 |
4 |
131 |
Haragadde |
Kanakapura |
842 |
3493 |
10.42 |
4 |
132 |
Seethanaikanahalli |
Kanakapura |
85 |
520 |
19.4 |
4 |
133 |
Lingapura |
Kanakapura |
130 |
746 |
8.22 |
4 |
134 |
Byagadadenahalli |
Kanakapura |
108 |
511 |
20.83 |
4 |
135 |
Doddaheggadde |
Kanakapura |
165 |
770 |
10.4 |
4 |
136 |
Koonmadivala |
Kanakapura |
64 |
326 |
12.38 |
4 |
137 |
Avadadenahalli |
Kanakapura |
90 |
513 |
16.26 |
4 |
138 |
Soppahalli |
Kanakapura |
91 |
450 |
9.89 |
4 |
139 |
Kumbaranahalli |
Kanakapura |
126 |
602 |
15.97 |
4 |
140 |
Channena Agrahara |
Kanakapura |
175 |
925 |
11.41 |
4 |
141 |
Kempavaderahalli |
Kanakapura |
47 |
201 |
12.87 |
4 |
142 |
Aravattigepura |
Kanakapura |
60 |
281 |
10.54 |
4 |
143 |
Chikkaheggadde |
Kanakapura |
117 |
650 |
8.94 |
4 |
144 |
Karapura |
Kanakapura |
252 |
1172 |
7.59 |
4 |
145 |
Hasarubani |
Kanakapura |
5 |
35 |
14.14 |
4 |
146 |
Honnakalasapura |
Kanakapura |
78 |
364 |
11.37 |
4 |
147 |
Kavala Hosahalli |
Kanakapura |
293 |
1238 |
13.35 |
4 |
148 |
Haladenahalli |
Kanakapura |
233 |
1031 |
11.63 |
4 |
149 |
Bidaragere |
Kanakapura |
174 |
900 |
2.92 |
4 |
150 |
Kurubarahalli |
Kanakapura |
1 |
4 |
7.07 |
4 |
151 |
Muthugatti |
Kanakapura |
427 |
1970 |
2.75 |
4 |
152 |
Sabmangala |
Kanakapura |
128 |
676 |
2.81 |
4 |
153 |
Choodenahalli |
Kanakapura |
116 |
558 |
13.75 |
4 |
154 |
Hompalaghatta |
Kanakapura |
99 |
536 |
7.37 |
4 |
155 |
Thelagarahalli |
Kanakapura |
119 |
626 |
10.81 |
4 |
156 |
Gudnahalli |
Kanakapura |
137 |
657 |
2.13 |
4 |
157 |
Geritiganabelu |
Kanakapura |
203 |
1049 |
2.69 |
4 |
158 |
Singasandra |
Kanakapura |
72 |
392 |
13.06 |
4 |
159 |
Menasiganahalli |
Kanakapura |
157 |
810 |
18.6 |
4 |
160 |
Vanakanahalli |
Kanakapura |
284 |
1283 |
20.62 |
4 |
161 |
Chikkanahatti |
Kanakapura |
3 |
11 |
3.45 |
4 |
162 |
Doddakuntanahalli |
Ramnagara |
56 |
283 |
53.67 |
4 |
163 |
Kodiyalkarenahalli |
Ramnagara |
523 |
2602 |
35.26 |
4 |
164 |
Chik Kuntanahalli |
Ramnagara |
112 |
566 |
41.21 |
4 |
165 |
Yerepalya |
Ramnagara |
6 |
37 |
15.77 |
4 |
166 |
Mandalahalli |
Ramnagara |
4 |
22 |
64.05 |
4 |
167 |
Bannigere |
Ramnagara |
349 |
1663 |
13.73 |
4 |
168 |
Hosur |
Ramnagara |
468 |
2107 |
13.82 |
4 |
169 |
Gollarapalya |
Ramnagara |
98 |
455 |
21.88 |
4 |
170 |
Byramangala |
Ramnagara |
624 |
2828 |
8.64 |
4 |
171 |
Allalasandra |
Ramnagara |
309 |
1509 |
9.39 |
4 |
172 |
Kanchugaranahalli |
Ramnagara |
240 |
1038 |
7.6 |
4 |
173 |
Kanchugaranahalli Kaval |
Ramnagara |
0 |
0 |
18.23 |
4 |
174 |
Kempalahnapalya |
Ramnagara |
487 |
2114 |
12.39 |
4 |
175 |
Muddenahalli |
Ramnagara |
231 |
1183 |
30.58 |
4 |
176 |
Medamaranahalli |
Ramnagara |
274 |
1283 |
19.21 |
4 |
Sno |
Village Name |
Taluk |
1 |
Bagganadoddi |
Anekal |
2 |
Bannerughatta |
Anekal |
3 |
Begihalli |
Anekal |
4 |
Bhoothanahalli |
Anekal |
5 |
Bilwaradahalli |
Anekal |
6 |
Bukkasagara |
Anekal |
7 |
Chikkahosahalli |
Anekal |
8 |
Indlavadiura |
Anekal |
9 |
Kadujakkanahalli |
Anekal |
10 |
Kadujakkanahalli1 |
Anekal |
11 |
Mahanth Lingapur |
Anekal |
12 |
Mantapa |
Anekal |
13 |
Medihalli |
Anekal |
14 |
Ragihalli |
Anekal |
15 |
Ragihalli State Forest |
Anekal |
16 |
Shivanahalli-Ragihalli |
Anekal |
17 |
Thammanayakanahalli |
Anekal |
18 |
Thattekere |
Anekal |
19 |
Chudahalli |
Bangalore South |
20 |
Gulakamale |
Bangalore South |
21 |
Thattaguppe |
Bangalore South |
22 |
Vaddarapalya |
Bangalore South |
23 |
Acchalu |
Kanakapura |
24 |
Arekoppa |
Kanakapura |
25 |
Arkere |
Kanakapura |
26 |
Attikuppe |
Kanakapura |
27 |
Bachahalli |
Kanakapura |
28 |
Banimkodu |
Kanakapura |
29 |
Bannerughatta Kaval |
Kanakapura |
30 |
Bantanalu |
Kanakapura |
31 |
Bekuppe |
Kanakapura |
32 |
Bhimasandra |
Kanakapura |
33 |
Bijhalli |
Kanakapura |
34 |
Bijjahalli |
Kanakapura |
35 |
Bilakanakuppe |
Kanakapura |
36 |
Bilikal Forest |
Kanakapura |
37 |
Bommasandra1 |
Kanakapura |
38 |
Byrappanahalli |
Kanakapura |
39 |
Chakasandra |
Kanakapura |
40 |
Chikkabettahalli |
Kanakapura |
41 |
Chlakanahalli |
Kanakapura |
42 |
Devarahalli |
Kanakapura |
43 |
Doddaguli |
Kanakapura |
44 |
Elachavadi |
Kanakapura |
45 |
Galapur |
Kanakapura |
46 |
Galapur1 |
Kanakapura |
47 |
Ganganahalli |
Kanakapura |
48 |
Gattigonda |
Kanakapura |
49 |
Geritiganabelu |
Kanakapura |
50 |
Godur |
Kanakapura |
51 |
Godur1 |
Kanakapura |
52 |
Godur2 |
Kanakapura |
53 |
Gollahalli4 |
Kanakapura |
54 |
Gottigehalli |
Kanakapura |
55 |
Guddeveeranahosahalli |
Kanakapura |
56 |
Gullahalli Kaval |
Kanakapura |
57 |
Halanatha |
Kanakapura |
58 |
Halasuru |
Kanakapura |
59 |
Hanchiguli |
Kanakapura |
60 |
Hosadurga |
Kanakapura |
61 |
Hosahalli2 |
Kanakapura |
62 |
Hunasanahalli |
Kanakapura |
63 |
Kallanakuppe |
Kanakapura |
64 |
Katrinatha |
Kanakapura |
65 |
Kebbehalli |
Kanakapura |
66 |
Kebbre |
Kanakapura |
67 |
Kengalnath Gollahalli |
Kanakapura |
68 |
Kerelallusandra |
Kanakapura |
69 |
Kolagondanahalli |
Kanakapura |
70 |
Kolalgundi |
Kanakapura |
71 |
Kunur |
Kanakapura |
72 |
Linganapura |
Kanakapura |
73 |
Mahimanahalli |
Kanakapura |
74 |
Mallapur |
Kanakapura |
75 |
Mallasandra |
Kanakapura |
76 |
Manjilnatha |
Kanakapura |
77 |
Menasiganahalli |
Kanakapura |
78 |
Muggur Forest |
Kanakapura |
79 |
Nallahalli |
Kanakapura |
80 |
Narayanapura |
Kanakapura |
81 |
Salbanni |
Kanakapura |
82 |
Seegekote |
Kanakapura |
83 |
Shivanahalli |
Kanakapura |
84 |
Singasandra |
Kanakapura |
85 |
Soluru |
Kanakapura |
86 |
T.Maniyambal |
Kanakapura |
87 |
Tattikere |
Kanakapura |
88 |
Thelagarahalli |
Kanakapura |
89 |
Therubeedi |
Kanakapura |
90 |
Tippuru |
Kanakapura |
91 |
Vaderahalli |
Kanakapura |
92 |
Vaderahalli1 |
Kanakapura |
93 |
Yadamadu |
Kanakapura |
9.1. SAFE PASSAGE FOR ELEPHANTS
India has approximately more than 50% of wild elephants of the world and acting as a last remaining stronghold of the Asian elephants. India has 26,000 elephants in the wild and 3500 elephants in captive distributed across 18 states /union territories. South India supports around 10,000 elephants in the wild and it is estimated that their geographic range has shrunk by 70% since 1960s (GAJAH, 2011). Bannerghatta National Park (BNP) is the confluence point of the Western and Eastern Ghats for Asiatic elephants. BNP connects to the forest tracks of the Cauvery Wildlife Sanctuary eventually joining the Nilgiri Biosphere Reserve of Western Ghats forest at Nilgiris, stretching through Malaimahadeshwara hills, Biligiri Ranga Temple Sanctuary, Kollegal Forest Division and Sathyamangala Forests. The elephants are distributed in the entire park area. Within the habitat, the elephants seem to have preferences to some locations such as Ragihalli, Harohalli range, which are characterized by thick vegetation cover, shade and proximity to water sources with least human pressure. BNP is one of the oldest habitats of Asian elephants, supporting 100-150 population and large number of 200-300 migratory population also noticed from adjoining Tali reserve forest and Kaveri wild life sanctuary. Asper census population the stable population of BNP elephants are 148 (Bhaskaran et al. 2007) and as per forest department records the number exceeds 200. This number gets doubled with the migratory elephants moving in during the cropping season.
The disturbance in the park appears to be prominent and more crucial. The forest department records reveal that encroachment of forest land in the park is one of the major disturbances to the elephant’s in the park with as many as 300 cases being registered as on 2008. Some local residents are involved in the illegal mining of sand along the watercourses inside the park. Sandalwood poaching (about 35 cases were registered as on April 2008 in the forest department offence register) and incidences of illicit fuel wood collection and timber smuggling are common in the park (Singh 2008), resulting in the formation of more open patches and degradation of the forest whilst reducing the effective area available for elephants use (Gopalakarishna et al., 2008). Despite best efforts of the forest department, state and central governments the elephant conservation still remains a difficult task. There are numerous challenges such as habitat loss, fragmentation, human-elephant conflict, legal and illegal capturing of elephants and poaching etc. The coordinated and determined effort is needed from public and regulatory bodies to effectively address the challenges. The bottle necks for safe movements are identified based on field investigation and it is recommended the forest department to acquire the lands for better connectivity, based on existing width of forest boundary, available forest area and gomala lands. The boundary of BNP is having highly irregular shape and it measures about 59 km in length and the width varies from 0.2 km to 13.8 km. These regions should be fenced and enriched with native species. Table 10 lists the areas (with spatial extent) to be acquired for better connectivity of BNP. Figure 20 lists identified regions for effective elephant moment with in BNP area. Figure 21 (a, b, c, d, e, f, g) shows the polygon current land form as shown in Google earth. The Forest department should undertake flowing on priority to minimize human animal conflicts.
 |
 |
 |
 |
 |
 |
 |
|
Figure 21 (a, b, c, d, e, f, g): Regions (areas) to be acquired (Violet color represents BNP boundary) |
|
S.NO |
Polygon name |
Villages covered |
Area (Ha) |
Current land form |
Reason |
1 |
E1 |
Bhoothanahalli, Gulakamale, Uttarahalli Manavartha Kaval, Bilwaradahalli, Badamanavarthekaval (P), Kannaikana Agrahara, Agrahara-2 |
2196.97 |
Forest (degraded) & Gomala land, Agriculture |
Earmarked based on existing forest cover that support diverse fauna (Ex. Leopard etc.) and Elephant crop ride information. Thottikallu falls also present in this region. |
2 |
E2 |
Katrinatha |
31.03 |
Agriculture |
To increase the width (to 1 km) of BNP for effective and safe passage of elephants. Existing width is only 313 m. |
3 |
E3 |
Elachavadi-1 |
12.60 |
Forest; Agriculture |
To increase the width (to 0.45 km) of BNP for effective and safe passage of elephants. Earlier width existing only 173 m. |
4 |
E4 |
Elachavadi-2 |
22.68 |
Forest |
Connecting disconnected BNP boundary with in between agriculture area. |
5 |
E5 |
Bhimasandra Lingapura |
28.93 |
Forest; Agriculture |
Connecting existing disconnected BNP boundary with acquiring agriculture land. |
6 |
E6 |
Maniyambal, Bachahalli |
343.79 |
Forest |
Connecting with existing |
7 |
E7 |
Gattigonda |
113.62 |
Agriculture |
Connecting existing BNP boundary between Kolagondanahalli, Kengalnath Gollahalli villages |