Ecosystems are distinct biological entities that sustain the biosphere and characterised by a range of functions: nutrient cycling, bio-geo chemical cycle, hydrologic cycling, etc.Ecological sensitivity of ecosystems refers to their ability to cope with various kinds of environmental disturbances that have the potential of adversely changing the character of the natural landscapes. The conservation and sustainable management of ecosystems are the vital components in the pursuit of development goals that are ecologically, economically and socially sustainable. This requires an understanding of the complex functioning of ecosystems, and recognition of the full range and diversity of resources, values and ecological services that they represent, with the ability to significantly influence climate at local as well as at the global scale. Sustainability implies the equilibrium between society and the natural resources (Ramachandra et al., 2007). This entails careful and conservative utilization of natural resources to maximize their availability over time. In this regard, an approach with holistic integrated strategies considering all components and functions of the ecosystems in developmental planning is quintessential. Also, there is a need to conserve and benefit from the knowledge of uses and the traditions of conservation of biological diversity. This formidable challenge of ecosystem approach of conservation (ecosystem management) can be addressed only through proper understanding the ecosystem functioning, addressing the socio-economic values bounded by the institutional mandates. Equitable benefit sharing among all, especially local people, ensures the sustainability of natural resources. Sustainable management of ecosystems is possible only with the co-operation of the people, many of whom still depend on them for their day-to-day sustenance and the knowledge of the status and dynamics of these ecosystems resides with these same people (Ramachandra et al., 2007).
Sustainable development of a region requires a synoptic ecosystem approach that relates to the dynamics of natural variability and the effects of human interventions on key indicators of biodiversity and productivity(Ramachandra et al., 2007). Conservation has become challenging task as in the face of increasing human pressures on ecosystem. An anthropogenic disturbance on landscape is of much higher intensities compared to natural disturbance processes (such as wind and fire), which alter abiotic and biotic environments across wide areas (Kivinen and Kumpula, 2013). Forests covers about 31% today at globally as opposed to 50% of the earth's land area 8000 years ago (FAO, 2011) with the expanded extents of croplands, pastures, plantations, and urban areas. The need to provide food, fiber, water, and shelter to more than seven billion people (Foley et al., 2005, Smaling et al., 2012) driven wide-ranging changes of earth surface. This unsustainable use of the planet's resources have affected the biogeochemistry, hydrology, food security, climate and socioeconomic systems (IPCC, 2007; Smaling et al., 2012). Unplanned developmental activities have affected the land capacity to sustain biological productivity, to maintain environmental quality and long-term sustainability of socioeconomic systems (Vitousek et al., 1997). Unsustainable use of land resources for different purposes, such as forestry, tourism, mining has various impacts on land cover leading to the scarcity of natural resources.
Competition for resources and consequent land cover transformations has resulted in conflicts between different land uses leading to ecosystem degradation, which have reduced the biological and economic productivity (Berkres and Davidson-Hunt, 2006; Moen and Keskitalo, 2010) of prestine ecosystems. This necessitates an understanding of the long term driving forces of landscape dynamics for a comprehensive planning to ensure the sustainability of natural resources. This requires integration of biological, social and economic factors within decision making framework for effective ecosystem planning (Watson et al., 2011a).
Decision making based on the biophysical and socio-cultural information provides opportunities and constraints in decision-making while ensuring landscapes sustainability (Steiner, 2000; Opdam et al., 2006). Ecological sustainable landscape development planning aims for a condition of stability in ecological, physical and social systems (cultural, economic functions) achieved by maintaining the sustainability of natural resources with intergeneration equity (Opdam et al., 2006). Prioritisation of sensitive regions for conservation (Myers et al., 2000) through a multidisciplinary approach is widely accepted norm to identify hotspots of biodiversity. A range of conservation actions being practiced, include protecting altitudinal gradients (Watson et al., 2011b), protection of contiguous forests with native vegetation, habitat of endemic flora and fauna, sacred patches of forests/kans/groves and creating large scale corridors that allow shifts in species ranges due to environmental changes (Hannah et al., 2007, Toth et al., 2011). Spatial components such as riverine corridors, upland-lowland gradients, macroclimatic gradients, etc. have been identified as proxies of key ecological processes at regional scales. Participatory or incentive based instruments are often used as proxies at local scale. In addition, knowledge of landscape dynamics due to the natural and anthropogenic activities is required for evolving apt conservation measures (Pressey et al., 2007). The local conservation endeavours involving effective strategic planning processes also help in global conservation (Boyd et al., 2008; Toth et al., 2011). Implications of the environmental changes on natural resources are to be sufficiently perceived and understood by policy makers and the decision makers for management interventions.
The spatial conservation planning considering both ecological and cultural dimensions will results in as ecologically sensitive regions (ESR). Ecological sensitive regions treasure sensitive natural elements that could be degraded or lost as a result of uncontrolled or incompatible development. ESR will aid in demarcating regions for conservation and community usage based on ecological and social / cultural dimensions. Ecological dimension refers to the natural environment such as ecosystems and ecological processes. While, cultural dimension refers to the human culture such as political, social, technological and economic aspects. ESR are identified based on the quality, the scarcity, or the role they play in the ecosystem and culture, to maintain essentially the ecological characteristics and integrity (Frederick et al., 2000). Ecological and cultural dimensions are two different perspectives of reality and are combined as a result of history of diversified interplay and interdependence between the two (Williams, 1980).
Section 5(1) of Environment (Protection) Act 1986 (EPA), Ministry of Environment and Forests (MoEF), Government of India regulate the location of industries and carrying out certain operations on the basis of considerations like the ecological sensitivity. The MoEF had set up Committee (Pronab Sen Committee) to identify parameters for designating Ecologically Sensitive Areas in the country to counter the rapid deterioration of the environment, both nationally and internationally (MoEF, 2000). The committee has defined ecological sensitivity or fragility as permanent and irreparable loss of extant life forms from the world; or significant damage to the natural processes of evolution and speciation. Gadgil et al., 2011 prepared an outline for determining eco-sensitive regions based on biological, economical, socio cultural values depending upon the context and the area or location for conservation. ESRs are the areas that are ecologically and economically very important but, vulnerable to even mild disturbances and hence demand conservation. These are the `unique’ regions that are biologically and ecologically valuable and are hence irreplaceable if destroyed (Gadgil et al., 2011). The delineation of ESR is not confined by a set of variables and their possessions. They are location specific and cannot be narrowed by a specific range. The structured protocol for defining ecological sensitive region by a series of attributes with the criteria to be used for each of them and then provide a methodological process is not well defined (Gadgil et al., 2011). Delineation of certain key variables is required to represent entire system or mimic major system’s functionalities. Determining a system’s boundary is another most important and challenging aspects of working with ecosystems, given that many ecosystem processes are very diffuse and dynamic.
Various empirical and statistical approaches based on regression or probability analysis have been applied widely to assess regional conservation priorities. The underlying disadvantage of this approach is lack of spatial visualisation required for planning process. Moreover, methods developed without spatial attributes were inadequate at the regional level where the most information is available on terrestrial and aquatic ecosystems, land-use changes, and a variety of simultaneous stressors (Li et al., 2006). Geo informatics equipped with free and open source softwares has gained significance in recent times due to the contribution to spatial conservation planning of a region by providing spatial analytical and modelling abilities for understanding of ecological systems (Rundell et al., 2009; Ramachandra et al., 2012). Remote sensing, geographical information systems (GIS) are powerful tools for handling spatial data (Bharath et al., 2012), performing spatial analysis and manipulating spatial outputs. GIS also provides a consistent visualisation environment for displaying the input data and results of a model (Wang et al., 2010). The intrinsic ability of GIS to store, analyze and display large amounts of spatial data (Ramachandra et al., 2012) enables it to make a significant contribution to ecological conservation assessment (Ramachandra et al., 2007). This ability of GIS as decision support system is very useful in a decision-making process (Vairavamoorthy et al., 2007). Temporal information on land cover, bio-geophysical data are used for global change studies, including climate change, biodiversity conservation, ecosystem assessment and environmental modelling, planning and management (Melesse, 2004). Thus, spatial and temporal information is required to undertake management interventions with mitigation measures in a region (Woldie et al., 2011).
Spatial decision support tools are playing an important role that simultaneously meet conservation targets while minimizing social and economic costs to guide management actions and locations. The integration of spatial tools is increasing accountability and transparency in the planning process and leading to more economically efficient conservation actions (Knight et al., 2006; Joseph et al., 2011; Marignani and Blasi, 2012). Various techniques and methodologies have evolved to design effective panning. Remote sensing, geographical information systems (GIS) and quantification of the fauna, flora, physical environment and anthropic disturbance are widely used in geospatial model based analyses. With the existing knowledge, planning approach should revise to allow spatio temporal alterations of features, biodiversity, threats and management options to demonstrate a systematic conservation planning at a fine scale. Decision making on developmental activities, entail planning that depends upon the availability of reliable and accurate data. Data required for natural resource planning include spatial data such as, information of physiography of the area, land use, assets, etc. Geographic information system (GIS) with a capability of handling spatial data helps in the analysis and visualisation of results effectively, and aids decision making process.
National Park is an area which is strictly reserved for the betterment of the wildlife & biodiversity, and where activities like developmental, forestry, poaching, hunting and grazing on cultivation are not permitted. National Parks are declared by the Central Government under Wild life Protection Act 1972 for biodiversity conservation based on the state government guidelines such as natural and reliable habitats for wildlife. They are usually small reserves spreading in an area of 20 sq. km. to 5000 sq. km. In national parks, the emphasis is on the preservation of floral or faunal species. National parks in India are IUCN category II protected areas. India's first national park was established in 1936 as Hailey National Park, now known as Jim Corbett National Park, Uttarakhand. By 1970, India only had five national parks. In 1972, India enacted the Wildlife Protection Act and Project Tiger to safeguard the habitats of conservation reliant species. Total number of national parks are 103 with an area of 40500.59 km2, comprising 1.23% of India's total surface area (Table A). The Madhya Pradesh state and Andaman and Nicobar Islands have highest national parks (9) among all the states and Union territories. The area wise Uttarakhand state has larger extent (4915.44 km2) under national parks.
Table A: National Parks in India
SNO |
National Park |
State |
Established |
Total number |
Area (km²) |
Total area (km²) |
1 |
Campbell Bay National Park |
Andaman and Nicobar Islands |
1992 |
9 |
426.23 |
1153.94 |
2 |
Galathea National Park |
Andaman and Nicobar Islands |
1992 |
110 |
||
3 |
Mahatma Gandhi Marine National Park |
Andaman and Nicobar Islands |
1983 |
281.5 |
||
4 |
Middle Button Island National Park |
Andaman and Nicobar Islands |
1987 |
0.44 |
||
5 |
Mount Harriet National Park |
Andaman and Nicobar Islands |
1987 |
46.62 |
||
6 |
North Button Island National Park |
Andaman and Nicobar Islands |
1987 |
0.44 |
||
7 |
Rani Jhansi Marine National Park |
Andaman and Nicobar Islands |
1996 |
256.14 |
||
8 |
Saddle Peak National Park |
Andaman and Nicobar Islands |
1987 |
32.54 |
||
9 |
South Button Island National Park |
Andaman and Nicobar Islands |
1987 |
0.03 |
||
10 |
Papikonda National Park |
Andhra Pradesh |
2008 |
3 |
1012.86 |
1368.88 |
11 |
Rajiv Gandhi National Park |
Andhra Pradesh |
2005 |
2.4 |
||
12 |
Sri Venkateswara National Park |
Andhra Pradesh |
1989 |
353.62 |
||
13 |
Mouling National Park |
Arunachal Pradesh |
1986 |
2 |
483 |
2290.82 |
14 |
Namdapha National Park |
Arunachal Pradesh |
1983 |
1807.82 |
||
15 |
Dibru-Saikhowa National Park |
Assam |
1999 |
5 |
340 |
1977.79 |
16 |
Kaziranga National Park |
Assam |
1974 |
858.98 |
||
17 |
Manas National Park |
Assam |
1990 |
500 |
||
18 |
Nameri National Park |
Assam |
1998 |
200 |
||
19 |
Rajiv Gandhi Orang National Park |
Assam |
1999 |
78.81 |
||
20 |
Valmiki National Park |
Bihar |
1989 |
1 |
335.65 |
335.65 |
21 |
Guru Ghasi Das (Sanjay) National Park |
Chhattisgarh |
1981 |
3 |
1,440.71 |
2,899.08 |
22 |
Indravati National Park |
Chhattisgarh |
1982 |
1258.37 |
||
23 |
Kanger Valley National Park |
Chhattisgarh |
1982 |
200 |
||
24 |
BhagwanMahavir (Mollem) National Park |
Goa |
1992 |
1 |
107 |
107 |
25 |
Blackbuck National Park, Velavadar |
Gujarat |
1976 |
4 |
34.53 |
480.12 |
26 |
Gir Forest National Park |
Gujarat |
1975 |
258.71 |
||
27 |
Marine National Park, Gulf of Kutch |
Gujarat |
1982 |
162.89 |
||
28 |
Vansda National Park |
Gujarat |
1979 |
23.99 |
||
29 |
Kalesar National Park |
Haryana |
2003 |
2 |
46.82 |
48.25 |
30 |
Sultanpur National Park |
Haryana |
1989 |
1.43 |
||
31 |
Great Himalayan National Park |
Himachal Pradesh |
1984 |
5 |
754.4 |
2271.28 |
32 |
Inderkilla National Park |
Himachal Pradesh |
2010 |
104 |
||
33 |
Khirganga National Park |
Himachal Pradesh |
2010 |
710 |
||
34 |
Pin Valley National Park |
Himachal Pradesh |
1987 |
675 |
||
35 |
Simbalbara National Park |
Himachal Pradesh |
2010 |
27.88 |
||
36 |
Dachigam National Park |
Jammu and Kashmir |
1981 |
4 |
141 |
3925 |
37 |
Hemis National Park |
Jammu and Kashmir |
1981 |
3350 |
||
38 |
Kishtwar National Park |
Jammu and Kashmir |
1981 |
425 |
||
39 |
Salim Ali National Park |
Jammu and Kashmir |
1992 |
9 |
||
40 |
Betla National Park |
Jharkhand |
1986 |
1 |
226.33 |
226.33 |
41 |
Anshi national park |
Karnataka |
1987 |
5 |
417.37 |
2795.79 |
42 |
Bandipur National Park |
Karnataka |
1974 |
874.2 |
||
43 |
Bannerghatta National Park |
Karnataka |
1974 |
260.51 |
||
44 |
Kudremukh National Park |
Karnataka |
1987 |
600.32 |
||
45 |
Nagarhole (Rajiv Gandhi) National Park |
Karnataka |
1988 |
643.39 |
||
46 |
Anamudi Shola National Park |
Kerala |
2003 |
6 |
7.5 |
558.16 |
47 |
Eravikulam National Park |
Kerala |
1978 |
97 |
||
48 |
Mathikettan Shola National Park |
Kerala |
2003 |
12.82 |
||
49 |
Pambadum Shola National Park |
Kerala |
2003 |
1.32 |
||
50 |
Periyar National Park |
Kerala |
1982 |
350 |
||
51 |
Silent Valley National Park |
Kerala |
1984 |
89.52 |
||
52 |
Bandhavgarh National Park |
Madhya Pradesh |
1968 |
9 |
448.85 |
3656.36 |
53 |
Indira PriyadarshiniPenchNational Park |
Madhya Pradesh |
1975 |
292.85 |
||
54 |
Kanha National Park |
Madhya Pradesh |
1955 |
940 |
||
55 |
Madhav National Park |
Madhya Pradesh |
1959 |
375.22 |
||
56 |
Mandla Plant Fossils National Park |
Madhya Pradesh |
1983 |
0.27 |
||
57 |
Panna National Park |
Madhya Pradesh |
1981 |
542.67 |
||
58 |
Sanjay National Park |
Madhya Pradesh |
1981 |
466.88 |
||
59 |
Satpura National Park |
Madhya Pradesh |
1981 |
585.17 |
||
60 |
Van Vihar national park |
Madhya Pradesh |
1979 |
4.45 |
||
61 |
Chandoli National Park |
Maharashtra |
2004 |
6 |
317.67 |
1273.6 |
62 |
Gugamal National Park |
Maharashtra |
1975 |
361.28 |
||
63 |
Navegaon National Park |
Maharashtra |
1975 |
133.88 |
||
64 |
Pench National Park |
Maharashtra |
1975 |
257.26 |
||
65 |
Sanjay Gandhi (Borivilli) National Park |
Maharashtra |
1983 |
86.96 |
||
66 |
Tadoba National Park |
Maharashtra |
1955 |
116.55 |
||
67 |
KeibulLamjao National Park |
Manipur |
1977 |
1 |
40 |
40 |
68 |
Balphakram National Park |
Meghalaya |
1985 |
2 |
220 |
267.48 |
69 |
Nokrek National Park |
Meghalaya |
1986 |
47.48 |
||
70 |
Murlen National Park |
Mizoram |
1991 |
2 |
100 |
150 |
71 |
Phawngpui Blue Mountain National Park |
Mizoram |
1992 |
50 |
||
72 |
Intanki National Park |
Nagaland |
1993 |
1 |
202.02 |
202.02 |
73 |
Bhitarkanika National Park |
Odisha |
1988 |
2 |
145 |
990.7 |
74 |
Simlipal National Park |
Odisha |
1980 |
845.7 |
||
75 |
Desert National Park |
Rajasthan |
1992 |
5 |
3162 |
3947.07 |
76 |
Keoladeo National Park |
Rajasthan |
1981 |
28.73 |
||
77 |
Mukundra Hills (Darrah) National Park |
Rajasthan |
2006 |
200.54 |
||
78 |
Ranthambore National Park |
Rajasthan |
1980 |
282 |
||
79 |
Sariska National Park |
Rajasthan |
1982 |
273.8 |
||
80 |
Khangchendzonga National Park |
Sikkim |
1977 |
1 |
1784 |
1784 |
81 |
Guindy National Park |
Tamil Nadu |
1976 |
5 |
2.82 |
307.85 |
82 |
Gulf of Mannar Marine National Park |
Tamil Nadu |
1980 |
6.23 |
||
83 |
Indira Gandhi (Annamalai) National Park |
Tamil Nadu |
1989 |
117.1 |
||
84 |
Mudumalai National Park |
Tamil Nadu |
1990 |
103.24 |
||
85 |
Mukurthi National Park |
Tamil Nadu |
1990 |
78.46 |
||
86 |
KasuBrahmananda Reddy National Park |
Telangana |
1994 |
3 |
1.43 |
19.62 |
87 |
MahavirHarinaVanasthali National Park |
Telangana |
1994 |
14.59 |
||
88 |
Mrugavani National Park |
Telangana |
1994 |
3.6 |
||
89 |
Bison( Rajbari ) National Park |
Tripura |
2007 |
2 |
31.63 |
36.71 |
90 |
Clouded Leopard National Park |
Tripura |
2007 |
5.08 |
||
91 |
Dudhwa National Park |
Uttar Pradesh |
1977 |
1 |
490 |
490 |
92 |
Gangotri National Park |
Uttarakhand |
1989 |
6 |
2390.02 |
4915.44 |
93 |
GovindPashuVihar |
Uttarakhand |
1990 |
472.08 |
||
94 |
Jim Corbett National Park |
Uttarakhand |
1936 |
520.82 |
||
95 |
Nanda Devi National Park |
Uttarakhand |
1982 |
624.6 |
||
96 |
Rajaji National Park |
Uttarakhand |
1983 |
820.42 |
||
97 |
Valley of Flowers National Park |
Uttarakhand |
1982 |
87.5 |
||
98 |
Buxa National Park |
West Bengal |
1992 |
6 |
117.1 |
1981.65 |
99 |
Gorumara National Park |
West Bengal |
1992 |
79.45 |
||
100 |
Jaldapara National Park |
West Bengal |
2014 |
216.51 |
||
101 |
Neora Valley National Park |
West Bengal |
1986 |
159.89 |
||
102 |
Singalila National Park |
West Bengal |
1986 |
78.6 |
||
103 |
Sundarbans National Park |
West Bengal |
1984 |
1330.1 |
||
Total number of National Parks |
103 |
Total area |
40500.59 |
|||
Karnataka state is spread across 191,791 square km geographical area in India. The state with the diverse ecological regions, complex topography, heterogeneous soils, climate and geographical history has rich biological resources with variety of flora and fauna. As per the annual report of the state’s Forest Department for the year 2014-15 Karnataka has 43,356.47 sq. km forest area (Government of Karnataka vide G.O. No FEE 270 FGL 2002), which covers 22.61% of the state’s geographical area. It accounts for around 6.18% of India’s total forest cover of 701,673 sq. km. The percentage recommended by the National Forest Policy is 33%, but Karnataka has lower than all-India average forest cover. The forest cover in Karnataka can be classified as Reserved Forests (26,879.47), Protected Forests (National Parks and Sanctuaries) (6,350.07), Unclassified Forests (10,024.91), Village Forests (49.05) and Private Forests (54.07) sq. km. The protected areas especially in context of India account for 4.5% of the country's geographical area. In Karnataka, protected area constitute around 14.65 % of total forest cover and 3.31 % area in total geographical extent. Forest types in Karnataka can be classified as 5 different categories as per their green foliage, elevation and rainfall – (i) Evergreen and Semi-evergreen Forest; (ii) Moist Deciduous Forest; (iii) Dry Deciduous Forest; (iv) Scrub and Thorny Forest; and (vi) Un-wooded Forest/ grass lands.
The Union government has formulated numerous legislations to protect forests,conservation, use of biological resources, associated knowledge and environmentsuch as The Prevention of Cruelty to Animals Act, 1960 (59 of 1960); The National Environment Tribunal Act, 1995 (27 of 1995); The National Environment Appellate Authority Act, 1997 (22 of 1997); The Water Prevention and Control of Pollution Act, 1974 (6 of 1974); The Water (Prevention and Control of Pollution) CESS Act, 1977 (36 of 1977); The Air (Prevention and Control of Pollution) Act, 1981 (14 of 1981); The Indian Forest Act, 1927 (16 of 1927); The Wildlife (Protection) Act, 1972 (53 of 1972); The Forest (Conservation) Act, 1980 (69 of 1980); The Environment (Protection), Act, 1986 (29 of 1986). The Public Liability Insurance Act, 1991 (6 of 1991); Biological Diversity Act, 2002.
Karnataka state has created 5 National Parks, 27 Wildlife Sanctuaries and 8 Conservation and Community Reserves to protect the environment and wildlife. These reserves were created with the intension of conserving the biodiversity, which are having ecological, faunal, floral, geomorphological, natural or zoological significance. These regions represent the diverse vegetation types based on the location such as tropical humid evergreen to scrub type of forests of varied ecosystems with endangered species of flora and fauna.
1.2 Bannerghatta National Park (BNP)
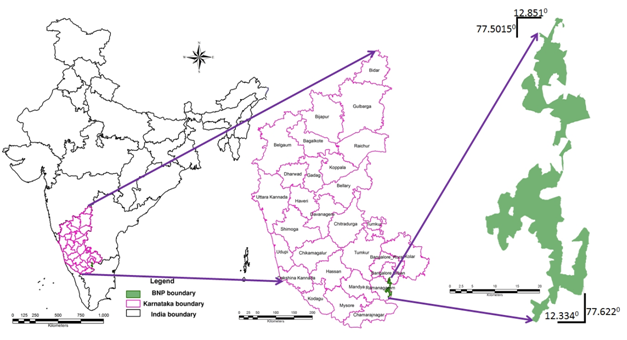
Bannerghatta National Park(BNP) was declared as national park in 1974 with an area of 106.83 sq. km by Government of Karnataka vide Notification No. AFD.61 FWL 74, dated 6-25/9-1974 published in the Karnataka Gazettee dated 9-1-75 in exercise of the powers conferred by sub-section (1) of Section 35 of The Wild Life (Protection) Act, 1972 (Central Act 53 of 1972). It had comprised 2 reserve forests spread over in the district of Bangalore urban and Bangalore rural. The various plans and proposals were considered by forest department, Government of Karnataka till 2009 to widen and develop the Bannerghatta National Park. These plans were created for reducing the pressure of the people residing in the periphery of the park, reducing human – animal conflict as well as depredation of crop by elephants, habitat improvement for increasing the carrying capacity of the park and the restoration of entire ecosystem. The plan envisaged managing the BNP on sound principles of latest wildlife management practices. Thus the management plan has approved in 2011 by an effective administrative setup with the addition of Kodihalli Range from adjacent Ramanagara Territorial Division for implementing the plan prescriptions. The total area of BNP now encompasses an area of 260.51 sq.km comprising of 13 reserve forests (Table 1) spread over the districts of Bangalore urban, Bangalore rural and Ramanagara asper Vide G. O. No. FEE 302 FWL 2011 (II), dated: 27.12.2011 (Figure 1). The boundary of BNP is having highly irregular shape and it measures about 59 km in length and the width varies from 0.3 km to 13.8 km. BNP regions has 31 Beats under 6 ranges for effective management and protection (Table 2 and Figure 3, 4).
S NO. |
Reserve Forest details |
Area (Ha) |
1 |
Kalkere Reserve Forest |
550.11 |
2 |
Bannerghatta Reserve Forest |
176.06 |
3 |
Bannerghatta Lac Reserve |
64.75 |
4 |
Ragihalli Reserve Forest |
3070.01 |
5 |
Suddahalla Lac Reserve |
145.40 |
6 |
Ragihalli Extension Block South Reserve |
362.73 |
7 |
Gullahatti Reserve Forest |
1529.34 |
8 |
Kardikal Reserve Forest |
784.75 |
9 |
Mahadeshwara Reserve Forest |
2226.68 |
10 |
Bantanal Reserve Forest |
1398.21 |
11 |
Bilekal Reserve Forest |
11101.78 |
12 |
Manjunatha Reserve Forest |
2712.46 |
13 |
Ramadevarabetta Reserve Forest |
1929.38 |
Total |
26051.71 |
|
The forests of BNP region are known for their high species diversity, structural organization, spatial heterogeneity and adaptation to dry climate, moisture stress and irregular rainfall. The average temperature ranges from 22°C to 35°C and the annual monsoon rainfall varies from 625 mm to 1607 mm from June to mid of November from South West and North-East-monsoons. The terrain represents undulating with broken chains of bolder strewn hillocks and hills of rocky outcrop and watercourses. The highest peak in National Park are Bilikal Betta and DoddaRagihalli Betta at an altitude of 1075 and 1035 m above sea level respectively. The lowest ground is the Rayatmalhole at 700 m above sea level, granite sheet rocks characterize the higher hills. Two types of soils are found such as red soil generally deep shallow mixed with metamorphic forms of rocks in undulating grounds, sandy loams formed with finer particles of the decomposed rocks washed down and deposited during rains in valleys. The forest types cover moist deciduous, dry deciduous forests, thorny scrub and grass lands with rich flora and fauna These ecologically fragile regions are undergoing severe land cover changes due to anthropogenic pressures. The landscape consists of fragmented forest patches, interspersed agricultural lands, pastures, habitations, etc. BNP is one of the oldest habitats of Asian elephants, supporting 100-150 population and large number of 200-300 migratory population also noticed from adjoining Tali reserve forest and Kaveri wild life sanctuary (Figure 2). The cropping pattern of BNP and its environs (5 km) have evolved with modern system of agriculture due to proximity of Bangalore. The farmers grow commercial crops such as banana, coconut, vegetables, sugarcane, mulberry and various flowers. The streams such as Suvarnamukhi, Hebballa, Suddahalla, JakkanahallaMuthyalammamaduholé, Rayathmalaholéand Anthragangehalla sustain livelihood of farmers.
Fragmentation of forests in the region has impacted the habitat of wild fauna, evident from frequent human-animal conflicts, crop predation by elephants, etc. The electrocuting an elephant, illicitly taping live electric connection to fences, hunting or shooting is the common practice of farmers to protect crops. The incident of killing of wild animals by man as a retaliation against physical attack and against crop depredation has taken a toll of considerable number of wild animals around the park. The fragmentation and blocking of elephant migratory paths have impacted the movement of wild animals. In 1986 to 2000 herd of 22 and 20 elephants moved out from the Bannerghatta National Park of Karnataka (Sivaganesan&Bhushan, 1986; Manakadan et al., 2010), which adjoins the Hosur-Dharmapuri forests to its south.
BNP is situated close proximity to Bangalore metropolitan city (20 km to the BNP core area and 1.8 km from Bruhat Bengaluru MahanagaraPalike (BBMP) boundary), capital state of Karnataka. Urban centers are the major growth centers and growth poles play key role in initiating the process of industrialization and urbanization. Growing uncontrolled economic activities in and around BBMP region threatening the local wellbeing, agricultural regions of BNP. The unchecked exploitation of forest resources due to urbanization has become a major threat to the conservation of forest and its resources. The encroachment of forests, stone quarrying, sand mining and domestic livestock grazing are the major threats of BNP region. The encroachment of forestlands for cultivation is a common problem, causing denudation of forests. Stone quarrying and artificial sand manufacturing industries have been posing threats to the survival of National Park with monolithic granite rocky out crops. There is ban on quarrying of building materials around the national park to a radius of 1km from the boundary (buffer zone) of the park, as “Safe Zone” in the interest of providing peaceful and tranquil habitat to wildlife. Unabated activities of quarries are causing disturbance to wild animals due to use of explosives, and movement of vehicles and also disturbance to the park authority as they are illegal and needs to be stopped. BNP experiences high grazing pressure due to the concentration of livestock population in the surrounding villages is another major problem in the northern and western boundaries. Table 3 explains the details of crop damages by wild animals (mainly elephants) and compensation paid during the last five years by the forest department, Government of Karnataka
Sno |
BEAT |
RANGE |
DIVISION |
Area (Ha) |
1 |
KALKERE |
AINUR MARIGUNDI |
BWD |
99.22 |
2 |
KALKERE-1 |
AINUR MARIGUNDI |
BWD |
303.71 |
3 |
THAMMANAYAKANAHALLI |
ANEKAL |
BWD |
1201.40 |
4 |
THATEKERE "B" |
ANEKAL |
BWD |
797.64 |
5 |
THATEKERE "A" |
ANEKAL |
BWD |
554.03 |
6 |
BANNERGHATTA BIOLOGICAL PARK |
BANNERGHATTA BIOLOGICAL PARK |
BWD |
761.42 |
7 |
BANNERGHATTA WILD LIFE |
BANNERGHATTA WILDLIFE DIVISION |
BWD |
344.54 |
8 |
BEGAHALLI "A" |
BANNERGHATTA WILDLIFE DIVISION |
BWD |
548.30 |
9 |
BEGAHALLI "B" |
BANNERGHATTA WILDLIFE DIVISION |
BWD |
598.66 |
10 |
RAGIHALLI |
BANNERGHATTA WILDLIFE DIVISION |
BWD |
403.58 |
11 |
RAGIHALLI EXTENSION |
BANNERGHATTA WILDLIFE DIVISION |
BWD |
300.22 |
12 |
TATTEGUPPE |
BANNERGHATTA WILDLIFE DIVISION |
BWD |
478.08 |
13 |
VARADAHALLI |
BANNERGHATTA WILDLIFE DIVISION |
BWD |
480.43 |
14 |
BANTANAL EXTENSION |
HAROHALLI |
BWD |
544.53 |
15 |
GULLATTI "A" |
HAROHALLI |
BWD |
1040.25 |
16 |
GULLATTI "B" |
HAROHALLI |
BWD |
691.64 |
17 |
KARADIKAL |
HAROHALLI |
BWD |
839.20 |
18 |
MARALAVADI |
HAROHALLI |
BWD |
983.72 |
19 |
TOKKASANDRA |
HAROHALLI |
BWD |
1024.15 |
20 |
HANCHAGULI |
KODIHALLI |
BWD |
1404.91 |
21 |
BANNIMAKUDULLU |
KODIHALLI |
BWD |
1006.46 |
22 |
BILIDALE |
KODIHALLI |
BWD |
1153.64 |
23 |
MANJUNATHA |
KODIHALLI |
BWD |
1416.50 |
24 |
RAMADEVARABETTA |
KODIHALLI |
BWD |
1231.82 |
25 |
BETTAHALLI |
KODIHALLI |
BWD |
1246.84 |
26 |
KADUSHIVANAHALLY |
KODIHALLI |
BWD |
1085.82 |
27 |
DODDAGULLI |
KODIHALLI |
BWD |
1088.59 |
28 |
KEBBARE |
KODIHALLI |
BWD |
1135.08 |
29 |
KEBBARE |
KODIHALLI |
BWD |
1093.05 |
30 |
GOWDAHALLI |
KODIHALLI |
BWD |
1082.29 |
31 |
YELAVANTHA |
KODIHALLI |
BWD |
1154.89 |
*BANNERGHATTA WILDLIFE DIVISION-BWD |
Total Area |
26094.62 |
||
SNO |
Years |
Particulars |
Cattle killing |
Human injury |
Permanent disease |
Human death |
Property loss |
Crop |
Total |
1 |
2009-10 |
NC |
4 |
2 |
- |
1 |
4 |
783 |
794 |
AP |
10500 |
13403 |
- |
150000 |
4450 |
1316415 |
1494768 |
||
2 |
2010-11 |
NC |
29 |
2 |
- |
2 |
1 |
491 |
525 |
AP |
58000 |
25400 |
- |
300000 |
7000 |
1094732 |
1485132 |
||
3 |
2011-12 |
NC |
_ |
1 |
- |
1 |
- |
323 |
325 |
AP |
_ |
14655 |
- |
500000 |
- |
771946 |
1286601 |
||
4 |
2012-13 |
NC |
16 |
2 |
5 |
7 |
1568 |
1598 |
|
AP |
43000 |
24880 |
- |
2500000 |
18900 |
5396287 |
7983067 |
||
5 |
2013-14 (Up to Dec, 2013) |
NC |
1 |
- |
1 |
2 |
6 |
365 |
374 |
AP |
3000 |
- |
5000 |
1000000 |
7400 |
1070507 |
2130907 |
||
Number of cases (NC) |
Amount paid (AP) |
||||||||
Figure 1: Bannerghatta National Park.
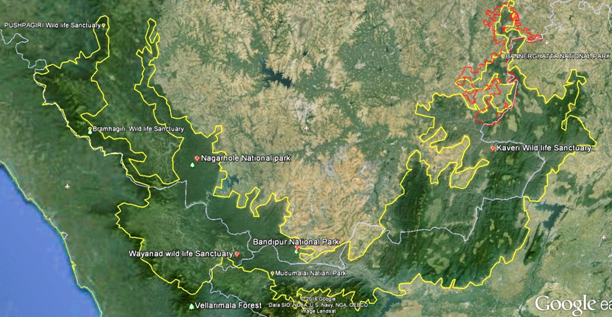
Figure 2: BNP and Mysore Elephant Reserve.
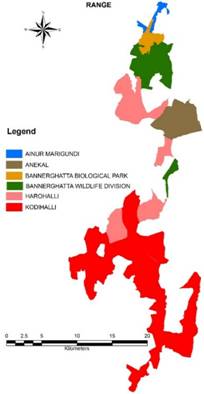
Figure3: Range wise map of BNP.
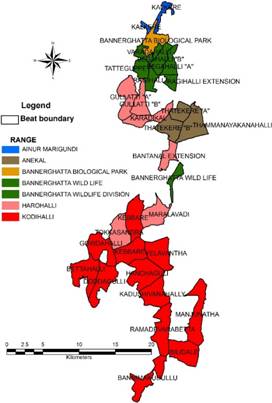
Figure4: Beat wise map of BNP
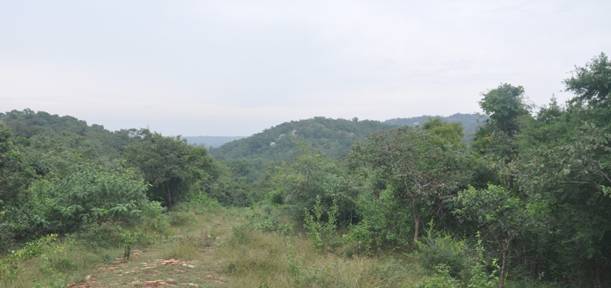 |
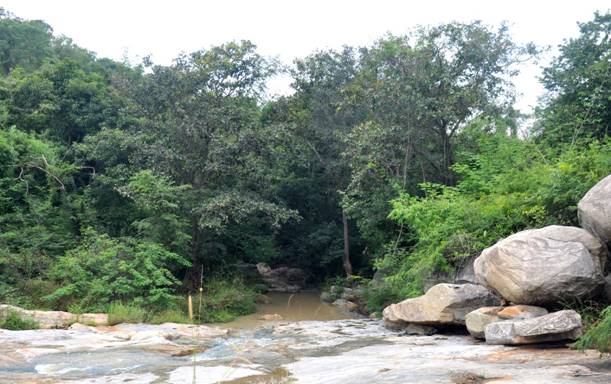
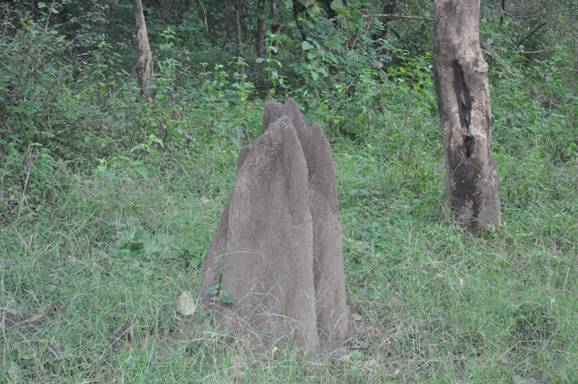
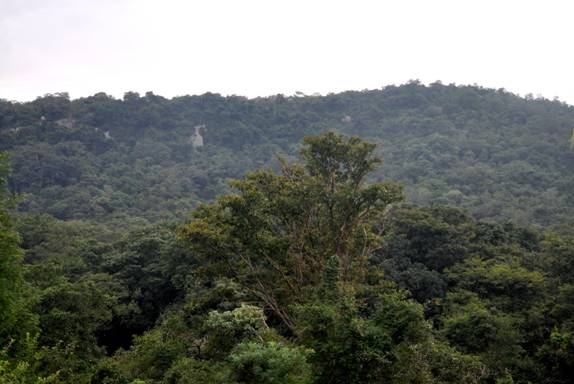
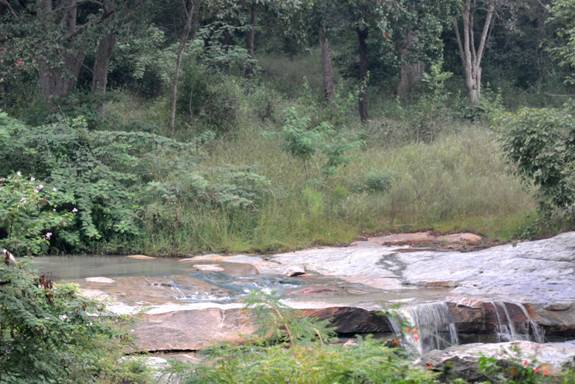
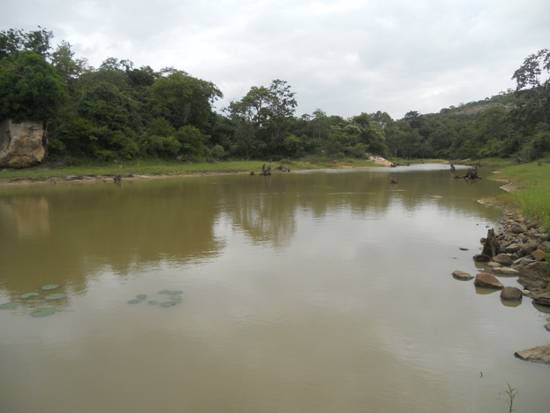
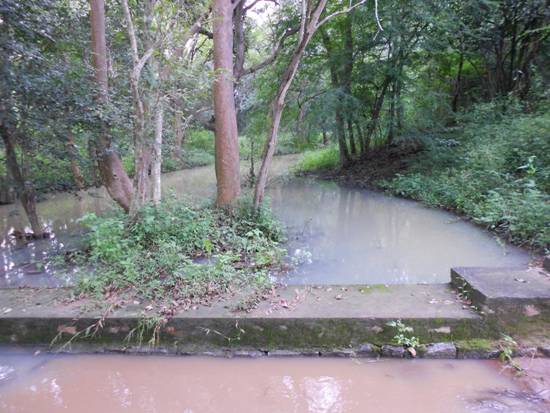
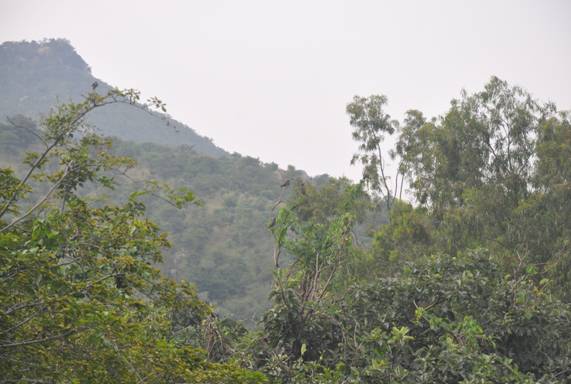
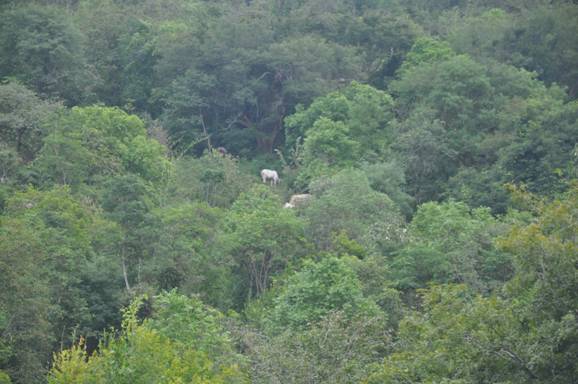
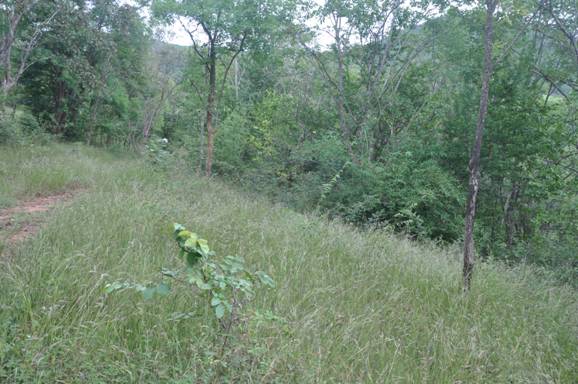
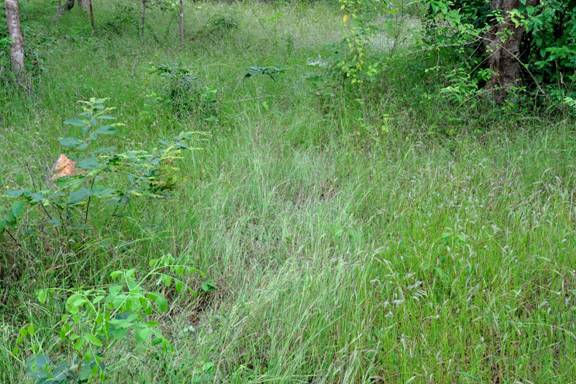
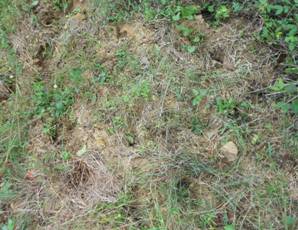
5. a) Landscape elements in BNP |
 |
b) |
 |
c) |
 |
d) |
 |
e) |
 |
f) |
 |
g) |
 |
h) |
 |
i) |
 |
j) |
 |
k) |
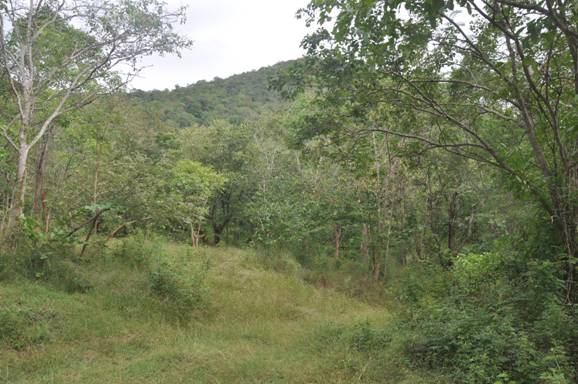 |
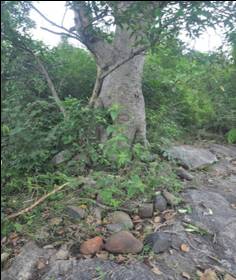
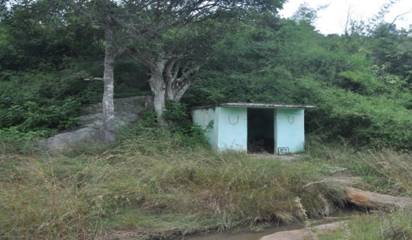
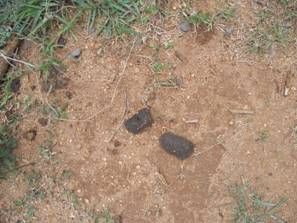
Figure 5 (a, to l): Various landscape elements of BNP. |
 |
 |
|
 |
||
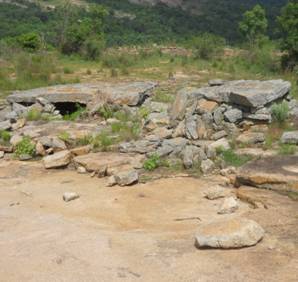
Figure 6: Old tribal tombs and Sacred groves in core BNP region |
||
 |
||
 |
||
 |
 |
|
 |
 |
|
 |
 |
|
 |
||
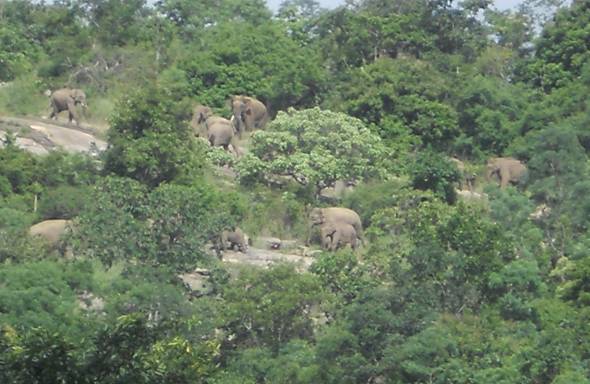
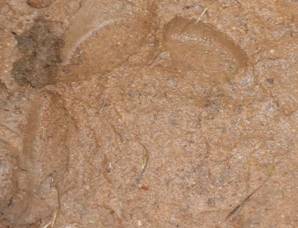
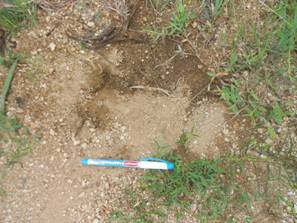
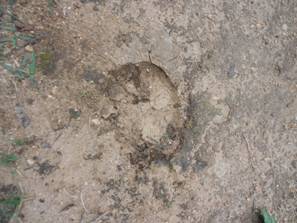
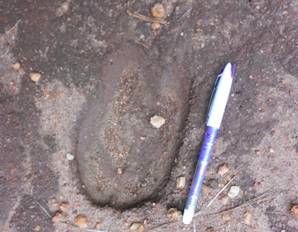
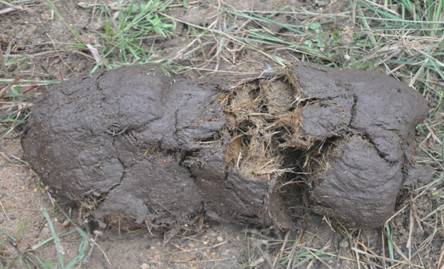
Figure 7 (a, b, c, d, e, f, g, h, i): Wild animals sighted and signatures (Elephant, Tiger pug mark, Wild bison, Deer) in BNP. |
||
 |
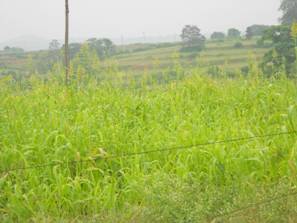 |
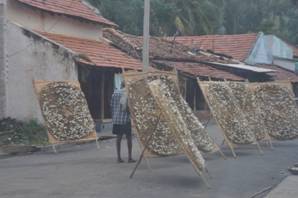
Figure 7: Mulberry Cultivation in BNP and its surrounding villages |
Figure 8: Agriculture field with bobbed wire to protect from wild animal (electrical connection provided during night). |
 |
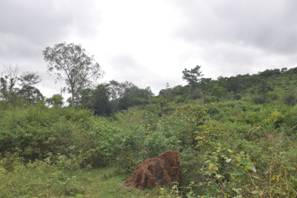 |
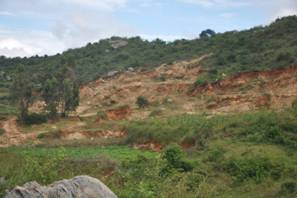
Figure 9: Sand mining and one of the Gomala regions in BNP |
|
References: