CONSERVATION AND MANAGEMENT OF WETLAND ECOSYSTEMS IN KARNATAKA
PROLOGUE :
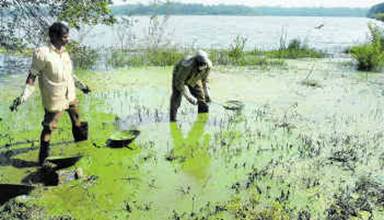
Aquatic ecosystems in India (lakes, rivers, etc.) support a large diversity of biota representing almost all taxonomic groups. Algae in open waters represent the floristic diversity and macrophytes dominate the wetlands. It is difficult to analyse the algal diversity in India with reference to different habitats, endemicity to India, as well as the changes that occur due to anthropogenic disturbances. The total number of aquatic plant species exceeds 1200 species. Fish fauna is divided into two classes, viz., Chondrichthyes (131 species under 67 genera, 28 families and 10 orders) and Osteichthyes (2,415 species belonging to 902 genera, 226 families and 30 orders). As per estimates, Indian wetlands support around 2400 species and subspecies of birds. Studies reveal that habitat losses have threatened the diversity of these ecosystems and introduced exotic species like water hyacinth (Eichornia crassipes) and salvinia (Salvinia molesta) have threatened the wetlands and clogged the waterways competing with the native vegetation.
The spatial extent of Indian wetlands is estimated to be 58.2 million hectares and is directly or indirectly dependent on the rivers like Godavari, Tapti, Ganga, Brahmaputra, Narmada, Krishna and Cauvery. Remotely sensed data in association with the geographical information systems provides a cost and time-effective tool for identification, mapping, inventorying and monitoring physical resources of the watershed which combined with information on the socio-economic needs help immensely in the implementation of developmental activities.
The water-spread area of wetlands in Karnataka in the pre-monsoon period is 204053.74 ha whereas in the post monsoon period it is 246643.00 ha. Out of the total 682 wetlands in the state, 71 have shown water-spread area of less than 56.25 ha. The seasonal variations in the wetland area are prevalent where the water levels fluctuate depending on their use and meteorological conditions. Hence the inland wetlands (pond, lakes, reservoirs and tanks) show seasonal variations in the water-spread.
The lakes around Bangalore were mainly constructed for irrigation and drinking water supply. But now only 30% of the lakes are used for irrigation. Fishing is carried out in 25% of the lakes surveyed, Cattle grazing in 35%, agriculture in 21%, mud-lifting in 30%, drinking in 3%, washing in 36% and brick-making in 38% of the lakes. Analyses of status of waterbodies in Bangalore, the results revealed that some of the lakes needed urgent attention from the point of view of their unsuitability to sustain biological activity and diversity. The highly threatened lakes include Anchepalaya, Bellandur, Chikka Hulimavu, Harohalli, Kengeri, Kalkere, Nagavara, Nelamangala, Puttenhalli, Rachenahalli, Rampura, Tavarakere, Ulsoor, Varthur, Vengaiah, Yellchehalli and Yellamallappachetty.
The number of lakes in Bangalore city has reduced from 262 in 1960 to around 81 at present. The spatial and temporal changes in the number of waterbodies were done with the help of GIS and remote sensing data. The spatial mapping of the water bodies in Bangalore district revealed that the number of waterbodies has decreased from 379 (138 in North and 241 in south) in 1973 to 246 (96-north and 150-south) in 1996. An overall decrease of 35.09% was attributed to urbanisation and industrialisation.
The loss in wetland interconnectivity in Bangalore district is attributed to the enormous increase in population and the reclamation of tanks for various developmental activities. Analyses of Madivala and Bellandur drainage network revealed that encroachment and conversion has resulted in the loss of connectivity between Yelchenhalli kere and Madivala. Similarly the drainage network between Bellandur and Ulsoor is lost due to conversion of Chelgatta tank into a golf course.
The loss of wetlands has led to decrease in catchment yield, water storage capacity, wetland area, number of migratory birds, floral and faunal diversity and ground water table. Studies reveal the decrease in depth of the ground water table from 35-40 to 250-300 feet in 20 years due to the disappearance of wetlands.
Despite many environmental laws, there is no significant development towards sustaining these ecosystems due to the lack of awareness of the values of these ecosystems among the policymakers and implementation agencies. The effective management of these wetlands requires a thorough appraisal of the existing laws, institutions and practices. The involvement of various people from different sectors is essential in the sustainable management of these wetlands. Apart from government regulation, development of better monitoring methods is needed to increase the knowledge of the physical and biological characteristics of each wetland resources, and to gain, from this knowledge, a better understanding of wetland dynamics and their controlling processes.
Sectoral approaches adopted in regional planning has led to breakdown of lake-watershed systems, which expediate agricultural phosphorus flows, draining and development of wetlands, dislodging of riparian vegetation, overfishing and spread of exotic species
Restoration program should include all aspects of the ecosystems, including habitat restoration, reduction of phosphorus imports to farms, elimination of annoying species, reduced harvests of fish and restoration of native species from the ecosystem outlook with holistic approach designed at watershed level, rather than isolated manipulation of individual elements. The conservation and protection involves not only buffering wetlands from direct human pressures, but also maintaining important natural processes that operate on wetlands from outside, which may be altered by human activities. Management towards this goal should emphasize long term sustenance of historical, natural wetland functions and values.
1. INTRODUCTION :
Wetland ecosystems account for about 6% of the global land area and are among the most threatened of all the environmental resources. Wetlands have long suffered significant losses and continue to face an on-going conversion threat from industrial, agricultural and residential developments as well as hydrological perturbation, pollution and pollution-related effects. The extensive tropical wetland resources in developing economies are also undergoing increasing change as a result of improving access to wetland zones, the pressures of population growth and economic development. Many wetlands have and are being degraded because of unsustainable levels of grazing and fishing activities. The continuing losses and enhanced appreciation of the values and functions of wetlands during the last 20 years, has led to wetland loss becoming a worldwide concern leading to international agreements like the RAMSAR convention in 1971 (IUCN, 1990).
Wetlands are more valuable economic resources when retained in their natural or semi-natural state. Development projects have often stimulated wetland conversion largely because of lack of information and ignorance of planners about wetland functions and their role in sustainable development. Conversion or degradation of such natural capital assets will therefore not represent an increase in resource-use efficiency. Social inefficiency in wetland use is connected to the fact that wetlands are multifunctional resources and are under heavy utilisation pressure. The inefficiency is not a consequence of multiple-use conflict itself, but the fact that not all uses are properly evaluated and accounted for.
India is richly endowed with wetlands. An annual average rainfall of over 130 cm, the different climatic regimes, variations in topography contribute to a diverse and wealthy wetland habitat. This is evident from the high-altitude lakes of the Himalayas; floodplain wetlands of major river systems and their extensive network of tributaries draining from the Indian landmass in all directions; saline and temporary wetlands of the arid and semi-arid expanses; inland coastal systems such as lagoons, backwaters and estuaries; mangrove swamps; marine wetlands; coral reefs associated with the island arcs, and so on. In fact, natural wetlands in India include the entire range of ecosystem types with the exception of bogs, fens and typical salt marshes. In addition, there are man-made wetlands, which number more than the natural ones. The diversity of rainfall regimes in the country has necessitated the construction of numerous large, medium and small reservoirs for irrigation, domestic water supply, electricity, fisheries, and flood control. The littoral zones of these reservoirs along with shallow ponds and numerous tanks have further added to the country's wetland wealth. It is estimated that freshwater wetlands alone account for about 20 per cent of the known range of biodiversity in India. The wetland classification system is given in the following Table 1
Table 1: Wetland Classification System
Category of Wetlands |
|
Inland Wetlands |
1.Natural
2. Man-made |
1.1 Lakes/ponds
1.2 Ox-bow lakes/cut-off meanders
1.3 Waterlogged (seasonal)
1.4 Playas
1.5 Swamp/marsh
2.1 Reservoirs
2.2 Tanks
2.3 Waterlogged
2.4 Abandoned quarries
2.5 Ash pond/ cooling pond |
Coastal Wetlands |
3. Natural
2. Man-made
|
3.1 Estuary
3.2 Lagoon
3.3 Creek
3.4 Backwater (kayal)
3.5 Bay
3.6 Tidal flat/ mud-flat
3.7 Sand/beach/spit/bar
3.8 Coral reef
3.9 Rocky coast
3.10 Mangrove forest
3.11 Salt marsh/marsh vegetation
3.12 Other vegetation
4.1 Salt pans
4.2 Aquaculture ponds
|
Source: Anon, 1994
Most of the major civilizations of the world have developed and flourished around these ecosystems. The people living around them exploit the economic, cultural and ecological resources. Although all wetlands do not provide valuable biodiversity, they may play an important role in sustaining the ecological health of the ecosystem and also the livelihood of the people dependent on them. Some of the wetlands are primarily used for food, fodder and building materials.
Top
1.1 DISTRIBUTION OF INDIA'S WETLANDS :
According to the Directory of Indian wetlands, the area occupied by these ecosystems is 58.2 million hectares. Indian wetlands are directly or indirectly dependent on the rivers like Godavari, Tapti, Ganga, Brahmaputra, Narmada, Krishna and Cauvery. They occur in the hot arid regions of Gujarat and Rajasthan, the deltaic regions of the east and west Coast, highlands of central India, wet humid zones of south peninsular India and the Andaman and Nicobar and Lakswadeep islands. Based on agro-climatic zonation, Indian wetlands are grouped as:
- Himalayan wetlands :
Ladakh and Zanskar: |
Pangong Tso, Tso Morari, Chantau, Noorichan, Chushul and Hanlay marshes |
Kashmir Valley : |
Dal, Anchar, Wular, Haigam, Malgam, Haukersar and Kranchu lakes |
Central Himalayas : |
Nainital, Bhimtal and Naukuchital |
Eastern Himalayas : |
Numerous wetlands in Sikkim , Assam , Arunachal Pradesh, Meghalaya, Nagaland and Manipur, Beels in the Brahmaputra and Barak valley |
-
Indogangetic Wetlands :
The Indo-Gangetic flood plain is the largest wetland system in India, extending from the river Indus in the west to Brahmaputra in the east. This includes the wetlands of the Himalayan terai and the Indo-Gangetic plains
- Coastal Wetlands :
The vast intertidal areas, mangroves and lagoons along the 7500 kilometer long coastline in West Bengal, Orissa, Andhra Pradesh, Tamil Nadu, Kerala, Karnataka, Goa, Maharashtra and Gujarat. Mangrove forests of the Sunderbans of West Bengal and the Andaman and Nicobar Islands. Offshore coral reefs of the Gulf of Kutch, Gulf of Mannar, Lakshwadeep and Andaman and Nicobar Islands.
- Deccan Wetlands :
Few natural wetlands, but innumerable small and large reservoirs and several water storage tanks in almost every village in the region. As per the recent estimate, there are about 44000 manmade waterbodies in Karnataka
1.2 SPATIAL SPREAD OF INDIAN WETLANDS :
Despite the key role-played by the wetlands in maintaining the overall cultural, economic and ecological health of the ecosystem, they are fast disappearing from the landscape. Only a few of the ecologically sensitive regions are protected by the Wildlife Protection Act whereas several wetlands are becoming an easy target for anthropogenic exploitation. Survey of 147 major sites across various agroclimatic zones identified the anthropogenic interference as the main cause of wetland degradation (The Directory of Indian wetlands, 1995). Current spatial spread of wetlands under various categories is listed in Table 2 and in a pie chart (Parikh .and Parikh, 1999).
Table 2: Categorywise - Spatial Spread of Wetlands
Area of Wetlands in India (in million hectares) |
|
|
Area under wet paddy cultivation |
40.9 |
Area suitable for fish culture |
3.6 |
Area under capture fisheries |
2.9 |
Mangroves |
0.4 |
Estuaries |
3.9 |
Backwaters |
3.5 |
Impoundments |
3.0 |
|
|
Total area |
58.2 |
Top
2.0 BIODIVERSITY IN FRESHWATER ECOSYSTEMS OF INDIA :
Freshwater ecosystems support a wide diversity of flora and fauna that are used for a wide range of purposes by humans. The general goal of this irreplaceable biodiversity is to minimise its loss. The first step in conservation of biodiversity is to assess the diversity of natural resources present and identify those, which are important and most irreplaceable (Groombridge and Jenkins, 1998). Awareness of the unique nature of biodiversity, the plethora of factors contributing to decline in habitat quality and species populations has been growing in the past decade.
In India, lakes, rivers and other freshwaters support a large diversity of biota representing almost all taxonomic groups. Algae in open waters represent the floristic diversity and macrophytes dominate the wetlands. It is difficult to analyse the algal diversity in India with reference to different habitats, endemicity to India, as well as the changes that occur due to anthropogenic disturbances. The total number of aquatic plant species exceeds 1200 species (Gopal., 1995). Table 3 and Table 4 list the estimated number of aquatic and wetland species of vascular plants and animals respectively (Source: Gopal, 1995).
Table 3: Estimated number of Aquatic and Wetland species of Vascular Plants
TAXA |
NO. OF SPECIES |
PTERIDOPHYTES |
Psilotaceae |
1 |
Selaginellaceae |
5 |
Azollaceae |
1 |
Equisetaceae |
3 |
Helminthostachyaceae |
1 |
Ophioglossaceae |
2 |
Isoetaceae |
10 |
Marsileaceae |
10 |
Pteridaceae (Parkeriaceae) |
2 |
Polypodiaceae |
C 50 |
Salviniaceae |
3 |
ANGIOSPERMS |
Acanthaceae |
18 |
Aizoaceae |
2 |
Alismataceae |
10 |
Amaranthaceae |
9 |
Amaryllidaceae |
3 |
Apiaceae (Umbelliferae) |
4 |
Aponogetonaceae |
8 |
Araceae |
40 |
Asclepiadaceae |
1 |
Asteraceae |
24 |
Balsaminaceae |
1 |
Boraginaceae |
5 |
Brassicaceae (Cruciferae) |
4 |
Butomaceae |
1 |
Cabombaceae |
2 |
Callitrichaceae |
3 |
Capparidaceae |
1 |
Caryophyllaceae |
1 |
Ceratophyllaceae |
3 |
Chenopodiaceae |
1 |
Commelinaceae |
17 |
Convolvulaceae |
3 |
Cyperaceae |
159 |
Droseraceae |
4 |
Elatinaceae |
4 |
Eriocaulaceae |
8 |
Fabaceae |
10 |
Gentianaceae |
2 |
Haloragaceae |
9 |
Hanguanaceae |
1 |
Hydrocharitaceae |
16 |
Hydrophyllaceae |
1 |
Juncaceae |
7 |
Juncaginaceae |
|
Lamiaceae |
5 |
Lemnaceae |
13 |
Lentibulariaceae |
38 |
Limnocharitaceae |
2 |
Lobeliceae |
|
Lythraceae |
26 |
Marantaceae |
1 |
Menyanthaceae |
3 |
Najadaceae |
6 |
Nelumbonaceae |
1 |
Nymphaeaceae |
6 |
Onagraceae |
5 |
Poaceae |
78 |
Podostemaceae |
22 |
Polygonaceae |
13 |
Pontederiaceae |
3 |
Potamagetanoceae |
7 |
Primulaceae |
1 |
Ranunculaceae |
7 |
Resedaceae |
1 |
Rosaceae |
1 |
Rubiaceae |
7 |
Saururaceae |
2 |
Scrophulariaceae |
43 |
Sparganiaceae |
2 |
Sphenocleaceae |
1 |
Sterculiaceae |
1 |
Tiliaceae |
1 |
Trapaceae |
1 |
Typhaceae |
1 |
Urticaceae |
2 |
Verbenaceae |
1 |
Zannicheliaceae |
1 |
Table 4: Estimated number of Aquatic and Wetland species in selected groups of animals.
.
Porifera |
33 |
Platyhelminthes |
20 |
Rotifera |
310 |
Gastrotricha |
21 |
Mollusca |
285 |
Annelida |
|
Oligochaeta |
100 |
Hirudinea |
40 |
Arthropoda |
|
Crustacea |
|
Conchostraca |
33 |
Cladocera |
109 |
Ostracoda |
120 |
Copepoda |
540 |
Isopoda |
200 |
Insecta |
|
Ephemeroptera |
94 |
Odonata |
491 |
Plecoptera |
113 |
Hemiptera |
200 |
Coleoptera |
C 600 |
Diptera |
C 5000 |
Trichoptera |
812 |
Chordata |
|
Pisces |
742 |
Amphibia |
204 |
Reptilia |
C 30 |
Aves |
C 1000 |
2.1 DIVERSITY OF FISH IN INDIA:
The Indian fish fauna is divided into two classes, viz., Chondrichthyes and Osteichthyes. The Chondrichthyes are represented by 131 species under 67 genera, 28 families and 10 orders in the Indian region (Kar et.al, 2000). The Indian Osteichthyes are represented by 2,415 species belonging to 902 genera, 226 families and 30 orders, of which, five families, notably the family Parapsilorhynchidae are endemic to India. These small hillstream fishes include a single genus, viz., Parapsilorhynchus which contains 3 species. They occur in the Western Ghats, Satpura mountains and the Bailadila range in Madhya Pradesh only. Further, the fishes of the family Psilorhynchidae with the only genus Psilorhynchus are also endemic to the Indian region. Other fishes endemic to India include the genus Olytra and species Horaichthys setnai belonging to the families Olyridae and Horaichthyidae respectively. The latter occur from the Gulf of Kutch to Trivandrum coast. The endemic fish families form 2.21 per cent of the total bony fish families of the Indian region. 223 endemic fish species are found in India, representing 8.75 per cent of the total fish species known from the Indian region and 128 monotypic genera of fishes found in India, representing 13.20 per cent of the genera of fishes known from the Indian region.
About 22000 species of fishes have been recorded in the world; of which, about 11% are found in Indian waters. Out of the 2200 species so far listed, 73 (3.32%) belong to the cold freshwater regime, 544 (24.73%) to the warm fresh waters domain, 143 (6.50%) to the brackish waters and 1440 (65.45%) to the marine ecosystem. Adequate protection of ecosystems is a necessary requirement for survival of all species and proper care is needed to overcome anthropogenic stresses. In the case of commercial species, rational exploitation is a pre-requisite for sustainability of the resources.
There are about 450 families of freshwater fishes globally. Roughly 40 are represented in India (warm freshwater species). About 25 of these families contain commercially important species. Number of endemic species in warm water is about 544. Major warm water species are: Bagarius bagarius, Catla catla, Channa marulius, C. punctatus, C. striatus, Cirrhinus mrigala, Clarias batrachus, Heteropneustes fossilis, Labeo bata, L.calbasu, L. rohita, Aorichthys seenghala, Notopterus chitala, N. notopterus, Pangasius pangasius, Rita rita and Wallago attu
Cyprinids (family: Cyprinidae), Live fish (family: Anabantidae, Clariidae, Channidae, Heteropneustidae), Cat fish (family: Bagridae, Silurdae, Schilbeidae), Clupeids (family: Clupeidae), Mullets (family: Mugilidae), featherbacks (family: Notopteridae), Loaches (family: Cobitidae), Eels (family: Mastacembelidae), Glass fishes (family: Chandidae) and Gobies (family: Gobiidae) are the major groups of fresh water fishes found in India
Cyprinidae is one of the largest families and is well represented in India with species ranging from few millimeters in length (minnows) to more than a metre (major carps). Among the 544 freshwater fish species in India, Cyprinidae accounts for nearly 24.12%.
Many of the Cyprinids, especially carps, are widely captured and form the mainstay of culture operations. Depending on their growth and utility in culture systems, the carps are grouped as major carps (Catla catla, Cirrhinus mrigala, Labeo calbasu, Labeo rohita) and minor carps (L. fimbriatus, L. bata, C. cirrhosus, C. reba). A few exotic carps, as indicated below, have also been introduced into the country mainly for culture purposes (Hypopthalmichthys molitrix, Ctenopharyngodon idella, Cyprinus carpio). The mahseers are also included in cyprinidae. Though many species of the genus Tor are found in the high altitude cold waters, some species like Tor khudree and Tor putitora occur in warmer waters. The genus Tor thus reveals a wide range of species diversity as regards adaptation to different ecological conditions. There is a serious decline of mahseer fishery in different ecosystems endangering its very existence, thus warranting adequate conservation of the fishes. Threatened and endangered fish species are listed in the Annexure.
Top
3.0 WETLAND LOSSES:
The current loss rates in India can lead to serious consequences, where 74% of the human population is rural (World Development Report, 1994) and many of these people are resource dependent. Healthy wetlands are essential in India for sustainable food production and potable water availability for humans and livestock. They are also necessary for the continued existence of India's diverse populations of wildlife and plant species; a large number of endemic species are wetland dependent. Most problems pertaining to India's wetlands are related to human population. India contains 16% of the worlds population, and yet constitutes only 2.42% of the earth's surface. Indian landscape has contained fewer and fewer natural wetlands over time. Restoration of these converted wetlands is quite difficult once these sites are occupied for non-wetland uses. Hence, the demand for wetland products (e.g., water, fish, wood, fibre, medicinal plants etc.) will increase with increase in population. Wetland loss refers to physical loss in the spatial extent or loss in the wetland function. The loss of one km2 of wetlands in India will have much greater impact than the loss of one km2 of wetlands in low population areas of abundant wetlands (Foote et al, 1996). The wetland loss in India can be divided into two broad groups namely acute and chronic losses. The filling up of wet areas with soil constitutes acute loss whereas the gradual elimination of forest cover with subsequent erosion and sedimentation of the wetlands over many decades is termed as chronic loss.
3.1 ACUTE WETLAND LOSSES:
- Agricultural Conversion:
In the Indian subcontinent due to rice culture, there has been a loss in the spatial extent of wetlands. Rice-farming is a wetland dependent activity and is developed in riparian zones, river deltas and savannah areas. Due to captured precipitation for fish-pond aquaculture in the catchment areas and rice-farms occupying areas that are not wetlands, water is deprived to the downstream natural wetlands. Around 1.6 million hectares of freshwater are covered by freshwater fish-ponds in India. Rice-fields and fish-ponds come under wetlands, but they rarely function like natural wetlands. Of the estimated 58.2 million hectares of wetlands in India, 40.9 million hectares are under rice cultivation (Anon, 1993). The Gangetic plains support intense cultivation of rice but they lack many of the other wetland functions such as flood-buffering capacities, water-quality enhancement, sediment trapping, sewage filtration, wildlife habitat etc. Coastal wetlands such as mangroves have been converted to salt evaporation ponds in the coastal regions of Karnataka, Gujarat and Tamil Nadu. Salt ponds greatly alter the natural biota, the losses being reduced tidal energy and export of detritus to ocean near-shore areas. In natural systems, the flow of detritus and soluble soil nutrients initiates a food-chain where microscopic organisms thrive, shrimps and crabs feed on detritus and microorganisms, fish forage on the shellfish and birds, and wild mammals and humans feed on the fish and shellfish. The blocking of such a flow in the food chain affects the ecology of the estuary (Savenije and Pages, 1992).
- Direct deforestation in wetlands:
Mangrove vegetation are composed of flood and salt tolerant species and grow along the coasts and are valued for fish and shellfish, livestock fodder, fuel wood, building materials, local medicine, honey, bees wax and for extracting chemicals for tanning leather (Ahmad, 1980). Alternative farming methods and fisheries production has replaced many mangrove areas and continues to pose threats. Eighty percent of India's 4240 km2 of mangrove forests occur in the Sunderbans and the Andaman and Nicobar Islands (Government of India, 1991). But most of the coastal mangroves are under severe pressure due to the economic demand on shrimps. Important ecosystem functions such as buffer zones against storm surges, nursery grounds and escape cover for commercially important fishery are lost. The shrimp farms also caused excessive withdrawal of freshwater and increased pollution load on water like increased lime, organic wastes, pesticides, chemicals and disease causing organisms. The greatest impacts were on the people directly dependent on the mangroves for natural materials, fish proteins and revenue. The ability of wetlands to trap sediments and slow water is reduced. The ecological linkages between land alterations and the downstream effects on wetlands, lakes and fisheries are apparent.
- Hydrologic alteration:
Alteration in the hydrology can change the character, functions, values and the appearance of wetlands. The changes in hydrology include either the removal of water from wetlands or raising the land-surface elevation, such that it no longer floods. Canal dredging operations have been conducted in India from 1800s due to which 3044 km2 of irrigated land has increased to 4550 km2 in 1990 (Anon 1994). Initial increase in the crop productivity has given way for reduced fertility and salt accumulations in soil due to irrigated farming of arid soils. India has 32,000 ha of peat-land remaining and drainage of these lands will lead to rapid subsidence of soil surface.
- Inundation by dammed reservoirs:
Presently, there are more than 1550 large reservoirs covering more than 1.45 million ha and more than 100000 small and medium reservoirs covering 1.1 million ha in India (Gopal, 1994). By impounding the water, the hydrology of an area is significantly altered and allows for harnessing moving water as a source of energy. While the benefits of energy are well recognized, it also alters the ecosystem. For e.g. the Narmada basin development involves planned construction of 150 large dams and over 3000 small tributary dams over the next 40 years, it is the largest comprehensive water project in the world and most controversial. But the riparian wetlands and substantial amounts of forest and agricultural land would be inundated and lost for productive use thereby affecting the wetland flora and wildlife.
3.2 CHRONIC WETLAND LOSSES:
- Alteration of upper watersheds:
Watershed conditions influence the wetlands. The condition of the land where precipitation falls, collects and runs-off into the soil will influence the character and hydrologic regime of the downstream wetlands. When agriculture, deforestation or overgrazing removes the water-holding capacity of the soil then soil erosion becomes more pronounced. Large areas of India's watershed area are being physically stripped of their vegetation for human use. The demand for fuelwood alone is enormous; in the year 2000, India consumed around 160 million tonnes of firewood averaging 0.7 tonnes per person per year. Due to clearing of trees, the characteristic of the catchment is changed such that wetlands downstream are affected due to soil erosion and sedimentation.
- Degradation of water quality:
Water quality is directly proportional to human population and its various activities. More than 50,000 small and large lakes are polluted to the point of being considered 'dead' (Chopra, 1985). The major polluting factors are sewage, industrial pollution and agricultural runoff, which may contain pesticides, fertilisers and herbicides. For e.g., Dal lake in Kashmir due to pollution has become unsuitable for drinking, fisheries or bathing (Bhargava, 1994).
- Ground water depletion:
Draining of wetlands has depleted the ground water sources. Recent estimate indicates that in rural India, about 6000 villages are without a source for drinking water due to the rapid depletion of ground water.
- Introduced species and extinction of native biota:
Wetlands in India support around 2400 species and subspecies of birds. But losses in habitat have threatened the diversity of these ecosystems (Mitchell and Gopal, 1990). Introduced exotic species like water hyacinth (Eichornia crassipes) and salvinia (Salvinia molesta) have threatened the wetlands and clogged the waterways competing with the native vegetation.
Due to many anthropogenic activities India supports few important wetlands. There are 170 wetlands covering an area of 580000 km2 (Anon, 1993), of which 45% of all wetlands are considered to be moderately to highly threatened
Top
4. SPATIAL AND TEMPORAL TOOLS FOR SUSTAINABLE MANAGEMENT OF WETLANDS:
Spatial and temporal tools such as remote sensing data in conjunction with Geographic Information System (GIS) are effective for water resources development and management. The application encompasses water resource assessment, hydrologic modeling, flood management, reservoir capacity surveys, assessment and monitoring of the environmental impacts of water resources project and water quality mapping and monitoring (Saindranath Jonna, 1999).
Remote sensing data provides information on the flood-inundated regions, delineation of the flood-risk zones and the status of flood control works, which are vital for effective flood management. The WiFS data from the IRS 1C/D encompassing 810 km and high temporal repetitiveness has helped in the zonation of flooding areas of large river bodies, thus helping in the preparation of state-wise and basin wise flood inventories.
The improving spatial, spectral and temporal resolution of Indian Remote Sensing satellites has contributed towards irrigation management extending from inventorying to subsequent monitoring and management. The IRS-1A and 1B has helped in the development of methodologies for inventorying irrigation systems in regard to area irrigated, cropping pattern, condition and productivity and salinity/water logging. Remote sensing has been used not only for inventorying but also for cropping pattern, crop production and condition, monitoring irrigation status and in the diagnosis of poorly performing irrigation patterns. Satellite inventory of tank irrigation would cover census of functional tanks with recognised water impoundment and watershed area, silting during post monsoon and reduction in the water-spread area and irrigated area, and treatment of degraded tanks for soil conservation. In addition, the satellite remote sensing techniques provide valuable inputs on monitoring and evaluation of water resources project.
The conservation of water and land resources depends on proper planning of the watershed and its characterisation. Watershed characterisation involves measurement of physiography, drainage pattern, geo-morphological, hydrological, land cover/land use, soil survey and assessment of its suitability for appropriate developmental activity. Satellite data in association with the geographical information systems provides a cost and time-effective tool for identification, mapping, inventorying and monitoring physical resources of the watershed which combined with information on the socio-economic needs of the watershed can help in the implementation of developmental activities.
Usually, surface water quality is assessed using various traditional limnological methods, which is time consuming. But remote-sensing data paves way for economic methodology for assessing water quality and productivity in surface impoundment. The useful indicators include suspended materials visible to the human eye, which include suspended inorganic material, phytoplankton, organic detritus and dyes
Many studies have been undertaken to examine the relationship between reflectance, suspended solid concentration, and chlorophyll-a concentration. The atmospheric reflectance of water-bodies in the near infrared wavelength range depends on the amount of suspended solids content i.e. as the concentration of suspended solids increases so does the reflectance.
Remote sensing data is used for the analysis of water quality parameters and modeling. The relationship between different water quality parameters and the information from remote sensing data have been analysed and a good correlation between observed and simulated values are seen. Due to accuracy and repetitiveness, satellite data can provide information on the source of pollution and the point of discharge. Water bodies polluted due to industries or the inflow of sewage can be regularly monitored using multi-date satellite data.
In remote sensing, data/information is collected in discrete spectral intervals or spectral bands (an interval in the electromagnetic spectrum defined by two wavelengths or frequencies depending on the reflective/ emittive properties of the chosen application area). The following Table 5 gives information for management of aquatic ecosystems using remote sensing (Garg 1995, unpublished).
Table 5:Aquatic ecosystems: Assessment and Monitoring Needs
|
Parameter (s) |
Spatial Resolution (m) |
Radiometric Resolution (bits) |
Spectral region / Bands ( m m) |
A
|
Wetlands Aerial extent, type, dynamics, avifauna suitability
Hydrophytic vegetation/weed infestation, type, trophic status, eutrophicaton
|
10-20
5-20
|
8
8
|
0.42-0.52,
0.53-0.59,
0.63-0.69,
0.77-0.86
0.53-059
0.63-0.69
0.77-0.86
1.55-1.75 / 2.08-2.15
|
B |
Pollution Pollution sources/waste outfall
Turbidity, Sediments and suspended solids
Phytoplankton / algal blooms
Thermal Pollution
Oil Pollution
Water pollutants and biophysical parameters (BOD, COD, DOETC)
|
1-5
30
30-50
5-10
0.5 ° C
50-100 |
8
8
8-10
8-10
10
|
0.53-0.59
0.77-0.86
3.66-3.84
3.93-3.98
10.78-11.28
11.77-12.27
0.56-0.58
0.64-0. 0.66
0.74-0.78
0.510-0.530
0.555-0.575
0.620-0.640
0.660-0.670
3.66-3.84
3.93-3.98
10.78-11.28
11.77-12.27
Sar X (9.6 Ghz)
Lidar (0.35-0.75 m m)
Sensors yet be developed
|
The changes in the river course of Ganga - Padma river over space and time to delineate the vulnerable zones for environment management were attempted by Hazra and Bhattacharya (1999). In this connection, various geomorphological and geological features have been delineated using visual interpretation techniques. The results indicate the river will shift along its course due to natural calamity and in some places due to anthropogenic interferences.
Microwave remote sensing offers the best tool for delineation of shallow buried courses because of its sensitivity to moisture and penetration capabilities in arid regions. Satellite remote sensing also helps in displaying anomalies in the terrain that are caused due to the pattern of vegetation/water bodies, sand-dunes, lithology, drainage courses, salt lakes, topography and slopes, natural breaks etc. which help in creating a conceptualised model of the extinct river-course. Hence it proves an effective tool for the study of the course of ancient Saraswati (Sharma et.al., 1999) more than any other method.
Geographic Information System was used to develop a decision support system for farm level planning in Annur sub-watershed of the Kallar sub-catchment of Coimbatore district, Tamil Nadu (Sivaswamy et.al., 1999). Thematic maps on the soil depth, soil texture, slope, soil erosion, present land-use and distribution of wells were generated. These maps were integrated to decide on the suitability of the land for agriculture, agro-horticulture and agroforestry. Land-use options for the Annur sub-watershed showed that 33.9% of the area was suitable for intensive agriculture.
GIS and remote sensing was used for the development of water resources in Sai-Gad sub-watershed of Almora District, Uttar Pradesh (Mohan et.al., 1999). Various thematic maps on the hydrogeomorphological characteristics, elevation, slope, drainage, surface water bodies and land-use have been generated and integrated for the action plan for Water Resources Development.
For the evaluation of hydrogeochemical conditions of Niva river basin, Chittoor district in Andhra Pradesh. Drainage maps of the basin were prepared and the imagery data were interpreted using standard interpretation keys such as colour, tone, texture, and pattern of drainage, shape and topography. The results revealed that the underground potential of the basin is moderate to good (Rao et al, 1997).
The study of drainage pattern can be made either through toposheets, aerial photographs or satellite images. Out of these, satellite images provide a synoptic view over a large area exhibiting a comprehensive means of mapping and study of drainage in relation to basin morphology, surface morphology and underlying geology. The drainage pattern of Jharia coalfield, Bihar, India as observed on IRS-1A LISS II image shows that the region is drained by 11 streams which eventually drain into river Damodar (Srivastava, 1997).
Identification of hydrogeomorphic units is prerequisite to undertaking ground water exploration and development in any terrain. Use of satellite remote sensing data coupled with aerial photo-interpretation greatly aid in planning ground water exploration and help in locating the sources. Air-borne and space-borne data were used for the qualitative evaluation of ground water resources in Keonjhar district, Orissa (Das et al 1997). The study revealed the importance of hydrogeomorphological mapping from remotely sensed data in groundwater targeting in the structurally complex terrain of the district. Resistivity soundings and exploratory digging further corroborated the study
Remote sensing, geophysical, DBTM (Digital Basement Terrain Model) and GIS (Geographic Information System) were used for sustainable utilisation of water resources of Alaunja watershed, located in Chotanagpur plateau of Bihar (Ashok Kumar, 1999). The study helped in the prioritisation of water resource development in the watershed i.e., delineation of the area suitable for groundwater/surface water utilisation.
With the development of highly precise remote sensing techniques in spatial resolution and GIS, the modeling of watershed has become more physically based and distributed to enumerate interactive hydrological processes considering spatial heterogeneity. A distributed model with SCS curve number method called as Land Use Change (LuC) model was developed (Mohan and Shresta, 2000) to assess the hydrological changes due to land use modification. The model developed was applied to Bagmati river catchment in Kathmandu valley basin, Nepal. The study clearly demonstrated that integration of remote sensing, GIS and spatially distributed model provides a powerful tool for assessment of the hydrological changes due to land-use modifications.
4.1 IMPACT OF SPATIAL AND SPECTRAL RESOLUTION ON QUANTITY AND QUALITY OF WETLAND ECOSYSTEM:
Hydrology is the key to the wetland health and species zonation. Mounting human-induced and natural pressures make it critical to develop techniques that monitor wetland responses to hydrologic changes. Remotely sensed images provide an instantaneous and synoptic view necessary for accurate mapping of changes. Aerial photography and optical imagery from satellite sensors offer synoptic coverage and aid in determining various factors related to wetlands (such as a predominately hydric soil that is saturated or covered with water and supports, predominately vegetation adapted for life in these conditions), but are constrained by the restricted penetration of visible and near-infrared radiation into vegetative canopies and by favourable weather and daylight (cloud cover and atmospheric haze). However, the radar imaging systems overcome many of these limitations by providing increased canopy penetrations and day and night acquisitions nearly independent of weather conditions (Ramsey III, 1995; Ramsey III and Laine, 1997).
Numerous studies have shown that remote sensing techniques provide reliable and objective primary data on agricultural productivity, bioresource status and secondary data on related water management aspects to help better management. Cost and time effectiveness are some of the advantages of using remote sensing data and integrating several other data systems using G.I.S for taking rapid management decisions.
Studies that used multispectral imaging system onboard the early Landsat satellites had limited success in mapping expansive and homogeneous inland wetlands and coastal marshes (Weismiller et al., 1977; Klemas et al., 1980). The Landsat MSS sensor declined when the Landsat Thematic mapper (TM) sensor with improved spectral and spatial resolutions became available. Later the launch of SPOT XMS, IRS and panchromatic sensors provided improved spatial resolutions, but a limited number of spectral bandwidths than the TM sensors (Klemas et al., 1993). The successful attempts by many organisations and agencies in the 90's helped develop wetland classes including a coastal land cover classification. IRS 1C, with a unique combination of payloads and capabilities and the resultant application material helped in this regard.
The general distribution of wetlands is well known and in many cases only a binomial classification of wetland loss and gain provided on regional basis is required. Even with a simple binomial classification scheme, problems can be acute in complex marsh systems exhibiting extremely convoluted and heterogeneous landscapes. In these cases, problems with the MSS (Multi Spectral Sensors) spatial resolution hamper the generation of a binomial land and water mask. A further complication is the limited availability of cloud free imagery in tropical and subtropical areas. Plant phenology and flood conditions complicate the ability to discern marsh change by using the spectral reflectance of wetland features. This is particularly acute with seasonally or diurnally ephemeral features, such as the presence or absence of floating flora, the flooding and exposure of tides and the raising and lowering of water levels under the wetland canopy. Radar images can alleviate problems of cloud contamination, but land and water delineation can be problematic due to the possibility of high radar returns from inland water areas experiencing wind roughening
Top
5. WETLAND PROTECTION LAWS AND GOVERNMENT INITIATIVES:
Wetlands are not delineated under any specific administrative jurisdiction. The primary responsibility for the management of these ecosystems is in the hands of the Ministry of Environment and Forests. Although some wetlands are protected after the formulation of the Wildlife Protection Act, the others are in grave danger of extinction. Effective coordination between the different ministries, energy, industry, fisheries revenue, agriculture, transport and water resources, is essential for the protection of these ecosystems.
Wetlands in India are indirectly protected by an array of laws given below (Parikh. J and Parikh K., 1999):
- The Indian Fisheries Act - 1857
- The Indian Forest Act - 1927
- Wildlife (Protection) Act - 1972
- Water (Prevention and Control of Pollution) Act - 1974
- Territorial Water, Continental Shelf, Exclusive Economic Zone and other Marine Zones Act - 1976
- Water (Prevention and Control of Pollution) Act - 1977
- Maritime Zone of India (Regulation and fishing by foreign vessels) Act - 1980
- Forest (Conservation act) - 1980
- Environmental (Protection) Act - 1986
- Coastal Zone Regulation Notification - 1991
- Wildlife (Protection) Amendment Act - 1991
- National Conservation Strategy and Policy Statement on Environment and Development - 1992
In addition to the above laws, India is a signatory to the Ramsar Convention on Wetlands and the Convention of Biological Diversity. According to these formulations India is expected to conserve the ecological character of these ecosystems along with the biodiversity of the flora and fauna associated with these ecosystems. Despite these, there is no significant development towards sustaining these ecosystems due to the lack of awareness of the values of these ecosystems among the policymakers and implementation agencies. The effective management of these wetlands requires a thorough appraisal of the existing laws, institutions and practices. The involvement of various people from different sectors is essential in the sustainable management of these wetlands.
Apart from government regulation, development of better monitoring methods is needed to increase the knowledge of the physical and biological characteristics of each wetland resources, and to gain, from this knowledge, a better understanding of wetland dynamics and their controlling processes. Discussions based on accurate knowledge and increased awareness of wetland issues can then begin to develop management strategies (to protect, restore and/or mitigate) that account for the function and value of all wetland resources in the face of natural and socioeconomic factors, while continuing to satisfy critical resource needs of the human population.
Top
6. RESTORATION OF LAKES:
Sectoral approaches adopted in regional planning has led to breakdown of lake-watershed systems, which expediate agricultural phosphorus flows, draining and development of wetlands, dislodging of riparian vegetation, overfishing and spread of exotic species. Restoration means reestablishment of this ecosystem to a close proximity of its condition prior to its agitation or perturbation. Restoration is a technique or method used to improve the quality of water and its catchment conditions in order to make the wetland resources suitable for sustainable use. The goals for any restoration program should be realistic and tailored to individual regions, specific to the problems of degradation and based on the level of dependence. For lakes, resilient restoration program should include all aspects of the ecosystems, including habitat restoration, reduction of phosphorus imports to farms, elimination of annoying species, reduced harvests of fish and restoration of native species from the ecosystem outlook with holistic approach designed at watershed level, rather than isolated manipulation of individual elements. This often requires revision of the physical conditions, chemical regulation of the soil and water, biological manipulation, reintroduction of native flora and fauna etc.
The preliminary step that has to be implemented in restoring lake for their long-term sustenance includes:
- Pollution impediment:
Waste water, solid and semi solid wastes entering in to the lake from external sources must be stopped before any restoration work is implemented.
- Harvesting of Macrophytes:
Water hyacinth and other nuisance vegetation present in the lake must be removed manually or mechanically, which is the cause for eutrophication. Weed infestation can also be controlled by applying chemicals like methyl-chlora-phenoxy-acetic acid, hexazinore, etc., and biological control by means of introducing Pila globosa (trophical snail), Chinese grass carp (fast growing fish) and Manatee (sea-cow) that feeds on many aquatic plants.
- Draining the water:
The water present in the lake must be cleaned or drained completely.
- Desiltation:
Dredging of the sediments in the lake to improve the soil permeability, water holding capacity and ground water recharge
On the basis of priority based on the severity of their problems, the other restoration methods are as follows:
6.1 INTERVENTION IN THE LAKE ECOSYSTEM :
- Aeration of lake water:
It is desirable to oxygenate the entire lake (from top to bottom) for several reasons. The oxygen concentration in the lake water influences all living organisms in the lake. Oxygen depletion occurs in the hypolimnion due to decomposition of organic matter. In an oxygenated environment the sulfur-reducing anaerobes are killed, and the source of hydrogen sulfide and sulfuric acid is removed. Oxygenation also deactivates benthic anaerobes that produce ammonia. As oxygen levels in the bottom water increase, facultative (low oxygen) microorganisms convert nitric acid to inert nitrogen gas and the end products are nitrogen gas, carbon dioxide and water.
- Aeration of sediment:
Sediments play a major role in the nutrient cycles in lakes. The nutrients are accumulated here and under aerobic conditions the sediment is able to bind to substantial amounts of phosphorus while, on the other hand, anaerobic sediment will release a significant part of this phosphorus. Aerobic sediment will fix phosphorus as iron (III) phosphates and contains precipitated iron (III) hydroxide, which has a high phosphorus adsorption capacity. Under anaerobic conditions the iron (III) is reduced to iron (II) and the phosphorus released. Hence aeration of sediment method could be introduced in order to reduce this problem.
6.2 REDUCTION IN THE EXTERNAL LOADING :
A reduction of the external loading can be carried out either by elimination of the total wastewater input to the lake or by use of wastewater treatment method like screening, grit chamber, chemical precipitation and activated sludge process etc.
As an extension of the restoration programme, watershed management practices are essential for proper land use, protecting land against all forms of deterioration, conserving water for farm use, proper management of local water for drainage, flood protection and sediment reduction and increasing productivity from all land uses. Key steps for best management practices include
• Pollution alleviation practices might be applied to reduce the non-point source of pollution (mainly agricultural and storm runoff) through source reduction, waste minimisation and process control.
• Afforestation with native species in desolate areas around the wetland to control the entry of silt from run off.
• The shorelines of the lakes, lined with bricks or stones in an attempt to control shoreline erosion.
• Constructed wetlands are recommended for the purpose of stormwater management and pollutant removal from the surface water flows.
• Infiltration trenches would be useful in reducing the storm water sediment loads to downstream areas by temporarily storing the runoff.
• Extended detention dry basins are to be provided in removing pollutants primarily through the settling of suspended solids.
• On soils with a tendency to crust, management options include planting seeds at shallow depths, protecting the soil surface with mulch or crop residues, maintaining a rough soil surface by not over-tilling seed-beds, keeping the soil surface moist until seedlings emerge, selecting crops such as corn that are able to exert pressure during emergence, planting two to four seeds together to increase the pressure they exert during germination, and using transplants rather than seeds.
• Gyration of crops rather than monocultures to reduce the need for N and assist with pest control and help in aeration of soil.
• Promoting public education programs regarding proper use and disposal of agricultural hazardous waste materials and regular monitoring of lakes are rudimentary.
The restoration programs with an ecosystem approach through Best Management Practices (BMPs) helps in correcting point and non-point sources of pollution. This along with regulations and planning for wildlife habitat and fishes helps in arresting the declining water quality and the rate in loss of wetlands. These restoration goals require profound planning, authority and funding along with the financial resources and active involvement from all levels of organisation (Governmental and Non-Governmental Organisations (NGOs), research organisations, media, etc.) through interagency and intergovernmental processes all made favourable in innovating and inaugurating the restoration programs. Network of educational institutions, researchers, NGO's and the local people are suggested to help restore our fast perishing wetland ecosystem and conserve those at the verge of extinction by formulating viable plans, policies and management strategies.
Restoration goals, objectives, performance indicators (indicates the revival or success of restoration project), monitoring, and assessment program should be viably planned so that project designers, planners, biologists, and evaluators have a clear understanding. Monitoring of restoration endeavors should include both structural (state) and functional (process) attributes. Monitoring of attributes at population, community, ecosystem, and landscape level is appropriate in this regard.
Restoration strategy developed in collaboration with the government, researchers, stakeholders at all levels, and NGO's should
- Set principles for establishing priorities and decision making.
- Prioritize goals, assessment, and monitoring strategies based on specific roles they perform, level of dependency and type of problems faced by them.
- Foster innovative financing and use of land and water programs for better and sustainable usage of wetland resources.
It is important to give priority to repairing those systems that would become extinct without any intervention. Prioritizing systems for repair requires that a framework be developed categorizing the level of interventions. These categories should be based on:
- Wetlands that could recover without any intervention.
- Wetlands that could be restored close to their former condition to serve their earlier functions, considering cost involved, technical review of the restoration plan, and based on the goals and objectives set.
- Wetlands that are not restorable to any agreeable viably.
Top
7. NATIONAL WETLAND STRATEGY:
National wetland strategy should encompass (i) Conservation and collaborative management, (ii) Prevention of loss and restoration and (iii) Sustainable management. These include
• Protection: The primary necessity today is to protect the existing wetlands. Of the many wetlands in India only around 68 wetlands are protected. But there are thousands of other wetlands that are biologically and economically important but have no legal status.
• Planning, Managing and Monitoring: Wetlands that come under the Protected area network have management plans but others do not. It is important for various stakeholders along with the local community and corporate sector to come together for an effective management plan. Active monitoring of these wetland systems over a period of time is essential.
• Comprehensive Inventory: There has been no comprehensive inventory of all the Indian wetlands despite the efforts by the Ministry of Environment and Forests, Asian Wetland Bureau and World Wide Fund for Nature. The inventory should involve the flora, fauna, and biodiversity along with values. It should take into account the various stakeholders in the community too.
• Legislation: Although several laws protect wetlands there is no special legislation pertaining specially to these ecosystems. Environment Impact Assessment needed for major development projects highlighting threats to wetlands need to be formulated.
• Coordinated Approach: Since wetlands are common property with multi-purpose utility, their protection and management also need to be a common responsibility. An appropriate forum for resolving the conflict on wetland issues has to be set up. It is important for the ministries to allocate sufficient funds towards the conservation of these ecosystems.
• Research: There is a necessity for research in the formulation of national strategy to understand the dynamics of these ecosystems. This could be useful for the planners to formulate strategies for the mitigation of pollution. The scientific knowledge will help the planners in understanding the economic values and benefits, which in turn will help in setting priorities and focusing on the planning process.
• Building Awareness: For achieving any sustainable success in the protection of these wetlands, awareness among the general public, educational and corporate institutions must be created. The policy makers, at various levels along with site managers need to be educated. As the country's wetlands are shared, the bi-lateral cooperation in the resource management needs to be enhanced.
Top
Karnataka State is located between 11°31 and 18°45 north latitudes and 74°12 and 78°40 east longitudes. It extends from north to south for about 750 km and from east to west for about 400 km. It is bound on the west by Arabian Sea, northeast by Goa, north by Maharashtra, east by Andhra Pradesh, south and south-east by Tamil Nadu and south-west by Kerala. The Karnataka state covers an area of 1,92,204 sq.km, which covers 5.35% of the total geographical area of the country. There are twenty districts in the state, of which, Bijapur district covers the largest area and Coorg district the smallest area (Karnataka State Gazetteer (Part 1) 1991).
8.1 PHYSIOGRAPHY AND DRAINAGE:
Karnataka is divided into four regions namely coastal plain, Malnad, southern maidan and northern maidan. It has a coastline of 320 km. The Malnad overlaps into the ghats. It is rugged with a number of hills that receive large amount of rainfall and is densely forested. The deep gorges, waterfalls, rivers and watersheds interlaced with dense evergreen and semi evergreen forests constitute the core of the Malnad. The southern maidan is marked by undulating landscape, relatively flat surface with broad-based valleys. The southern upland consists of series of rolling granite hills and high degree of slopes. Karnataka is blessed with abundant water resources in the form of rivers and streams. The Western Ghats stretching north-south give rise to west flowing and east flowing river systems.
The rivers of the coastal belt are west flowing, important among them being Nethravathi, Sharavathi, Aghnashini, Gangavali and the Kali. They have their source in the Western ghats and flow into the Arabian sea. The northern maidan is drained by the Krishna and its tributaries - Ghataprabha, Malaprabha, Bhima and Tungabhadra. The southern maidan is drained by the Cauvery and its tributaries like Harangi, Hemavathi, Yagachi, north Pennar, Pennar and south Pennar. All these rivers flow eastwards and drain into the Bay of Bengal.
• Soils: Karnataka has a variety of soil types, which depend on the geology, climate, vegetation and physiography, which has influenced various soil formation over the years. The soils have distinct morphological and physicochemical properties that have a bearing on plant growth and have influenced the cropping pattern. The soil groups of the state are: a) Shallow black soils, b) Medium black soils, c) Deep black soils, d) Red loamy soils, g) Lateritic soils, h) Lateritic gravelly soils and i) Coastal alluvial soils.
• Rainfall: Karnataka receives rainfall from the two monsoons. The southwest monsoon is the major source of rainfall to the state. The average rainfall in the state is 890mm. The lowest rainfall was recorded in the district of Dharwad with 6.9 mm and the highest in the district of Uttara Kannada with 2764 mm.
• Humidity: The average relative humidity is highest in the state during July-August and lowest in March-April. The humidity is also dependent on the temperature. The coastal areas, Ghats and Malnad areas are more humid than the maidan areas. The southern part of the maidan area is more humid than the northern part. The lowest relative humidity of 30% in the months of April - May is found in areas extending from northern Chitradurga and Bellary districts to Bijapur, Raichur and Gulbarga districts. Even in southern maidan low humidity of 10-20% can be recorded in March-April. High relative humidity of 90% occurs over the coastal area, Ghats and maidan areas and 60-80% over the rest of the state. From September onwards, humidity generally decreases up to November and more rapidly after that.
• Temperature: The temperature is lowest in the month of January and increases thereafter. In the southern maidan region, the highest temperature occurs in April, while in the northern maidan and coastal regions the hottest month is May. In January, the mean daily maximum temperature is 31 to 32 ° C in the coastal areas. In the rest of the state, the mean daily maximum temperature varies from 27 to 29 ° C. In the Ghat regions, it is 24 - 27 ° C. In April the mean daily maximum temperature is about 32 ° C in coastal region and increases north-eastwards in northern maidan area to 40 ° C in Gulbarga- Raichur region and decreases to about 37 ° C in Bidar area. In the remaining maidan area, it varies from 33 - 36 ° C. Over the ghats and Malnad area, it is about 28 to 32 ° C.
• Agriculture: Karnataka has a large area under cultivation. Out of the total area of 190.50 lakh hectares, 121.27 lakh hectares is cultivable. Agriculture in Karnataka to a large extent depends on rainfall, only a small percentage is irrigated. The major crops include paddy, jowar, ragi, maize, bajra, wheat and pulses. The state stands fifth in oilseed production. It has the largest area under coffee (39.2%) cultivation and other crops include cardamom, arecanut, sunflower, coconut, cashewnut, cotton, groundnut, chillies, castor seed, sugarcane and tobacco. Around 4.57 lakh hectares are under fishery production.
• Irrigation and Power: Karnataka has the basins of Krishna (58.9%), Cauvery (18.8%), Godavari (2.31%), North Pennar (3.62%), South Pennar (1.96%), Palar (1.55%) and west flowing rivers (12.8%) with a drainage area of 1,91, 770 sq. km. The irrigation potential of the state from all the sources has been estimated as 60 lakh hectares consisting of 35 lakh hectares under major and medium irrigation, 15 lakh hectares under minor irrigation (surface) project and 10 lakh hectares under ground water. The important power projects are the Kalinadi stage I & II, Varahi, Gerusoppa (Sharavathi) and Shivasamudram hydroelectric projects.
8.2 DISTRIBUTION OF WETLANDS IN KARNATAKA:
Of the total geographical area wetlands cover 2.72 Mha, out of which the inland wetlands cover 2.54 Mha and coastal wetlands 0.18 Mha. The 682 wetlands in the State come under inland-natural (7), inland man-made (615), coastal-natural (56) and coastal man-made (4) (Rege et.al., 1996).
8.2.1 CATEGORYWISE DISTRIBUTION OF WETLANDS:
Inland wetlands dominate in Karnataka, which account for 93.44% while coastal wetlands account for 6.56%. Out of the 682 wetlands, 622 are inland while 60 are coastal wetlands. Categorywise spatial spread of wetlands is listed in Table 6.
Table 6:: Area under Inland and Coastal Wetlands of Karnataka
Wetlands |
Area (ha) |
% Area |
Number |
Inland |
Natural |
581.25 |
0.21 |
7 |
Man-made |
253433.75 |
93.22 |
615 |
Total |
254014.00 |
93.43 |
622 |
Coastal |
Natural |
16643.75 |
6.13 |
56 |
Man-made |
1181.75 |
0.44 |
4 |
Total |
17825.50 |
6.57 |
60 |
Total wetlands |
< 56.2 ha |
278310.50 |
100.00 |
682 |
> 56.2 ha. |
|
|
171 |
According to the spatial extent of various wetlands in Karnataka, 561 tanks account for 79087.50 ha followed by reservoirs (53) covering an area of 174290.00 ha. There are 5 naturally formed lakes (437.50 ha) and 9 mudflats (1506.25 ha). The area under mangroves comprises of 550.00 ha and was observed at 7 individual patches. Subcategorywise spatial spread is listed in Table 7
Table 7 : Area under different subcategories of Wetlands in Karnataka
Wetland Category |
Area in ha |
No. of wetlands |
Natural |
|
|
Inland |
437.50 |
5 |
Lake/pond |
56.25 |
1 |
Ox-bow lake |
87.50 |
1 |
Swamp/ Marsh |
174290.00 |
53 |
Tank |
79087.50 |
561 |
Waterlogged |
56.25 |
1 |
Coastal |
|
|
Estuary |
1306.25 |
11 |
Creek |
6556.25 |
5 |
Kayal |
925.00 |
4 |
Tidal/Mudflat |
1506.25 |
9 |
Sand/Beach/Spit |
2512.50 |
9 |
Mangroves |
550.00 |
7 |
Salt marsh/ Marsh vegetation |
3287.50 |
11 |
Salt pans |
1181.75 |
4 |
Total |
271840.00 |
682 |
8.3 DISTRICT WISE AREA UNDER WETLANDS::
Table 8 gives the distribution of wetlands in the 19 districts of Karnataka state. The oxbow lake in Bidar has an areal extent of 56.25 ha. Similarly the swamp in Gulbarga covers an area of 87.50 ha. Major natural lakes are distributed as follows - two in Mandya (143.75 ha), and one each in Mysore (106.25 ha), Raichur (93.75 ha) and South Canara (93.75 ha). There are 53 reservoirs in the state distributed in all the districts except Kolar, Mandya, Mangalore and south Canara, covering a total area of 174290.00 ha. There are many tanks in Kolar district, which are shallow with high turbidity. Shimoga has the largest area (42363.00 ha) covered by reservoirs (11) followed by Bellary (30687.50 ha) and Bijapur (10475.00). There are 561 tanks covering an area of 79087.50 ha. Tumkur ranks the first in number (121) and also in area (15268.75 ha) followed by Kolar where 58 tanks have a spatial extent of 10294.00 ha. The coastal wetlands are seen in Uttara and Dakshina Kannada districts. They have 11 estuaries covering an area of 1306.25 ha. There are 4 in Uttara Kannada (668.75 ha) followed by 5 in Dakshina Kannada (637.50 ha). There are 5 distinct patches of mangroves present in Dakshina Kannada (381.25 ha) and two in Uttara Kannada (168.75 ha). Out of 6 salt marsh/marsh vegetation, 5 are in Uttara Kannada (2593.75 ha) and one in Dakshina Kannada (168.75 ha). All the four salt pans are in Uttara Kannada covering an area of 1181.25 ha.
Table 7 : Area under different subcategories of Wetlands in Karnataka
District
|
Wetland type
|
No
|
Total Area (ha)
|
INLAND WETLANDS |
COASTAL WETLANDS |
|
Oxbow lake |
Swamp / Marsh |
Reservoirs |
Tanks |
Estuary |
Mangroves |
Salt marsh /pans |
Others |
|
Bangalore |
|
|
2 |
48 |
|
|
|
|
50 |
10512.00 |
Belgaum |
|
|
3 |
8 |
|
|
|
|
11 |
19733.25 |
Bellary |
|
|
4 |
35 |
|
|
|
|
39 |
35300.00 |
Bidar |
1 |
|
1 |
2 |
|
|
|
|
5 |
887.50 |
Bijapur |
|
|
4 |
25 |
|
|
|
|
29 |
12993.75 |
Chickmagalur |
|
|
1 |
15 |
|
|
|
|
16 |
19775.50 |
Chitradurga |
|
|
4 |
51 |
|
|
|
|
55 |
13087.50 |
Kodagu |
|
|
1 |
- |
|
|
|
|
1 |
462.50 |
Dharwad |
|
|
1 |
35 |
|
|
|
|
36 |
4400.00 |
Gulbarga |
|
1 |
5 |
21 |
|
|
|
|
27 |
4625.00 |
Hassan |
|
|
2 |
29 |
|
|
|
|
31 |
9843.75 |
Kolar |
|
|
- |
58 |
|
|
|
|
58 |
1029.40 |
Mandya |
|
|
- |
25 |
|
|
|
|
27 |
3312.50 |
Mysore |
|
|
6 |
49 |
|
|
|
|
56 |
26450.60 |
UttaraKannada |
|
|
3 |
2 |
4 |
2 |
9 |
14 |
34 |
28131.25 |
Raichur |
|
|
1 |
27 |
|
|
|
|
29 |
3099.50 |
Shimoga |
|
|
11 |
10 |
|
|
|
|
21 |
45756.75 |
Dakshina Kannada |
|
|
- |
- |
7 |
5 |
1 |
13 |
27 |
4375.00 |
Tumkur |
|
|
4 |
121 |
|
|
|
|
125 |
18249.50 |
8.4 4 SEASONAL VARIATIONS IN WATER-SPREAD AREA OF WETLANDS::
The water-spread area of wetlands in Karnataka in the pre-monsoon period is 204053.74 ha whereas in the post monsoon period it is 246643.00 ha. Out of the total 682 wetlands in the state, 71 have shown water-spread area of less than 56.25 ha. The seasonal variations in the wetland area are prevalent where the water levels fluctuate depending on their use and meteorological conditions. Hence the inland wetlands (pond, lakes, reservoirs and tanks) show seasonal variations in the water-spread. The coastal wetlands under the influence of sea have not registered any changes in the water-spread. The water-spread of lakes/ponds in post-monsoon is 437.50 ha while in the pre-monsoon it decreases to 368.75 ha. Reservoirs show considerable variation during the pre (138684.25 ha) and post (162768.00ha) monsoon seasons. Tanks vary from 46975.25 ha to 60912.25 ha in the post- monsoon (Table 9).
Table 7 : Area under different subcategories of Wetlands in Karnataka
Wetland category |
Pre-monsoon (ha) |
Post-monsoon (ha) |
Lake/Pond |
368.75 |
437.50 |
Ox-bow lake |
56.25 |
56.25 |
Swamp/marsh |
87.50 |
87.50 |
Reservoir |
138684.25 |
167268.00 |
Tank |
46975.25 |
60912.00 |
Waterlogged (manmade) |
56.25 |
56.25 |
Estuary |
1306.25 |
1306.25 |
Creek |
6556.25 |
6556.25 |
Kayal |
925.00 |
925.00 |
Tidal/mudflat |
1506.25 |
1506.25 |
Sand/Beach/Spit/Bar |
2512.50 |
2512.50 |
Mangroves |
550.00 |
550.00 |
Salt marsh/Marsh vegetation |
3287.50 |
3287.50 |
Salt pans |
1181.75 |
1181.75 |
Total |
204053.75 |
246643.00 |
Top
9. THE INTERCONNECTIVITY OF WETLANDS :
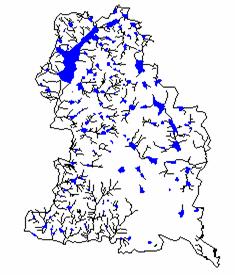
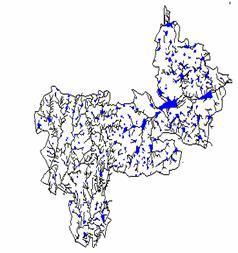
Satellite remote sensing data and Geographic Information Systems have the potential to provide comprehensive information on various facets of wetland monitoring and management. Remotely sensed data from spaceborne sensors provide a spatially extensive and non-invasive means to produce maps of surface cover types and their biophysical properties. A Geographical Information System provides the ability to organise, visualise and merge the spatial datasets from different sources. The two main divisions evident in the application of remotely sensed data are as a tool for delineating wetlands and for mapping their internal composition or for estimating biogeochemical and biophysical properties. The remote sensing data help in the evaluation of land use/cover changes and their impact on the same area using multi-data imageries.
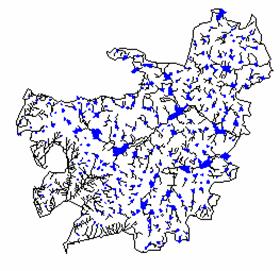
Figure 1: Bangalore North

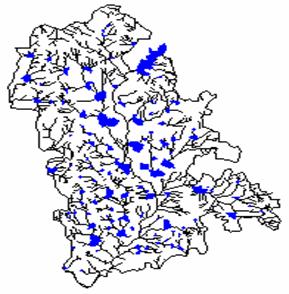
| Figure 2: Bangalore South

|
Figure 3: Anekal

| Figure 4: Chanapatana

|
Bangalore by virtue of its location, climate and rainfall supports a number of man-made tanks. The drainage network for Bangalore district was mapped using Geographic Information Systems along with remote sensing data and conventional field survey (Deepa and Ramachandra, 1999). The drainage map encompassed all the three taluks of Bangalore urban and 8 taluks of the Bangalore rural district. Figure 1 represents the drainage connectivity of Bangalore North district where the Nagavara kere, Yelahanka kere and Jakkur kere (the major wetlands of the taluk) are joined. Bellandur tank of the Bangalore south taluk(Figure.2) is interconnected to the surrounding wetlands which drain into Varthur and finally into the Dakshina Pinakini river. The Vrishbavathi river along with the catchment area flow from north to south - west of the taluk.
Figure 3 represents the drainage map of Anekal district of Bangalore Urban district. In the north, Sakavar kere, Jigani kere, Hennagara kere, Mullanattur kere and Bidaraguppe kere are interrelated. In the south, Anekala kere is interlinked to Chikkanagudde kere, Chenneagrahars kere, Tatanhalli kere and Attibele kere, which drain into Chinna river. Most of the wetlands of this region drain into the Xebba halla and Jkkana halla and finally into the Antharagange hole in Kanakapura taluk (Figure 4). The Kanava reservoir in Chennapatna serves as receiving waterbody for the interconnected wetlands such as Holegeredoddi kere, Chennapatna kere and Kudulur kere. The Kanava finally drains into the Shimsha river.
Figure 5: Devanahalli

|
Figure 6: Doddaballapur

|
Figure 7: Hosakote

| Figure 8: Kankapura 

|
The Devanahalli taluk (Figure 5) is represented by major wetlands like Rampur kere and Yellamallappachetty kere, which drain into the Dakshina Pinakini river. The Bagulur kere, Gamannahalli kere, Doddajallaamanikere, Bandagodigana halikere and Bodigermane kere are interconnected and drain into Hoskote taluk.
Doddaballapur taluk has two major networks (Figure 6). The first drains into the Hesarghatta tank and consists of the Mallanayakan halli kere, Dodda hajji kere and Madhure kere. The second network connects Hambikere, Doddaballapur kere, Palanakere and Konagotta kere draining into Hesarghatta tank reaching Arkavathi river.
The Hoskote taluk (Figure 7) is represented by interconnected wetlands of Hoskote kere, Nallurhalli kere, Mugbal kere, Yelachchahalli kere and Tavare kere. These wetlands finally drain into the Dakshina Pinakini river in southern region.
Figure 8 represents the Kanakpura drainage network map. The Arkavathi drains into the Cauvery basin. Most of the wetlands in this taluk drain into the Anthargange hole connecting Rayanala hole and the Kuthe hole joining the Arkavathi.
Figure 9: Magadi 

| Figure 10: Nelamangala 

|
Figure 11: Ramanagaram 

|
The major water bodies of Magadi taluk (Figure 9) are Ire kere, Bettahalli kere, Mayasandra kere, Biskur kere and Kalepalya kere, which drain into Kunigal kere of Tumkur taluk. The wetlands in the eastern region drain into Chikka tore and finally into the Arkavathi river. The wetlands in the south drain into Kanva hole of Ramanagaram taluk.
The Nelamangala drainage map is shown in Figure 10. The wetlands of this taluk drain into the Mavathur kere (Tumkur district). Chamarajasagar reservoir serves as receiving water body in this area including river Arkavathi.
Nelligode tank and Byramangala reservoir are the two important wetlands of Ramanagaram taluk draining into the Vrishbavathi river (Figure 11).
9.1 ANALYSIS OF SPATIAL AND TEMPORAL CHANGES IN WETLAND CATCHMENT AREA::
Watersheds are natural hydrologic entities covering a specific area of land from which the rainfall flows to a drain, channel, lake or river. They are appropriate for the assessment of available resources, planning and implementation of development programs.
In Karnataka, dryland farming is practiced in about 78% of the net cultivated area and crop production is dependent on the monsoon. The major problems in these areas appear to be deforestation, undependable and uneven distribution of rainfall, land degradation due to erosion, decreased soil fertility, major portion of the watersheds under wastelands, lack of management and infrastructure, urbanisation and increased occurrence of drought. Thus farming is dependent not only on soil, monsoon rainfall but also on the socio-economic status of farmers.
The spatial and temporal changes in the status of the wetlands with their catchment area from 1988 to 1993 have been analysed using remote sensing data (ISRO, 1998). Results are listed in Table 10. The Figures 12 to 31 lists the Land use changes in selected watersheds of Karnataka.Figures 32 and 33 represent the water bodies in the catchment, drainage network and land use/ land cover changes of Nelligode and Heserghata watershed areas of Bangalore. The analyses of these watershed areas revealed that the area of the Nelligode tank has reduced by 38% (Deepa and Ramachandra, 1999). Lack of proper vegetative cover has led to soil erosion, which has contributed to reduced storage capacity.
Table 10 : The Spatial and Temporal change in the status of the Wetland with their catchment area from 1988 to 1993
District |
Wetland |
Rainfall |
Agroclimatic |
Waterbody |
Agricultural |
Irrigated |
Wasteland |
Forest |
Fallow |
Change |
|
|
mm |
Zones |
|
crop |
crop |
|
cover |
|
% |
Bangalore |
Kalyankere |
822 |
Eastern dry |
0.7 |
19.6 |
4.3 |
-16.7 |
|
-0.4 |
24.6 |
Tumkur |
Kallambella |
495 |
" |
0.3 |
-9.7 |
19.4 |
-9.7 |
5.2 |
|
25 |
Kolar |
Chitravathi |
692 |
" |
-1.2 |
10.1 |
6.1 |
-1.2 |
7.6 |
-20.5 |
23.8 |
Mysore |
Arsanikere |
688 |
Southern dry |
|
2.3 |
11.8 |
-6.3 |
1.3 |
-6.8 |
15.4 |
Mandya |
Lokapavani |
691 |
" |
-0.5 |
11.6 |
7.3 |
-14.8 |
8.6 |
-12.2 |
27.5 |
Hassan |
Devihalli |
751 |
" |
0.01 |
3.3 |
8.5 |
-4.4 |
5.1 |
-10.2 |
|
Shimoga |
Hirehalla |
612 |
" |
|
12.9 |
2.5 |
-0.1 |
0.8 |
-15.4 |
16.2 |
Chikmagalur |
Mugalikatte |
600 |
Central dry |
1 |
4.4 |
6.8 |
-8.2 |
|
|
12.2 |
Chitradurga |
Ganjigunte |
639 |
" |
0.3 |
0.8 |
2.7 |
-3.5 |
|
|
3.8 |
Dharwad |
Asudinala |
632 |
North trans |
|
4.2 |
2.5 |
-0.2 |
3.8 |
-8 |
10.5 |
Raichur |
Hirehalla |
522 |
N-E Dry |
0.02 |
-2.6 |
5 |
-5.5 |
3.2 |
|
8.2 |
Gulbarga |
Muchkulla nala |
750 |
" |
0.8 |
8.9 |
6.9 |
-11.1 |
|
-5.4 |
16.6 |
Bidar |
Doddahalla nala |
800 |
" |
0.1 |
14.3 |
4.1 |
-9.3 |
1.4 |
-9.6 |
19.9 |
Gulbarga |
Margutti |
750 |
" |
0.8 |
2.1 |
10.9 |
-12.5 |
3.6 |
-4.8 |
17.3 |
Bijapur |
Chandakavate |
551 |
" |
|
5.3 |
6.4 |
-11.1 |
7.4 |
-8 |
19.1 |
Belgaum |
Hirehalla |
642 |
" |
0.2 |
3.5 |
13.4 |
-13.5 |
0.9 |
-2.8 |
18 |
Bellary |
Sannabombrahalla |
620 |
" |
|
-8.6 |
11.5 |
-1.4 |
2.3 |
-1.5 |
13.8 |
Uttara Kannada |
Tattihalla |
1200 |
Hilly |
1.4 |
3.5 |
1.8 |
-7 |
0.3 |
|
7 |
Dakshina kannada |
Sitanadi |
3692 |
" |
0.1 |
4.5 |
1.6 |
|
1.2 |
1.4 |
7.4 |
Kodagu |
Shanivarasanthe |
2175 |
" |
|
1.7 |
4.3 |
|
9.2 |
|
15.2 |
Top
10. IMPACT OF URBANISATION ON WETLANDS :
Figure 34: Temporal changes analyses of Bangalore City Wetlands

|

|
|
|
Number of water bodies: 389 |
Number of water bodies: 246 |
Ref: Survey of India Toposheet
Scale: 1:50,000 |

Geographical area North: 506.87 Sq. km
South : 594.96 Sq. km |
|
In recent years the rapid urbanisation has contributed to the degradation of the wetlands beyond repair. The city of Bangalore is the sixth largest metropolis in the country and supports a population of five million as compared to 0.4 million in 1941 (1991 census). The number of tanks has reduced from 262 in 1960 to around 81 at present. The spatial and temporal changes in the number of waterbodies were done with the help of GIS and remote sensing data (Deepa et al, 1997). The spatial mapping of the water bodies in Bangalore district (Figure 34) revealed that the number of waterbodies has decreased from 379 (138 in North and 241 in south) in 1973 to 246 (96-north and 150-south) in 1996. An overall decrease of 35.09% was attributed to urbanisation and industrialisation. The tanks were reclaimed for various purposes such as residential layouts, commercial establishments, sport complexes, etc. For e.g. Darmombudi tank has been converted into the current city bus stand, Millers tank into a residential layout, Sampangi tank into the Kanteerva stadium, Chelgatta into a golf course, Shuleh tank into a football stadium and Koramangala tank into a sports complex. This has changed the climate of the city and affected its ground water level.
Bangalore city is spread between Bangalore north and south taluks. Comparative analyses of Bangalore north and south drainage networks (Figure 1 and 2) with other taluks (Figure 3 to 11) clearly bring out the impact of urbanisation in the form of disappearance of waterbodies and the discontinuity in drainage networks.
Figure 35: Madivala Drainage Network 
|
Figure 36: Drainage network of Bellandur tank 
|
|
 
|
The loss in wetland interconnectivity in Bangalore district is attributed to the enormous increase in population and the reclamation of tanks for various developmental activities (Deepa and Ramachandra, 1999). Analyses of Madivala and Bellandur drainage network (Figure 35) revealed that encroachment and conversion has resulted in the loss of connectivity between Yelchenhalli kere and Madivala. Similarly the drainage network between Bellandur and Ulsoor (Figure 36) is lost due to conversion of Chelgatta tank into a golf course.
The loss of wetlands has led to decrease in catchment yield, water storage capacity, wetland area, number of migratory birds, floral and faunal diversity and ground water table. Studies reveal the decrease in depth of the ground water table from 35-40 to 250-300 feet in 20 years due to the disappearance of wetlands.
Top
11. CHARACTERISATION OF WETLANDS :
In Karnataka, during recent years both natural and anthropogenic activities have degraded the quality of the waterbodies rendering them unusable for a variety of purposes. There are many reasons for the over-use, misuse and destruction of wetlands: the high dependence on wetlands by an ever-growing human population for water, food, fodder, fuel, fibre, shelter or transportation; the progressive intensification of resource exploitation, aggravated by technology, commercial interests, and often promoted by prevailing policies or the lack of any; inadequate institutional mechanisms for management; and ignorance about the need for conservation. The quality of the water is influenced by various physico-chemical parameters. Hence it becomes imperative to assess the physico-chemical and biological quality of the aquatic system in order to determine the end-use (Rege et al, 1996).
• Turbidity:
Out of the major 628 wetlands in Karnataka, qualitative turbidity ratings are given for 400 (Table 11). The number of wetlands having moderate turbidity are 222 wetlands, 200 have low turbidity followed by reservoirs (36), lakes/ ponds (2) and one oxbow lake. Tanks (188) are largest in number having high turbidity followed by eight reservoirs and two lakes.
Table 11 : Turbidity status of various Wetlands
Wetland category |
Low |
Moderate |
High |
Lake/pond (5) |
2 |
1 |
2 |
Ox-bow lake (1) |
1 |
- |
- |
Reservoir (53) |
36 |
9 |
8 |
Tank (561) |
161 |
212 |
188 |
Waterlogged (1) |
- |
1 |
- |
• Aquatic vegetation:
Aquatic plants are found in the littoral zone, which are ideal habitats for fish and migratory birds. The status of aquatic vegetation in various wetlands has been mapped, on the basis of which it is broadly divided into completely vegetated (CV), partially vegetated (PV), vegetation on fringes (VF) and no vegetation (NV). Of the total 682 wetlands (Table 12), 517 do not support any vegetation, of these 417 are tanks. There are 83 tanks partially vegetated, 54 with vegetation on fringes and 7 are completely vegetated.
Table 12 : Aquatic vegetation status of various Wetlands
Wetland category |
PV |
VF |
CV |
NV |
Lake/pond |
- |
5 |
- |
5 |
Reservoirs |
5 |
9 |
- |
39 |
Tanks |
83 |
54 |
7 |
417 |
Ox-bow lake |
- |
- |
1 |
- |
Swamp/marsh |
1 |
- |
- |
- |
Waterlogged (man-made) |
1 |
- |
- |
- |
Estuary |
- |
- |
- |
11 |
Creek |
- |
- |
- |
5 |
Kayal |
- |
- |
- |
4 |
Tidal/mudflat |
- |
- |
- |
9 |
Sand/beach/spit/bar |
- |
- |
- |
9 |
Mangrove |
- |
- |
7 |
- |
Salt marsh/marsh veg |
11 |
- |
- |
- |
Top
12. BANGALORE WETLANDS :
Bangalore district is situated in the south Deccan region of Peninsular India. The district is elevated and plateau-like and is about 855 to 940 m above the mean sea level. A ridge extends from north to south in the western side dividing the area into two basins namely: the Arkavathi basin in the west and the Dakshina Pinakini on the east. All the water bodies in the district are man-made. West flowing water bodies are few and drain into the nearby Arkavathi river or its tributary Vrishbhavathi. Those flowing east
drain into the Dakshina Pinakini river. Most of the tanks of Bangalore city occur in the Dakshina Pinakini basin. Sixty-seven tanks from the city drain into this basin and twenty-five into the Arkavathi river basin.
12.1 LAND-USE PATTERN IN AND AROUND BANGALORE
Studies of land-use pattern in 1985 revealed that 4.8% of the land is covered with water in the Bangalore area. The per capita demand for water per head is 85 l while the desirable quantity is 200 l per head. This has led to the exploitation of ground water resources. Relying on it has become unavoidable that even the minimum distance between two borewells has not been maintained.
12.2 CLIMATE, SEASONALITY AND WATERFLOW
The climate around Bangalore is tropical but due to its high elevation, it has a cooler side. Based on the fluctuations in rainfall, temperature and humidity, four main seasons can be seen in the Bangalore city. The average annual rainfall in the city is around 850mm. The temperature ranges between 15 to 37? C and the humidity from 25 - 95% respectively. The seasonal variation governs the flow and level of water in the tanks. The tanks get filled during the monsoon and the outflow is mainly used for irrigating crops. Most of the tanks in and around Bangalore go dry by the end of April unless there is inflow of sewage and industrial effluents.
12.3 DISTRIBUTION OF LAKES IN BANGALORE
Wetlands of Bangalore occupy about 4.8% of the city geographical area (640 sq.km) covering both urban and non-urban areas of Bangalore. Bangalore has many man-made wetlands but has no natural wetlands. They were built for various hydrological purposes and mainly to serve the needs of irrigated agriculture. Totally there were 262 lakes coming within the Green belt area of Bangalore City. Bangalore Metropolitan area is divided into seven taluks. Table 13 provides the distribution of tanks by taluks in Bangalore (Kiran and Ramachandra, 2001).
|
Table 13 : Talukwise distribution of tanks |
Table 14 : Distribution of 81 live lakes based on its area |
S no |
Name of the Taluk |
No. of tanks |
1 |
Bangalore North |
61 |
2 |
Bangalore South |
98 |
3 |
Hoskote |
23 |
4 |
Anekal |
44 |
5 |
Magadi |
11 |
6 |
Nelamangala |
13 |
7 |
Devanahalli |
12 |
|
Area |
No. of lakes |
Area < 10 ha |
49 |
Area between 11 & 20 ha |
16 |
Area between 21 & 50 ha |
14 |
Area > 50 ha |
2 |
Total |
81 |
|
The number of tanks in Bangalore has fallen from 262 in 1960 to some 81 at present (Deepa et al,1997). These tanks were grouped based on the spatial extent and are listed in Table 14, while Table 15 lists some of the live tanks in Bangalore with their water spread area (Deepa et al, 1997).
Table 15 : Spatial extent of some 17 existing lakes
S no |
LAKE |
AREA (ha) |
1 |
Vasanthapura |
2.0 |
2 |
Dorekere |
11.29 |
3 |
Moggekere |
6.06 |
4 |
Madivala |
114.20 |
5 |
Agaram |
56.67 |
6 |
Puttenahalli |
32.89 |
7 |
Doddabegur |
32.86 |
8 |
Ulsoor |
49.80 |
9 |
Bellandur |
361.30 |
10 |
Narasipura-1 |
3.62 |
11 |
Narasipura-2 |
6.12 |
12 |
Doddabommasandra |
40.90 |
13 |
Nagavara |
22.46 |
14 |
Lalbagh |
96.00 |
15 |
Kempambudhi |
14.84 |
16 |
Hebbal |
76.87 |
17 |
Hulimavu |
49.70 |
|
TOTAL |
977.58 |
12.4 DISTURBANCES OF WETLANDS IN BANGALORE
Wetlands are fragile ecosystems and are susceptible to damage even with only a little change in the composition of biotic and abiotic factors. They are threatened by a multitude of threats like inadequate water holding capacity, excessive withdrawal, pollution due to raw sewage and sullage, industrial effluents, eutrophication, leached fertilisers and insecticides. The main problems confronting lakes in and around Bangalore (Srinivasa, 1996) are discussed below.
• Mud lifting:
The tank bed silt/mud is used as manure. With the enormous growth of Bangalore city, mud lifting has become a common practice for making bricks on an industrial scale. This is rampant in many tanks and has an adverse effect on the ecosystem rendering the water turbid and affecting all aquatic life. The recommendations included the curtailing of mud lifting to summer months, lifting on a rotational basis to allow the flora and fauna to recuperate, collection of tariff, monitoring of this activity by the departments involved, etc.
• Encroachment of tank beds:
The increased urbanization in Bangalore city has led to encroachment of tank-beds for agriculture, human settlements and for laying of roads. Many industries and industrial layouts have also mushroomed in the tank beds leading to various detrimental effects like the removal of vegetation from the shore directly affecting the bird population, the quality of water etc. The suggestions include the removal of these encroachments and safe guarding the shore against any encroachment by the irrigation and revenue departments.
• Poaching and hunting of birds:
Waterfowl and especially migratory birds, present in the water bodies of Bangalore from October to April, are extensively hunted. Birds have been hunted in about 35% of the tanks surveyed, greatly diminishing their diversity.
• Sewage and effluents:
The inflow of sewage has been recorded in 10% of the tanks surveyed while 8% of the tanks revealed the presence of algal blooms. The inflow of sewage has drastically changed the quality of these water bodies. Suggestions include the construction of facilities for treating sewage, divert the inflow of sewage, etc.
The lakes around Bangalore were mainly constructed for irrigation and drinking water supply. But now only 30% of the lakes are used for irrigation. Fishing is carried out in 25% of the lakes surveyed, Cattle grazing in 35%, agriculture in 21%, mud-lifting in 30%, drinking in 3%, washing in 36% and brick-making in 38% of the lakes (Srinivasa T.S., 1996).
12.5 PHYSICAL, CHEMICAL AND BIOLOGICAL ASPECTS
Water samples analysed in 1995 for various physico-chemical parameters were compared with the values obtained during 1989 (Chakrapani and Ramakrishna Parama, 1996). The results revealed that of the 61 lakes surveyed, some of the lakes needed urgent attention from the point of view of their unsuitability to sustain biological activity and diversity. The highly threatened lakes include Anchepalaya, Bellandur, Chikka Hulimavu, Harohalli, Kengeri, Kalkere, Nagavara, Nelamangala, Puttenhalli, Rachenahalli, Rampura, Tavarakere, Ulsoor, Varthur, Vengaiah, Yellchehalli and Yellamallappachetty. The rest of the lakes were fairly safe for the resident flora and fauna. The bird census for 1995 and 1996 have identified 140 species from the wetland habitats surveyed out of the three hundred and thirty species found in the Bangalore area. The results indicated that no single factor was responsible for the presence and number of bird species.
In order to characterise the water quality of wetlands in Bangalore, depending on the location and type of pollutants getting in to the system, sample lakes/tanks were chosen for water quality monitoring. Seven tanks namely Bannerghatta, Hebbal, Kamakshipalaya, Madivala, Sankey, Ulsoor and Yediyur (Kiran and Ramachandra, 2001) were assessed for their physico-chemical and biological characteristics for a period varying from 6-12 months during 1999-2000. The results revealed that the Bannerghatta tank was clean, as it was supported by low values of turbidity, increased values of transparency (30 to 50 cm) and dissolved oxygen levels of 6.0 to 7.8 mg/l. Sankey tank was also relatively clean as exemplified by parameters like DO (6.6 mg/l), BOD (7.0 mg/l), EC (0.55 mS/cm) etc. The water quality of Kamakshipalaya tank was monitored for a period of 6 months and the results revealed that the tank was highly polluted due to the inflow of sewage and industrial effluents from the neighbouring areas. The turbidity of the water body was high (28 to 362 NTU) along with parameters like EC (1.27-2.09 milli Siemens/cm), DO (0.5 - 3.9 mg/L) and BOD (27-192 mg/L). The water quality status of Madivala was analysed by various physico-chemical and biological parameters. The tank receives inflow of sewage as elucidated by high values of pH (7.29.1), EC (0.63-1.4 mS/cm), BOD (4.0-42 mg/L) and COD (46.2 282 mg/L). Yediyur tank receives industrial and domestic effluents and this has given rise to algal blooms mainly microcystis. The water quality was assessed for a period of 12 months and the results revealed high turbidity, low transparency (5-14 cm), alkaline pH (7.5-10.1), and high sodium, potassium calcium and magnesium. Hebbal tank, situated in the northern part of the city supports agriculture, fishing activities etc. The tank receives untreated sewage from the adjacent residential layouts, contributing to alkaline pH (7.5-8.9), high EC (1.2-1.5 mS/cm), high total solids (740 mg/L), low dissolved oxygen (2.5-7.3 mg/L) and the nitrate, phosphates ranging from ND to 4.0 mg/L attest to the eutrophic condition of the lake. Ulsoor tank receives untreated sewage from the nearby industries and residential layouts contributing to high pollution loads in the tank. This is exemplified by high levels of turbidity (68-290 NTU), low transparency (4.5-16 cms), high EC (0.6-1.2 mS/cm), BOD (10-31.0mg/L) etc.
A study was undertaken to analyse the impact of various human activities that have led to the degradation of Hebbal lake (Ranjani and Ramachandra, 2000). The physico-chemical analysis of the lake revealed that the water was polluted due to the inflow of sewage and the lake was highly sedimented through out the year due to the activities in catchment area.
Amurthalli lake, situated in Bangalore North taluk, has attained eutrophic condition due to excessive input of nutrients and organic matter from the inflow of sewage, storm water drainage, industrial effluents and dumping of organic waste matter from the surrounding areas (Rajinikanth and Ramachandra, 2000). The lake water was polluted as revealed by high levels of phosphates, TSS, alkalinity, hardness, weed infestation and low DO. The socio-economic survey showed that, the economic dependency of people residing around the wetland was estimated to be about Rs.20.0/day. The lower value was due to eutrophic condition of the lake, which has made the wetland resource unusable.
Rachenahalli lake, situated in Bangalore North and South taluks (Rajinikanth and Ramachandra, 2000) has been polluted due to discharge of wastewater and dumping of organic waste materials in to the lake from the surrounding areas (mainly poultry wastes). Its quality has been affected by parameters like nutrients, alkalinity and hardness. The socio-economic survey showed that, the economic dependency of people in the surrounding villages was estimated to be about Rs.10,435/day (during cropping and fishing season).
Ninety-seven tanks in and around Bangalore were selected for the characterisation of these wetlands. The tanks were located on the main roads and were within 30-km radius from Bangalore (Krishna, et al. 1996). The study area encompassed a region stretching from 12°40'N to 13°13' N and longitudinally from 77°23'E to 77°57'E. Water and plankton samples were collected from the 97 tanks and subjected to analysis
• Irrigation quality:
The water samples had a pH ranging from 7.3 to 10 with an average of 8.3. The electrical conductivity ranged from 132 to 9600 micro mhos/cm indicating the presence of high amount of soluble salts. The sodium cations were the highest followed by calcium, magnesium and potassium. The average values of these cations were 2.4, 1.54,1.0 and 0.38 mg/l. The quality of water for irrigation is based on a set of standards which take into consideration, the total concentration of soluble salts, concentration of sodium (sodicity), concentration of carbonates plus bicarbonate ions (RSC) and trace elements such as boron. Depending on the electrical conductivity the waters are classified into C1, C2, C3 and C4. More than 50 percent of the water samples belonged to C2 class followed by C1, C3 and C4. Almost all the tanks had low sodicity apart from two samples indicating least sodium hazard. The RSC values were low in 92% of the samples, thus being safe for irrigation. Only three samples belonged to the marginal quality whereas three samples were unsuitable for irrigation. In Bangalore area the soil is of red sandy loam or red loams, which are, light textured with good drainage and do not favour salt accumulation. All the water samples analysed have less than 3ppm of boron and can be used for tolerant and semi-tolerant crops in all soils. Other trace elements are well within their normal limits. The water from Hennur and Arehalli tank is unfit for irrigation as they are polluted by the surrounding industries.
• Drinking quality:
Based on the drinking water quality standards, most of the parameters like pH, dissolved solids, chlorides and iron show higher values than the limits prescribed. A number of tanks in city outskirts were seriously affected due to the inflow of sewage, industrial effluents etc. The dissolved oxygen levels were high in all the tanks, more than 14 mg/l but supported rich algal growth. Most of the tanks showed the presence of nematodes indicating the presence of faecal contamination.
12.6 PLANKTON DIVERSITY
Qualitative analysis of plankton surveys covering 88 lakes was conducted in 1989 and 1995 in the lakes in and around Bangalore (Chakrapani, 1996).
Phytoplanktons surveyed are considered under five major groups:
• Myxophyceae:
It was observed that Microcystis sp. was the predominant one as it occupied 68% (41) of the tanks surveyed followed by Phoridium sp., in 33 tanks (55%). The others are Aphanizomenon in 15, Anabena in 13, Oscillatoria in 9, Spirulina in 7, Coelosphaerium and Nostoc sp. in 6 and Lyngbya sp. in 5 lakes. The presence of Microcystis sp. is indicative of the eutrophic condition of the lake and has shown an increase from 48.0 % in 1989 to 68.3 % during 1995.
• Chlorophyceae:
Eleven non-filamentous and twelve filamentous forms represent this group. The widely distributed non-filamentous forms were Coelastrum occurring in 17 of the lakes surveyed, Scenedesmus in 14, Pediastrum in 13, Bulbochaete in 12 and Volvox sp in 11. The filamentous forms included Spirogyra (37 lakes), Microspora (27), Zygnema (22) and Mougeotia sp (21 lakes). The species that occur to a lesser extent include Draparnaldia (14), Ulothrix (11) and Chaetophora sp (10). The species belonging to these groups are lower in number characterising the increased pollution load of the lakes in Bangalore .
• Desmidiaciae (Desmids):
This group is poorly represented by the occurrence of one form - Closterium in 13 lakes.
• Bacillariophyceae (Diatoms):
Among the commonly occurring forms of this group are Synedra sp. (35; 58% of the lakes), Nitzchia sp. (31; 52%), Frustulia sp. (22; 37% of the lakes) and Navicula sp. (18; 30% of the lakes).
• Dinophyceae:
Is represented by one form- Ceratium.
The zooplanktons surveyed fall into six major classes:
• Protozoa:
Thirteen forms in 1989 and 14 forms in 1995 represented this group. The major forms were Difflugia lobostoma (48, 80% of the lakes), Difflugia corona (39, 65% of the lakes), Arcella sp (34, 57%) and to a lesser extent Centropyxis and Phacus.
• Rotifers:
Most of the forms of this class are typical of polluted waters. The number of species increased from 22 in 1989 to 29 in 1995.
• Cladoceran Crustaceans:
This group of zooplanktons is highly sensitive to low concentration of pollutants. From the general observation, the diversity of this group is seriously affected as elucidated by low populations in the survey of 1988 and 1995.
• Copepods:
Only two forms represented this group namely Mesocyclops sp (58 lakes) and Calanoid copepods in 51 habitats.
• Ostracoda:
Five forms of this group were recorded.
12.7 IMPACT OF URBANISATION ON THE DIVERSITY OF PLANKTONS IN BANGALORE CITY
The increased urbanisation has affected the water quality of the lakes of Bangalore. The changes in the water quality is insinuated by the decreased diversity of planktons if they are sensitive to pollutants in the water body and increased planktonic communities if they are bioindicators of pollution. The urban and non-urban lakes of Bangalore City exemplify this fact. The differences in the planktonic species and the number in 1988 and 1995 (Chakrapani, 1996) in the urban and rural areas of Bangalore are given below.
Urban lakes:
• Anchepalya: The pollutant indicating phytoplankton- Microcystis sp. and the non-filamentous algae (desmids and diatoms) increased along with zooplankton forms like protozoans, rotifer with a decrease in ostracod and copepod forms.
• Chikka Hulimavu: The situation worsened when compared to 1988 as the phytoplankton forms decreased from 20 to 10 and zooplankton from 26 to 16 forms.
• Dodda Begur: There was decrease in phytoplankton from 22 to 19 forms and zooplankton decreased from 31 to 24 forms from 1989 to 1995.
• Jakkur: A marginal increase in phytoplankton from 9 to 10 forms and a marked decrease of zooplankton from 22 to 12 were seen.
• Kalkere: The diversity of phytoplanktons was replaced by blue-green algae indicating the eutrophic condition of the lake in 1995. The zooplankton decreased from 23 species to 13 species.
• Lalbagh: In this lake the phytoplankton increased from 12 to 20 forms with the blue-green algae on the decline and no changes were observed with zooplankton.
• Madivala: The phyto and zooplankton were better represented in the year 1989 than 1995 as the former decreased from 23 to 11 forms and the latter from 28 to 19.
• Nelamangala: The phytoplanktons increased in 1995 (30>15) whereas zooplankton was higher in 1989 (27>24).
• Puttenahalli: The number of phytoplanktons remained the same whereas the zooplankton decreased from 33 to 13 forms from 1989 to 1995.
• Rachenahalli: The phytoplanktons (11>6) as well as the zooplanktons (17>16) were higher in 1989 as compared to 1995. The ecological condition of the lake seems to have deteriorated.
• Ulsoor: The lake showed a poor diversity of phyto and zooplanktonic forms in the year 1995 as they decreased from 14 to 5 forms.
• Yelahanka: Phytoplankton decreased from 27 to 8 forms and zooplankton from 27 to 19.
• The other urban lakes affected are Yellemallappa Chetty, Agara, Nagavara, Rampura, Varthur and Yediyur.
Rural lakes and non-urban lakes :
• Anneshwara: In contrast to the urban lakes the rural or non-urban lakes do not show much changes in terms of planktonic diversity. This lake exhibited improvement from 9 to 14 forms of phytoplankton and 25 to 28 forms of zooplankton.
• Bidare kere: A marginal decrease in the phyto (27 to 25) and zooplanktons (26 to 25) were observed.
• Harhalli-S: This lake exhibited enormous decrease in the phyto (15 to 4) and zooplanktons (24 to 11 forms) from 1989 to 1995.
• Hoskote: The phyto (10 to 14) and zooplankton (20 to22) forms increased from 1989 to 1995.
• Jigani: The phytoplankton forms decreased (16 to 12) whereas the zooplanktonic forms increased (14 to 24). But the increase in Microcystis sp and Brachionus sp. is indicative of high pollution levels.
• Mantapa: The phyto (27 to 19) and zooplanktons (31 to 17) forms decreased from 1989 to 1996. There was no decrease in the blue-green algal forms but there was a decrease in other forms indicative of deterioration in the water quality.
• Mugbala: There is decrease in both phyto (15 to 7) and zooplankton (26 to 16) during the period from 1989 to 1995.
• Sakalvara: The diversity of both phyto and zooplankton reduced drastically. The phytoplanktons decreased from 28 to 4 and the zooplanktons from 34 to 12.
• The other non-urban lakes that are not affected by the water quality but show a decrease in the planktonic forms diversities included Arehali, Doddatumkur, Gopalpura, Doddasane and Koikondanahalli.
Top
13. INTER DISTRICT WETLANDS :
As the construction of reservoirs and dams can affect the physico-chemical, biological and cultural as well as biodiversity of the ecosystem, it is imperative for assessment of the resultant impacts. In this regard Sharavathi river basin, in Shimoga district of Karnataka is assessed for changes in water and soil due to the construction of the Linganamakki dam (Rajinikanth et. al., 2001). Representative water and soil samples were subjected to physico-chemical analysis. Sample analyses of water and soil revealed that most of the parameters analysed were within the limits provided by WHO, APHA and NEERI. Only at two sampling stations, the turbidity and colour did not conform to the standard values. The reason for this variation is the inflow of agricultural-runoff at those points.
Fluorosis is caused due to excess fluorine in the water manifested in the form of dental/skeletal fluorosis and non-skeletal manifestations. In India 25 million people in 15 states suffer from fluorosis at various stages and another 25 million are reported to be susceptible to it. Twelve districts of Karnataka (Ramaraju H.K., 1995) are found to be endemic with fluorosis including Kolar district. It was found that fluoride in ground water is heterogeneously distributed. The fluoride concentrations in the ground waters ranged from 0.3 to 1.5 mg/L. Epidemiological survey indicates that 25,670 people suffer from dental and skeletal fluorosis in Kolar district and another 39,000 are susceptible to it.
A detailed study of the physico-chemical and bio-chemical parameters in Kukkarahalli and Dalvoi lakes of Mysore district in Karnataka (Hosmani S.P., and Vasanth Kumar L., 2000) indicates high percentage of chemicals in Kukkarahalli lake (27.90%), which has low percentage of total plankton (43%). The activity of chemicals leads to the liberation of extra cellular products, increasing their quantity (53.19%). The death and decay of plankton may increase the bacterial activity in the lake, which in turn results in increase in bacterial colonies (57.5%). In Dalvoi lake, the percentage of chemicals is very high (72.09%) and plankton is also relatively high (56.80%). The percentage of biochemical parameters is correspondingly low (46.80%).
Various physico-chemical parameters in selected lakes of Mysore district, Karnataka were analysed (Yamuna and Balasubramanian, 2000). The lakes are found to be under the influence of major parameters like nitrate, pH, chloride, total dissolved solids (TDS), calcium and magnesium. In many samples, two or more parameters have been reported above the permissible limit of drinking water. The lake water is mainly utilised for agricultural activity. The major crops around these lakes are paddy, ragi, groundnut, sugarcane etc. The lakes of Mysore district are saturated with COD which may be due to excess usage of fertilisers and chemicals for increasing yield of the crop. The presence of abnormal COD calls for an immediate action to prevent the inputs of agrochemicals into the lakes.
Mahadeshwara et al, (2000), carried out a study on the ground water quality in Yelandur taluk, Chamarajnagar district, Karnataka, India. Thirty-one ground water samples collected from the taluk were subjected to water quality analysis. Using a specially designed computer programme HYCH in BASIC several water quality parameters and their ratios were classified into three general categories namely desirable, permissible and not permissible. The study reveals that urbanisation has affected the quality of water in Yelandur taluk.
Top
14. RESTORATION OF LAKES IN BANGALORE :
Wetlands are the primary habitat for wildlife, fish, waterfowl and provide opportunities for recreation, education, and research as well as form the basis for many economic activities. Pollution and restoration of wetlands reduces the amount of polluted run-off entering surface water and provides other benefits including improved aquatic habitats and floodwater control. The conservation and protection involves not only buffering wetlands from direct human pressures, but also maintaining important natural processes that operate on wetlands from outside, which may be altered by human activities. Management towards this goal should emphasize long term sustenance of historical, natural wetland functions and values. Restoration is thus a good opportunity to manage wetlands for broad wildlife goals. A restored wetland not only provides enhanced wildlife benefits, but also other benefits concurrently.
Increase in population in Bangalore city over the last two decades has created lot of pressure on the existing waterbodies. The Bangalore water supply and sewerage department is unable to meet the requirements for potable water in the city. The survey of groundwater in the city has revealed the overexploitation of underground water in the city and hence the water table has depleted. The depletion of lakes in the city is directly responsible for lowering of the water table. With these increasing demands for potable water in the city, alternate water sources is a must, otherwise it will be difficult to meet the water demand for the next decade. The use of reclaimed water for different purposes depends on the physical, chemical and microbiological quality of water and hence the criteria include health protection, technical feasibility and economics.
Madivala lake situated in the south-eastern part of the city with a good catchment area can collect 100mld of storm water. The tank receives sewage from the adjacent residential and industrial areas. A project is being implemented to convert the lake into a Wetland System of sewage treatment, using aquatic plants and their associated micro-organisms to cleanse the water. The project involves considerable movement of silt and building up of soil structures in the form of pathways, bunds and islands (Jayaram, 1997 and Dilip Kumar, 2000).
The wetland system of Madivala is to be created by a series of ponds with aquatic plants like reeds or cattails, and inter-connecting pipes. A primary treatment plant is also provided to filter out the solid matter. Other features planned for improving the lake ecosystem include a "jogging path" along the margins of the tank, artificial islands at the center to increase the areas for water birds to nest and roost.;
Ulsoor lake situated in the north-east of the city receives inflow of sewage from the surrounding residential areas (Rao, 1997). The physico-chemical and bacteriological analysis of the lake water has revealed that the water is grossly polluted. The short term measures involves cleaning of the drains that bring storm-water into the lake, immediate deweeding of the lake to completely stop the sewage inflow into the lake and creating public awareness to keep the lake clean. The long term measures include desilting the lake, preventing encroachments by providing a continuous fence around the periphery of the lake and regular monitoring of the water quality of the lake.
The Kempambudhi tank situated in Bangalore North receives inflow of sewage from five sewage drains from the surrounding areas (Venkatraman, and Iyengar, 1997). In addition, the lake is used for dumping solid wastes, the tank bed is used as sanitary land-fill and encroachments can also be seen in the northern side. It is proposed to divert the sewage inflow by providing a tertiary treatment plan. The tank is silted up and hence needs to be desilted. The approximate cost of the whole project is expected to be around Rs. 4.0 crores.
Water hyacinth was used for the uptake of heavy metals in Kukkarahalli lake in Mysore city (Sudhira and Kumar, 2000). The influence of initial metal concentration on growth of plants for all metals reached a saturation concentration at 12 mgL-1. Of all the heavy metals nickel was found to be more toxic. The mature plants were highly resistant to increased metal concentrations than young plants, which could not sustain the increased metal concentrations. The study demonstrated the possible use of water hyacinth for removal of heavy metals from wastewater. The removal efficiency of BOD, COD and TSS by water hyacinth was 90 %, 70 % and 80 % respectively.
Top
15. BANGALORE WETLAND BIRDS :
Wetland and water birds make use of a variety of conditions, from dry zones and meadows bordering lakes to open water zones. On the basis of their size, the availability of food and suitable foraging conditions, different birds can occupy different parts of the lake. In Bangalore there are five major groups of water birds found based on the wetland zones they frequent. They are: (i) Open water birds, (ii) Waders and shoreline birds, (iii) Meadow and grassland birds, (iv) Birds of reed bed and other vegetation, and (v) Birds of open air space above wetlands (Krishna, 1996)
Ducks, geese, grebes, cormorants, kingfishers, terns, gulls and pelicans represent the open water birds. Stilt, greenshank, sandpipers, storks, ibises, spoonbill, herons and egrets tend to frequent shallow waters. The vegetated portions of the wetland are represented by rails, bitterns, coots, jacanas, moorhens, snipe, painted snipe etc.
In Bangalore birds were counted in one hundred and twenty one lakes in 1995 and 1996. Over three hundred and thirty species of birds were recorded representing around nineteen-bird families. The total number of birds counted in 1996 is twice the number counted in 1995. But a few species have shown a decline in the frequency of occurrence - Grey Heron (15.8%), Pied Kingfisher (9.1%) and Little ringed Plover (8.7%). Other species like Pariah, Brahminy Kites and Yellow, Grey and White Wagtails being less dependent on water have shown an increase. Cluster analysis and multivariate linear regression analysis was performed in assessing inter-relationships and correlating the bird populations with species richness. The results revealed that clean waters were positively associated with high number of species while the waters supporting algal blooms and muddy water supported less species diversity.
Of the sites analysed for the bird population in Bangalore the region supporting rich bird diversity extended from southwest of the city to northeast. The northwest and southeast part of the city supported less species as they were close to industrialised areas. Although the study indicated that the bird populations in Bangalore are not increasing or decreasing, they are not safe as the water bodies are dwindling at a fast rate and the ones existing are not pure to support a large diversity of water birds.
Top
16. WATERSHED-BASED APPROACH FOR SUSTAINABLE MANAGEMENT OF WETLANDS :
River, pond, wetlands, lake or estuary is an ultimate destination of all water running downhill through an area of land, which is referred as watershed. A watershed is a catchment basin that is bound by topographic features, such as ridge tops and perform primary functions of the ecosystem (http://www.gdrc.org). It plays a critical role in the natural functioning of the ecosystem such as
• Hydrologically, watersheds integrate the surface water run-off of an entire drainage basin. It captures water from the atmosphere. Ideally, all moisture received from the atmosphere, whether in liquid or solid form, has the maximum opportunity to enter the ground where it falls. The water infiltrates the soil and percolates downward. Several factors affect the infiltration rate, including soil type, topography, climate, and vegetative cover. Percolation is also aided by the activity of burrowing animals, insects, and earthworms.
• It stores rainwater once it filters through the soil. Once the watershed's soils are saturated, water will either percolate deeper, or runoff the surface. This can result in freshwater aquifers and springs. The type and amount of vegetation, and the plant community structure, can greatly influence the storage capacity in any one watershed. The root mass associated with healthy vegetative cover keeps soil more permeable and allows the moisture to percolate deep into the soil for storage. Vegetation in the riparian zone affects both the quantity and quality of water moving through the soil.
• Finally, water moves through the soil to seeps and springs, and is ultimately released into streams, rivers, and the ocean. Slow release rates are preferable to rapid release rates, which result in short and severe peaks instream flow. Storm events which generate large amounts of run-off can lead to flooding, soil erosion and siltation of streams.
• Ultimately, the moisture will return to the atmosphere by way of evaporation. The hydrologic cycle (the capture, storage, release, and eventual evaporation of water) forms the basis of watershed function. Economically, they play a critical role as sources of water, food, hydropower, recreational amenities, and transportation routes.
• Ecologically, watersheds constitute a critical link between land and sea; they provide habitat -- within wetlands, rivers, and lakes - for 40 percent of the world's fish species, some of which migrate between marine and freshwater systems.
• Watersheds also provide habitat within the terrestrial ecosystems such as forests and grasslands - for most terrestrial plant and animal species; and they provide a host of other ecosystem services -- from water purification and retention to flood control to nutrient recycling and restoration of soil fertility - vital to human civilizations.
Hence, watershed should be managed as a single unit. Each small piece of the landscape has an important role in the overall health of the watershed. Paying attention primarily to the riparian zone, an area critical to a watershed's release function, will not make up for lack of attention to the watershed's uplands. They play an equally important role in the watershed, the capture and storage of moisture. It is seamless management of the entire watershed, and an understanding of the hydrologic process, that ensures watershed health.
Each river system - from its headwaters to its mouth - is an integrated system and must be treated as such. The focus of water resource management is on wise and efficient use of water resources for such purposes as energy production, navigation, flood control, irrigation, and drinking water. It also places emphasis on improving ambient water quality. Watershed approach can provide benefits to individual citizens, the public sector, and the private sector. Individual citizens benefit when watershed protection improves the environment and the livability of an area. The watershed- wide participation of local citizens and organizations ensures that those who are most familiar with a watershed, its problems and possible solutions, play a major role in watershed stewardship. The private sector can benefit because the burden of water resource protection is distributed more equitably among pollution sources.
A comprehensive approach to water resource management is needed to address the myriad water quality problems that exist today from non-point and point sources as well as from habitat degradation. Watershed based planning and resource management is a strategy for more effective protection and restoration of aquatic ecosystems and for protection of human health. The watershed approach emphasizes all aspects of water quality, including chemical water quality (e.g., toxins and conventional pollutants), physical water quality (e.g., temperature, flow, and circulation), habitat quality (e.g., stream channel morphology, substrate composition, and riparian zone characteristics),and biological health and biodiversity (e.g., species abundance, diversity, and range).
To deal with non-point source pollution in an effective manner, a smaller and more comprehensive scale of analysis and management is required. While point source pollution control programs encourage identifying isolated polluters, non-point source strategies recognize that small sources of pollution are widely dispersed on the landscape and that the cumulative impacts of these pollutants on water quality and habitat are great. A whole basin approach to protecting water quality has proved most effective because it recognizes connected sub-basins. This includes
• Addressing issues of water quantity, protection of riparian areas, control of aquatic non-native species, and protection of water quality.
• Protecting the integrity of permanent and intermittent seeps, streams, rivers, wetlands, riparian areas, etc.
• Prioritising watersheds for protection and restoration and focus available resources on highest priorities. Also, identify subwatersheds in which to emphasize high water quality.
• Not implementing any timber management in riparian areas without proof that these activities actually increase coarse woody debris above natural levels and the benefits outweigh the risks (sedimentation, oil and fuel runoff, etc).
• Conducting a comprehensive all seasons water quality monitoring.
• Eliminating commercial logging and unrestrained recreation in municipal watersheds
Non-point source pollution poses a serious threat to the health of watersheds. It results from an accumulation of many small actions, and, although the individual impacts may seem minor, the combined cumulative effects are significant. Control measures and best management practices (BMPs)
exist that can be utilized for improved watershed health. The effectiveness of the measures varies, depending on the specific pollutants addressed; the watershed hydrology and characteristics, such as soils, slopes, type of vegetative cover, and the nature and extent of area development; the waterbodies in the watershed; and the sources of the pollution. Effectiveness also depends on correct application of the control measure or practice. All types of land uses have the potential to create non-point source pollution. Most of this pollution results from changes and disturbances on the land. Some key sources include residential areas, agricultural activities and forest practices.
Residential problems stem from neighborhoods containing typical single- or multi-family dwelling units. The problems arise from impervious surfaces that increase the flow and volume of runoff causing stream channel erosion and flooding, and from sedimentation from eroded lawns and gardens. Runoff can become contaminated by household chemicals such as fertilizers, pesticides and herbicides, paints, solvents, and street/auto contaminates like oil. The most effective control measures to address residential and non-point source pollution include
- public education
- use of vegetated swales and wetlands for contaminate filtration before runoff enters receiving streams
- sediment traps in stormwater systems
- stormwater retention (e.g. detached downspouts)
- landscape design for erosion control
- recycling and proper disposal of household chemicals and wastes
- proper maintenance of on site septic systems to reduce nutrient loading
- combined sewer overflow management
- vegetative planting and riparian enhancement of neighborhood streams
- street sweeping to reduce suspended solid loading and decrease heavy metals and phosphorus contamination to receiving streams
- planned development on steep slopes
- limited amount of impervious surface
- increased use of cluster developments
- utilization of erosion control ordinances, especially on construction sites
Agricultural Activities include land uses such as orchards, nurseries, crop production, feedlots, and grazing. Most non-point source pollution from agricultural practices comes from erosion or chemical contamination of receiving waters. The most effective control measures to address agriculture-related non-point source pollution include:
- riparian area protection and enhancement
- revised management practices for livestock grazing and manure handling
Forestry practices generally lead to nonpoint source pollution problems of soil erosion and chemical contamination. The most effective control measures to address these problems include:
- technical assistance to landowners
- limits on road building and management
- use of erosion control standards
- chemical application controls (pesticides and herbicides)
- riparian area protection and enhancement
This accentuates the need for healthier watersheds. Healthier watersheds would slow the runoff, increase percolation into underground aquifers, decrease siltation of waterways, and lengthen the flow period for the rivers. Watershed management has worked for over a century in Tinelvelli, where watershed recovered resulting in improved stream flow in less than five years when cattle grazing and fuelwood harvest were removed. The Palni Hills Conservation Council (PHCC) found that the watersheds of the Karavakurichi Reserve Forest improved in mere two years when fuelwood harvesters were given alternate employment in tree nurseries. Similar success stories are reported from dry arid districts like Ananthpur.
A wetland management program generally involves activities to protect, restore, manipulate, and provide for functions and values emphasizing both quality and acreage by advocating their sustainable usage. Management of wetland ecosystems require intense monitoring and increased interaction and co-operation among various agencies such as state departments concerned with the environment, soil, agriculture, forestry, urban planning and development, natural resource management; public interest groups; citizen's groups; research institutions; and policy makers.
Such management goals should not only involve buffering wetlands from any direct human pressures that could affect their normal functions, but also in maintaining important natural processes operating on them that may be altered by human activities. Wetland management has to be an integrated approach in terms of planning, execution, and monitoring, requiring effective knowledge on a range of subjects from ecology, hydrology, economics, watershed management, and local expertise, people, planners and decision makers. All these would help in understanding wetlands better and evolve a more comprehensive and long-term conservation and management strategies. Some of the suggested strategies in this regard are:
- The management strategies should involve protection of wetlands by regulating inputs, using water quality standards (WQS) promulgated for wetlands and such inland surface waters to promote their normal functioning from the ecosystem perspective, while still deriving economic benefits by sustainable usage.
- Urban wetlands provide multiple values for suburban and city dwellers. The capacity of a functional urban wetland in flood control, aquatic life support, and as pollution sink implies a greater degree of protection. These wetlands provide a resource base for people dependent on them. When dealing with such common resources, some of the important factors to be considered for developing a management strategy are described below.
i). Data relating to the current ecological condition of the wetlands is inadequate. This necessitates an immediate need to create a database on the wetland types, morphological, hydrological, and biodiversity data surrounding land use, hydrogeology, surface water quality, and socio-economic dependence. Such a database would highlight the stress these systems are subjected to in the given context.
ii). Involve institutions, colleges, and regulating bodies in conducting regular water quality monitoring of surface water, groundwater, and biological samples. Such programs help in providing technical support and information, which aid in understanding these systems better and formulating a comprehensive restoration, conservation, and management program.
iii). Development of a water quality database, accessible to all users, for analyzing and disseminating information. This can be achieved through:
• Exchanging data across departments involved in the program to allow easy accessibility to regularly and continuously monitored data;
• Updating technical guidance and water quality maps at regular intervals and indicating quality determinant parameters;
• Analyzing and discussing case studies of water quality issues;
• Providing spatial, temporal, and non-spatial water quality database systems.
iv). Correct non-point source pollution problems and administer the Pollution Prevention Program through environmental awareness programs.
v). Creating buffer zones for wetland protection, limiting anthropogenic activities around the demarcated corridor of the wetland, could revive their natural functioning. The criteria for determining adequate buffer zone size to protect wetlands and other aquatic resources depend on the following:
• Identifying the functional values by evaluating resources generated by wetlands in terms of their economic costs,
• Identifying the magnitude and the source of disturbance, adjacent land use, and project the possible impact of such stress in the long term,
• Identifying catchment characteristics-vegetation density and structural complexity, soil condition and factors.
vi). A fully formed functional In-buffer must consider the magnitude of the identified problems, the resource to be protected, and the function it has to perform. Such a buffer zone could consist of diverse vegetation along the perimeter of the water body, preferably an indigenous species, serving as a trap for the sediments, nutrients, metals and other pollutants, and reducing human impacts by limiting easy access and acting as a barrier to invasion of weeds and other stress inducing activities.
vii). Wetlands require collaborated research involving natural, social, and inter-disciplinary study aimed at understanding the various components, such as monitoring of water quality, socio-economic dependency, biodiversity, and other activities, as an indispensable tool for formulating long term conservation strategies. This requires multidisciplinary-trained professionals who can spread the understanding of wetland importance at local schools, colleges, and research institutions by initiating educational programs aimed at raising the levels of public awareness and comprehension of aquatic ecosystem restoration, goals, and methods.
Actively participating schools and colleges in the vicinity of the waterbodies may value the opportunity to provide hands-on environmental education which could entail setting up laboratory facilities at the site. Regular monitoring of waterbodies (with permanent laboratory facilities) would provide vital inputs for conservation and management.
viii). An interagency regulatory body comprising personnel from departments involved in urban planning (Bangalore Development Agency, and Bangalore City Corporation, for example) and resource management (Forest department, Fisheries, Horticulture, Agriculture, and so forth), and from regulatory bodies such as Pollution Control Board, local citizen groups, research organizations, and NGO's, would help in evolving effective wetland programs. These programs would cover significant components of the watershed, and need a coordinated effort from all agencies and organizations involved in activities that affect the health of wetland ecosystems directly or indirectly.
17. ACKNOWLEDGEMENTS :
The financial assistance from the Ministry of Environment and Forests, Governemnt of India and Commonwealth Of Learning (COL), Canada is acknowledged. We thank the Indian Institute of Science for academic, administrative and infrastructural support. We are grateful to Prof. N.V. Joshi, Prof. Sukumar, Prof. Devashish Kar, Prof. Rajasekara Murthy, Dr. M.B. Krishna and Dr. B.K. Chakrapani for useful suggestions. We thank Mr.Joshua Delay David for timely assistance while preparing this manscript. We thank Mr.Rajini Kanth, Mr.Kiran Rajashekariah, Ms. Ranjani V.G., Ms.Deepa, and Mr.Reddy M.S. for their support in data compilation, field investigations and laboratory analysis.
Top
18. REFERENCES :
• Ahmad N., 1980, Some aspects of economic resources of Sunderbans mangrove forests of Bangladesh . In: Mangrove environment :research and management, ed., P. Soepadmo, Pp 50 - 1. (Report on UNESCO Asian Symposium, held at University of Malaya, Kuala Lumpur, Malaysia , 25 - 29 August 1980).
• Anon, 1993, Directory of Indian Wetlands. World Wildlife Federation, New Delhi , Pp: 264.
• Anon, 1994, World Development Report. World Bank Development report, 1994. Pp - 254.
• Ashok Kumar, 1999, Sustainable Utilisation of water resource in Watershed Perspective A case study in Alaunja Watershed, Hazaribagh, Bihar . J of the Indian Society of Remote Sensing, Vol. 27, No. 1, Pp: 13-22.
• Bhargava D.S., 1994, Dal Lake Clean-up strategy: an example for others? Environmental conservation, Volume 21, 269 - 272.
• Brian Groombridge and Martin Jenkins, 1998, Freshwater Biodiversity: a preliminary global assessment. WCMC, Biodiversity Series No. 8. UNEP.
• Brij Gopal, 1995, Biodiversity in freshwater ecosystems including wetlands, Biodiversity and Conservation in India , A Status Report, Volume: 4, Zoological Survey of India, Calcutta
• Chakrapani B.K., 1996, Plankton and Water Quality of Lakes in and around Bangalore Comparisons between 1989 and 1995. A report on status, water quality, plankton and bird population of lakes in and around Bangalore and Maddur, Karnataka and India , Karnataka State Forest Department, Bangalore .
• Chakrapani B.K., 1996, The plankton communities of Bangalore and Maddur - A report on status, water quality, plankton and bird population of lakes in and around Bangalore and Maddur, Karnataka and India , Karnataka State Forest Department, Bangalore .
• Chakrapani B.K., and Ramakrishna Parama V.R., 1996, Quality of lake waters in and around Bangalore and Maddur - A report on status, water quality, plankton and bird population of lakes in and around Bangalore and Maddur, Karnataka and India , Karnataka State Forest Department, Bangalore .
• Chopra R., 1985, The state of India 's environment. New Delhi , Ambassador Press, Pp - 393
• Das S., Behera S.C., Kar A., Narendra P., and Guha S., 1997, Hydrogeomorphological Mapping in Ground Water Exploration Using Remotely Sensed Data A case study in Keonjhar District, Orissa. J of the Indian Society of Remote Sensing, Vol. 25, No. 4, Pp: 247 250.
• Deepa, R. S, Kiran, R, and Ramachandra, T. V (1997), Status of Wetlands in Bangalore- An Overview was presented at the International Seminar on Ecorestoration, Biodiversity Conservation and Sustainable Development", organized by the Environmental Research Academy, Vishakapatnam and International Socio-Environmental Awareness Studies Bangalore, held at Bangalore during December 1997 (in press).
• Deepa, R. S., and Ramachandra, T. V. (1999) Impact of Urbanisation in the interconnectivity of wetlands Paper presented at the National Symposium on Remote Sensing Applications for Natural Resources: Retrospective and perspective,(Jan 19-21,1999) organised by Indian Society of Remote Sensing, Bangalore.
• Deepa, R. S., Kiran, R and Ramachandra, T. V. (1997), Application of Geographical Information Systems (GIS) and remote sensing in the study of the spatial and temporal changes in the waterbodies of Bangalore , Karnataka was presented at the XII Annual Conference of National Environmental Science Academy (NESA), New Delhi .
• Deepa, R. S., Kiran, R and Ramachandra, T. V. (1999) Wetland inventory and Monitoring using Geographical Information System (GIS) was presented at a training workshop on Wetland Research Methodology: Measuring & Monitoring biodiversity (Jan 5-12,1999) organised by Wildlife Institute of India, Dehra Dun .
• Deepa, R.S., Ramachandra, T.V. and Kiran, R. (1998) Anthropogenic stress on Wetlands of Bangalore, in proceedings of the National seminar on " Environmental Pollution: Causes & Remedies " Pp.: 166-182, edited by Maheshappa. H and Ragavendra Rao. M. N (eds.), P. E. S. Institute of Technology, Bangalore .
• Devashish Kar., Nagarathna A.V., and Ramachandra T.V., 2000, Fish Diversity and Conservation Aspects in an Aquatic Ecosystem in India , INTECOL, 6 Th International Wetland Symposium, August 6 - 12, 2000 , Quebec , Canada . Organised by International Association of Ecology (http://www.cqvb.qc.ca/wetland2000/) and Society of Wetland Scientists (http://www.sws.org/intecol/abstracts_program/index.html http://www.sws.org/quebec2000/abstracts_program/index.html ).
• Dilip Kumar P.J., 2000, Restoration of Tanks- The need for ecological sensitivity in Symposium on Restoration of Lakes and Wetlands, 27-29 November 2000, Indian Institute of Science, Bangalore.
• Gopal B., 1994, Conservation of inland waters in India : an overview. Verhandlungen der Internationalen Vereinigung fur Theorestische und Angewandie Limnologie, Volume 25, Pp: 2494 - 2497.
• Government of India , 1991, India 1990: A reference annual: Research and Reference Division, Ministry of Information and Broadcasting, Government of India, Delhi , India , Pp: 910.
• Hazra P.B., and Bhattacharya B., 1999, River shifting and Bank failure problem of Ganga- Padma in West Bengal, 1999, Proceedings of ISRS National Symposium on Remote Sensing Applications for Natural Resources- Retrospective and Perspective. Pp-385-390.
• Hosmani S.P., and Vasanth Kumar L., 2000, Biochemical aspects of water pollution in two lakes of Bangalore city in Symposium on Restoration of Lakes and Wetlands, 27-29 November 2000, Indian Institute of Science, Bangalore.
• IUCN, 1990, Directory of Wetlands of International Importance, Ramsar Convention Bureau, Gland Switzerland , Pp: 796.
• Jayaram. C., 1997, Recycling of used water on a pilot scale at Madivala lake, In Proceedings of One Day Workshop on lakes for Bangalore Water needs Beautification and pollution Prevention, Environment association of Bangalore. Pp: 13 19.
• Jyoti Parikh and Kirit Parikh, 1999, Sustainable Wetlands, Environmental Governance 2, Indira Gandhi Institute of Development Research., Mumbai.
• Karnataka State Gazetteer, Part- 1, Government of Karnataka, Gazetteer of India , Government of Karnataka Publication, 1982.
• Kiran, R., Deepa, R.S., and Ramachandra, T. V. (1997), Assessment of the water quality of Kamakshipalya tank, Bangalore , Karnataka" was presented at the XII Annual Conference of National Environmental Science Academy (NESA), New Delhi .
• Kiran, R., Deepa, R.S., and Ramachandra, T. V. (1998) Comparative water quality assessment of Bannerghatta and Yediyur lakes of Bangalore, in proceedings of the National seminar on " Environmental Pollution: Causes & Remedies " Pp.: 166-182, Maheshappa. H and Ragavendra Rao . M. N (eds.), P. E. S. Institute of Technology, Bangalore .
• Klemas, V.V., Bartlett , D.S., and Murillo. M., 1980. Remote sensing of coastal environment and resources. Proceedings of the 14 th International Symposium on Remote Sensing of Environment.
• Klemas, V.V., Dobson, J.E., Ferguson , R.L., and Haddad, K.D. 1993. A Coastal land cover classification system for the NOAA Coastwatch change analysis Project. Journal of Coastal Research, 9(3): 862-872.
• Krishna M.B., 1996, Annual water bird census of Bangalore- A report on status, water quality, plankton and bird population of lakes in and around Bangalore and Maddur, Karnataka and India, Karnataka State Forest Department, Bangalore.
• Lee Foote, Sanjeeva Pandey, Naomi T. Krogman, 1996, Processes of Wetland Loss in India , Environmental Conservation, 23 (1), Pp: 45-54.
• Mahadeswara H.S., Nagaraju D., and Sajid S.A., Geological Control on Groundwater quality in Yelandur taluk, Chamrajnagar district, Karnataka, India in Symposium on Restoration of Lakes and Wetlands, 27-29 November 2000, Indian Institute of Science, Bangalore.
• Mitchell S and Gopal B., 1990, Invasion of tropical freshwater by alien species. In: Ecology of Biological invasion in the Tropics, ed. P.S. Ramakrishnan, Pp: 139 -154.
• Mohan S., and Shrestha M.N., 2000, A GIS based integrated model for assessment of hydrological changes due to land-use modifications in Symposium on Restoration of Lakes and Wetlands, 27-29 November 2000, Indian Institute of Science, Bangalore.
• Monitoring and evaluation of watersheds in Karnataka using Satellite Remote Sensing, Technical report (ISRO-NNRMS-TR-98-98) 1998, Regional Remote Sensing Service Centre, ISRO, Bangalore, State Watershed Development Programme.
• Pandit D.S., Srinivasan D.S., and Krishnamurthy Y.V.N., 1999, A semiautomated Software Package for Value added Rainfall- Runoff analysis VARUN. Proceedings of ISRS National Symposium on Remote Sensing Applications for Natural Resources- Retrospective and Perspective. Pp 397- 400.
• R.P. Barman, 1995, Status Report on Biodiversity: Pisces, Biodiversity and Conservation in India , A Status Report, Volume: 4, Zoological Survey of India , Calcutta .
• Rajinikanth .R., Ramachandra T.V., and Reddy M.S., 2001, Impact Assessment of River Valley Projects, National seminar on Environmental problems and Perspectives (June 2001) organised by Environmental Research Academy International (EnRA), Vishakapatnam.
• Rajiva Mohan., Vibhu Sarin., and Sudhakar Shukla., 1999, Remote Sensing and GIS application Proceedings of ISRS National Symposium on Remote Sensing Applications for Natural Resources- Retrospective and Perspective. Pp: 404 413.
• Rajinikanth R., and Ramachandra T.V., 2000, Status and Socio-Economic aspects of Wetlands in Symposium on Restoration of Lakes and Wetlands, 27-29 November 2000, Indian Institute of Science, Bangalore.
• Ramachandra T.V., and Rajasekara Murthy, 2001, Restoration of Lakes and Wetlands in Developing Countries, XXVIII SIL Congress, February 4 - 10, 2001, Melbourne, Australia (http:// www.monash.edu.au/oce/sil2001/scientific/36.html).
• Ramachandra, T.V. and Kiran, R. 2000. Status of Bangalore wetlands: Strategies for restoration, conservation and management, INTECOL, 6 Th International Wetland Symposium, August 6 - 12, 2000 , Quebec , Canada . Organised by International Association of Ecology (http://www.cqvb.qc.ca/wetland2000/) and Society of Wetland Scientists , USA http://www.sws.org/quebec2000/abstracts_program/index.html (http://www.sws.org/intecol/abstracts_program/index.html).
• Ramaraju H.K., 1995, Fighting Fluorosis in Kolar District, NISARGA, Karnataka State pollution Control Board. Vol. 1 (2,3), World Environment day, Spl. Issue.
• Ramsey III, E.W. and Laine S.C., 1997., Comparison of Landsat thematic mapper and high resolution photography to identify change in complex coastal wetlands, Journal of Coastal wetlands, 13 (2): 281-292.
• Ramsey III, E.W., 1995, Monitoring flooding in coastal wetlands by using radar imagery and ground-based measurements, Int. J. Remote Sensing, 16 (13): 2495-2502.
• Ranjani V.G., and Ramachandra T.V., Bathymetric Analysis and the characterisation of the Hebbal lake to explore restoration and management options in Symposium on Restoration of Lakes and Wetlands, 27-29 November 2000, Indian Institute of Science, Bangalore.
• Ranjeev Benjamin., Chakrapani, B.K., Devashish Kar., Nagarathana, A.V., and Ramachandra, T.V. (1996), Fish mortality in lakes of Bangalore city, India The Ecologist Asia , Vol 4(6): 5-7.
• Rao H.V.N., 1997, Restoration of Ulsoor lake, Bangalore , In Proceedings of One Day Workshop on lakes for Bangalore Water needs Beautification and pollution Prevention, Environment association of Bangalore . Pp: 20 24.
• Rege S.N., Shreedhara D.S., Jagadish D.S., Singh T.S., Murthy T.V.R., and Garg., 1996, Wetlands of Karnataka, Project report, Ministry of Environment and Forests, Karnataka State Remote Sensing Applications Centre, Bangalore and Space Applications Centre (ISRO), Ahmedabad.
• Saindranath Jonna, 1999, Remote-Sensing Application to Water Resources: Retrospective and Perspective in Proceedings of ISRS National Symposium on Remote Sensing Applications for Natural Resources- Retrospective and Perspective. Pp- 368-377.
• Savenije, H.H.G, and Pages J, 1992, Hypersalinity: a dramatic change in the hydrology of Sahelian estuaries. Journal of Hydrology, 135, Pp: 157-174.
• Sharma J.R., Gupta A.K., Pathak S., Rajawat A.S., Sharma D.C. , Srivastava K.S., and Vimal Soni, 1999, Results of the Remote Sensing Based studies on Reconstruction of the Course of River Saraswati in Western India . Proceedings of ISRS National Symposium on Remote Sensing Applications for Natural Resources- Retrospective and Perspective. Pp- 378-384.
• Sivaswamy R., Natarajan S., Palaniswami C., and Sellamuthu K.M., 1999, Application of GIS in developing Decision Support System for Annur sub-watershed in Coimbatore District, Tamil Nadu. Proceedings of ISRS National Symposium on Remote Sensing Applications for Natural Resources- Retrospective and Perspective. Pp- 401-403.
• Srinivasa Rao Y., Krishna Reddy T.V., and Nayudu P.T., 1997, Hydrogeomorphological Studies by Remote Sensing Applications in Niva River Basin , Chittoor district, Andhra Pradesh. J of the Indian Society of Remote Sensing, Vol. 25, No.3, Pp: 187 194.
• Srinivasa T.S., 1996, Status Survey of lakes in and around Bangalore and Maddur, A report on status, water quality, plankton and bird population of lakes in and around Bangalore and Maddur, Karnataka and India, Karnataka State Forest Department, Bangalore.
• Srivastava V.K., 1997, Study of the drainage pattern of the Jharia coalfield ( Bihar ) India , through Remote Sensing Technology, J of the Indian Society of Remote Sensing, Vol. 25, No.1, Pp: 41 - 46.
• Subramanian V., 1997, Bellandur and Hebbal lakes Pollution aspects and control measures, In Proceedings of One Day Workshop on lakes for Bangalore Water needs Beautification and pollution Prevention, Environment association of Bangalore . Pp: 25 36.
• Sudhira H.S. and V. S. Kumar., 2000, Monitoring of lake water quality in Mysore city, S ymposium on Restoration of Lakes and Wetlands, 27-29 November 2000, Indian Institute of Science, Bangalore .
• Talwar, P.K. 1991. Animal Resources of India , Protozoa to Mammalia, Zoological Survey of India . Pisces, Pp: 577 - 630.
• Venkatraman. R., and Iyengar, K.R.N., 1997, Restoration of Kempambudhi tank, In Proceedings of One Day Workshop on lakes for Bangalore Water needs Beautification and pollution Prevention, Environment association of Bangalore . Pp: 40 47.
• Weismiller, R.A., Kristof, S.J., Scholz, D.K., Anuta, P.E. and Momin , S.A. , 1977. Change detection in coastal zone environments. Photogrammatic Engineering and Remote Sensing, 43(12): 1533-1539.
• World Development Report, 1994, World Development Indicators. Oxford : Oxford University Press: Pp:254.
• Yamuna S.M., and Balasubramanian A., 2000,Water quality variations in the lakes of Mysore district, Karnataka, Symposium on Restoration of Lakes and Wetlands, 27-29 November 2000, Indian Institute of Science, Bangalore.
Top
19. ANNEXURE :
A List of Endangered and Threatened Fish Species (Talwar, 1991)
A. Endangered
Family : Cyprinidae |
Cyprinio semipolotus (McClelland) |
Raiamas bola (Hamilton Buchanan) |
Tor chelynoides (McClelland) |
|
|
|
Family : Cobitidae |
Enobarbichthys maculatus (Day) |
|
|
B. Threatened
Family : Notopteridae |
Notopterus chitala (Hamilton Buchanan) |
|
|
Family : Cyprinidae |
Labeo fimbriatus (Bloch) |
Labeo kontius (Jerdon) |
Labeo potail (Sykes) |
Cirrhinus cirrhosus (Bloch)
|
Conoproktopterus curmuca
( Hamilton Buchanan) |
Puntius carnaticus (Jerdon)
|
Putius jerdoni (Day)
|
Neolissochilus hexagonolepis
(McClelland) |
Schizothoraichthys progatus
(McClelland) |
Schizothorax richardsonii (Gray) |
Tor khudre (Sykes) |
Tor putitora (Hamilton Buchanan) |
|
|
Tor tor (Hamilton Buchanan) |
Family : Schilbeidae |
Silonia childreni Sykes |
|
|
Family : Pangasidae |
Pangasius pangasius (Hamilton Buchanan) |
|
Family : Sisoridae |
Bagarius baqarius (Hamilton Buchanan) |
|
ENDEMIC FISH SPECIES OF INDIA (Barman, 1995)
ORDER |
FAMILY |
GENUS |
| Anguilliformes |
Ophichthidae |
Pisodonophis chilkensis Chaudhuri |
| Clupeiformes |
Clupeidae |
Dayella malabaricus (Day) |
| Clupeiformes |
Clupeidae |
Nematolosa chanpole (Hamilton Buchanan) |
| Cypriniformes |
Cyprinidae |
Schizotherax kumaonensis Menon |
| Cypriniformes |
Cyprinidae |
Gymnocypris biswasi Talwar |
| Cypriniformes |
Cyprinidae |
Lepidopygopsis typus Raj |
| Cypriniformes |
Cyprinidae |
Schizothoraichthys (Schizothoraichthys)curvifrons Heckel |
| Cypriniformes |
Cyprinidae |
Schizothoraichthys (Schizothoraichthys) niger (Heckel) |
| Cypriniformes |
Cyprinidae |
Schizothoraichthys (Schizothoraichthys)micropogon (Heckel) |
| Cypriniformes |
Cyprinidae |
Schizothoraichthys (Schizothoraichthys)planifrons (Heckel |
| Cypriniformes |
Cyprinidae |
Schizothoraichthys (Schizothoraichthys) nasus (Heckel) |
| Cypriniformes |
Cyprinidae |
Schizothoraichthys (Schizothoraichthys) progastus (McClelland) |
| Cypriniformes |
Cyprinidae |
Chela dadidurjori Menon |
| Cypriniformes |
Cyprinidae |
Chela fasciata Silas |
| Cypriniformes |
Cyprinidae |
Salmostomaacinaces (Valenciennes) |
| Cypriniformes |
Cyprinidae |
Salmostoma boopis (Day) |
| Cypriniformes |
Cyprinidae |
Salmostoma horai (Silas) |
| Cypriniformes |
Cyprinidae |
Salmostoma novacula (Valenciennes) |
| Cypriniformes |
Cyprinidae |
Salmostoma orissaensis Banarescu |
| Cypriniformes |
Cyprinidae |
Salmostoma untrahi (Day), Esomus barbatus (Jerdon) |
| Cypriniformes |
Cyprinidae |
Danio assamensis Barman |
| Cypriniformes |
Cyprinidae |
Danio fraseri Hora and Mukerji |
| Cypriniformes |
Cyprinidae |
Danio horai Barman |
| Cypriniformes |
Cyprinidae |
Danio manipurensis Barman |
| Cypriniformes |
Cyprinidae |
Danio naganensis Chaudhuri |
| Cypriniformes |
Cyprinidae |
Danio neilgherriensis (Day) |
| Cypriniformes |
Cyprinidae |
Rasbera daniconius labiesa Mukerji |
| Cypriniformes |
Cyprinidae |
Amblypharyngodon chakaiensis Babu and Nair |
| Cypriniformes |
Cyprinidae |
Barilius bakeri Day |
| Cypriniformes |
Cyprinidae |
Barilius canarensis (Jerdon) |
| Cypriniformes |
Cyprinidae |
Barilius dogarsinghi Hora |
| Cypriniformes |
Cyprinidae |
Barilius evezardi Day |
| Cypriniformes |
Cyprinidae |
Barilius gatensis (Valenciennes) |
| Cypriniformes |
Cyprinidae |
Barilius hewesi Barman |
| Cypriniformes |
Cyprinidae |
Barilius jayarami Barman |
| Cypriniformes |
Cyprinidae |
Barilius nelsoni Barman |
| Cypriniformes |
Cyprinidae |
Barilius radiolatus (Gunther) |
| Cypriniformes |
Cyprinidae |
Puntius arenatus (Day) |
| Cypriniformes |
Cyprinidae |
Puntius arulius (Jerdon) |
| Cypriniformes |
Cyprinidae |
Puntius bovanicus (Day) |
| Cypriniformes |
Cyprinidae |
Puntius carnaticus (Jerdon) |
| Cypriniformes |
Cyprinidae |
Puntius caveriensis (Hora) |
| Cypriniformes |
Cyprinidae |
Puntius chilinoides (McClelland) |
| Cypriniformes |
Cyprinidae |
Puntius deccanensis Yazdani and Rao |
| Cypriniformes |
Cyprinidae |
Puntius denisonii (Day) |
| Cypriniformes |
Cyprinidae |
Puntius fraseri (Hora and Mukerji) |
| Cypriniformes |
Cyprinidae |
Puntius fasciatus (Jerdon) |
| Cypriniformes |
Cyprinidae |
Puntius jerdoni (Day) |
| Cypriniformes |
Cyprinidae |
Puntius malabaricus Jerdon |
| Cypriniformes |
Cyprinidae |
Puntius melanostigma (Day) |
| Cypriniformes |
Cyprinidae |
Puntius narayani Hora |
| Cypriniformes |
Cyprinidae |
Puntius neilli (Day) |
| Cypriniformes |
Cyprinidae |
Puntius parrah Day |
| Cypriniformes |
Cyprinidae |
Puntius pulchellus (Day) |
| Cypriniformes |
Cyprinidae |
Puntius roseipinnis (Valenciennes) |
| Cypriniformes |
Cyprinidae |
Puntius sahydriensis Silas |
| Cypriniformes |
Cyprinidae |
Puntius sarana subnasutus (Valenciennes) |
| Cypriniformes |
Cyprinidae |
Puntius shahynius Yazdani and Talukdar |
| Cypriniformes |
Cyprinidae |
Puntius spinolosus (McClelland) |
| Cypriniformes |
Cyprinidae |
Gonoproktopterus curmuca (Hamilton Buchanan) |
| Cypriniformes |
Cyprinidae |
Gonoproktopterus dubius (Day) |
| Cypriniformes |
Cyprinidae |
Gonoproktopterus kolus (Sykes) |
| Cypriniformes |
Cyprinidae |
Gonoproktopterus lithopidos (Day) |
| Cypriniformes |
Cyprinidae |
Gonoproktopterus micropogon (Valenciennes) |
| Cypriniformes |
Cyprinidae |
Gonoproktopterus thomassi (Day) |
| Cypriniformes |
Cyprinidae |
Neelissochilus wynaadensis(Day) |
| Cypriniformes |
Cyprinidae |
Rohtee (Rohtee) ogilbii Sykes |
| Cypriniformes |
Cyprinidae |
Osteobrama bakeri (Day) |
| Cypriniformes |
Cyprinidae |
Osteobrama cotie peninsularis Silas |
| Cypriniformes |
Cyprinidae |
Osteobrama dayi Hora and Misra |
| Cypriniformes |
Cyprinidae |
Osteobrama neilli (Day) |
| Cypriniformes |
Cyprinidae |
Osteobrama vigorsii (Sykes) |
| Cypriniformes |
Cyprinidae |
Schismatorhynchus (Nukta) nukta (Sykes) |
| Cypriniformes |
Cyprinidae |
Labeo ariza (Hamilton Buchanan) |
| Cypriniformes |
Cyprinidae |
Labeo kawrus (Sykes) |
| Cypriniformes |
Cyprinidae |
Labeo kontius (Jerdon) |
| Cypriniformes |
Cyprinidae |
Labeo nigrescens Day |
| Cypriniformes |
Cyprinidae |
Labeo potail (Sykes) |
| Cypriniformes |
Cyprinidae |
Labeo udaipurensis Tilak |
| Cypriniformes |
Cyprinidae |
Tor mussullah (Sykes) |
| Cypriniformes |
Cyprinidae |
Tor progenius (McClelland) |
| Cypriniformes |
Cyprinidae |
Cirrhinus cirrhosus (Bloch) |
| Cypriniformes |
Cyprinidae |
Cirrhinus fulungee (Sykes) |
| Cypriniformes |
Cyprinidae |
Cirrhinus macrops Steindachner |
| Cypriniformes |
Cyprinidae |
Osteochilus (Osteochilichthys) nashii (Day) |
| Cypriniformes |
Cyprinidae |
Osteochilus (Osteochilichthys) themassi (Day) |
| Cypriniformes |
Cyprinidae |
Osteochilus (Ostecohilichthys) godavariensis (Rao) |
| Cypriniformes |
Cyprinidae |
Osteochilius (Kantaka) brevidorsalis (Day) |
| Cypriniformes |
Cyprinidae |
Garra gotyla stenorhynchus (Jerdon) |
| Cypriniformes |
Cyprinidae |
Garra bicornuta Rao |
| Cypriniformes |
Cyprinidae |
Garra hughi Silas |
| Cypriniformes |
Cyprinidae |
Garra kempi Hora |
| Cypriniformes |
Cyprinidae |
Garra lissorhynchus (McClelland) |
| Cypriniformes |
Cyprinidae |
Garra mcClellandi (Jerdon) |
| Cypriniformes |
Cyprinidae |
Garra mullya (Sykee) |
| Cypriniformes |
Cyprinidae |
Garra naganensis Hora |
| Cypriniformes |
Cyprinidae |
Garra rupecola (McClellandi) |
| Cypriniformes |
Parasilerhynchidae |
Parapsilorhynchus discopherus Hora |
| Cypriniformes |
Parasilerhynchidae |
Parapsilorhynchus prateri Hora and Misra |
| Cypriniformes |
Parasilerhynchidae |
Parapsilorhynchus tentaculatus (Annandale) |
| Cypriniformes |
Balotoridae |
Bhavania australis Jerdon |
| Cypriniformes |
Balotoridae |
Travanchoria jonesi Hora |
| Cypriniformes |
Balotoridae |
Balitora mysorensis Hora |
| Cypriniformes |
Balotoridae |
Aborichthys elongatus Hora |
| Cypriniformes |
Balotoridae |
Aborichthys garoensis Hora |
| Cypriniformes |
Balotoridae |
Aborichthys tikaderi Hora |
| Cypriniformes |
Balotoridae |
Noemacheilus rupecola (McClelland) |
| Cypriniformes |
Balotoridae |
Noemacheilus carletoni Fowler |
|
Balotoridae |
Noemacheilus deonensis Tilak and Hussain |
| Cypriniformes |
Balotoridae |
Noemacheilus devdevi Hora |
| Cypriniformes |
Balotoridae |
Noemacheilus himachalensis Menon |
| Cypriniformes |
Balotoridae |
Noemacheilus montanus (McClelland) |
| Cypriniformes |
Balotoridae |
Noemacheilus gangeticus Menon |
| Cypriniformes |
Balotoridae |
Noemacheilus scaturigina (McClelland) |
| Cypriniformes |
Balotoridae |
Noemacheilus deniseni denisoni Day |
| Cypriniformes |
Balotoridae |
Noemacheilus denisoni dayi Hora |
| Cypriniformes |
Balotoridae |
Noemacheilus denisoni mukambbikaensis Menon |
| Cypriniformes |
Balotoridae |
Noemacheilus denisoni pambaensis Menon |
| Cypriniformes |
Balotoridae |
Noemaceilus nilgiriensis Menon |
| Cypriniformes |
Balotoridae |
Noemacheilus kodaguensis Menon |
| Cypriniformes |
Balotoridae |
Noemacheilus semiarmatus Day. |
| Cypriniformes |
Balotoridae |
Noemacheilus striatus Day |
| Cypriniformes |
Balotoridae |
Noemacheilus naganensis Menon |
| Cypriniformes |
Balotoridae |
Noemacheilus singhi Menon |
| Cypriniformes |
Balotoridae |
Noemacheilus manipurensis Chaudhuri |
| Cypriniformes |
Balotoridae |
Noemacheilus prashadi Hora |
| Cypriniformes |
Balotoridae |
Noemacheilus arunachalensis Menon |
| Cypriniformes |
Balotoridae |
Noemacheilus elongatus (Sen and Nalbant) |
| Cypriniformes |
Balotoridae |
Noemacheilus botia (Hamilton Buchanan) |
| Cypriniformes |
Balotoridae |
Noemacheilus moreh (Sykes) |
| Cypriniformes |
Balotoridae |
Noemacheilus pavonaceous (McClelland) |
| Cypriniformes |
Balotoridae |
Noemacheilus anguilla Annandale |
| Cypriniformes |
Balotoridae |
Noemacheilus monilis Hora |
| Cypriniformes |
Balotoridae |
Noemacheilus ruppelli (Sykes) |
| Cypriniformes |
Balotoridae |
Noemacheilus guentheri Day |
| Cypriniformes |
Balotoridae |
Noemacheilus pulchellus Day |
| Cypriniformes |
Balotoridae |
Noemacheilus petrubanarescui Menon |
| Cypriniformes |
Balotoridae |
Noemacheilus triangularis Day |
| Cypriniformes |
Balotoridae |
Noemacheilus reticulofasciatus (Singhi and Banarescu) |
| Cypriniformes |
Balotoridae |
Noemacheilus sijuensis Menon |
| Cypriniformes |
Balotoridae |
Noemacheilus evezardi Day |
| Cypriniformes |
Balotoridae |
Noemacheilus keralensis (Rita and Nalbant) |
| Cypriniformes |
Balotoridae |
Triplophysa ladacensis (Gunther) |
| Cypriniformes |
Balotoridae |
Triplophysa miscrops (Steindachner) |
| Cypriniformes |
Balotoridae |
Triplophysa shehensis Tilak |
| Cypriniformes |
Cobitidae |
Enobarbichthys maculatus (Day) |
| Cypriniformes |
Cobitidae |
Lepidocephalus annandalei (Chaudhuri) |
| Cypriniformes |
Cobitidae |
Lepidocephalus caudefurcatus Tilak and Hussain |
| Cypriniformes |
Cobitidae |
Lepidocephalus goalparensis (Pillai and Yazdani) |
| Cypriniformes |
Cobitidae |
Lepidocephalus irrorata (Hora) |
| Cypriniformes |
Cobitidae |
Neoeucirrhichthys maydelli Banarescu and Nalbant) |
| Cypriniformes |
Cobitidae |
Botia birdi Chaudhuri |
| Cypriniformes |
Cobitidae |
Botia birdi Rao |
| Siluriformes |
Bagridae |
Rita chrysea (Day) |
| Siluriformes |
Bagridae |
Rita gogra (Sykes) |
| Siluriformes |
Bagridae |
Batasia travancoria Hora and Law |
| Siluriformes |
Bagridae |
Rama chandramara (Hamilton Buchanan) |
| Siluriformes |
Bagridae |
Horabagrus brachysoma Gunther |
| Siluriformes |
Bagridae |
Mystus krishnensis Ramakrishniah |
| Siluriformes |
Bagridae |
Mystus malabaricus (Jerdon) |
| Siluriformes |
Bagridae |
Mystus montanus (Jerdon) |
| Siluriformes |
Bagridae |
Mystus oculatus (Valenciennes) |
| Siluriformes |
Bagridae |
Mystus punctatus (Jerdon) |
| Siluriformes |
Siluridae |
Ompok malabaricus (Valenciennes) |
| Siluriformes |
Siluridae |
Pinniwallage kanpurensis Gupta,Jayaram and Hajela |
| Siluriformes |
Siluridae |
Silurus wynaadensis Day |
| Siluriformes |
Siluridae |
Pseudeutropius mitchelli Gunther |
| Siluriformes |
Siluridae |
Neotropius khavalchor Kulkarni |
| Siluriformes |
Siluridae |
Clupisema bastari Datta and Karmakar |
| Siluriformes |
Siluridae |
Silenia childreni (Sykes) |
| Siluriformes |
Siluridae |
Proeutropiichthys taakree taakree (Sykes) |
| Siluriformes |
Siluridae |
Eutropiichthys goongwaree (Sykes) |
| Siluriformes |
Siseridae |
Gagata sexualis Tilak |
| Siluriformes |
Siseridae |
Erethistoides montana montana Hora |
| Siluriformes |
Siseridae |
Erethistoides montana pipri Hora |
| Siluriformes |
Siseridae |
Hara horai Misra |
| Siluriformes |
Siseridae |
Conta conta (Hamilton Buchanan) |
| Siluriformes |
Siseridae |
Laguvia kapuri Tilak and Hussain |
| Siluriformes |
Siseridae |
Laguvia shawi Hora |
| Siluriformes |
Siseridae |
Glyptothorax anamaliensis Silas |
| Siluriformes |
Siseridae |
Glyptothorax alaknandi Tilak |
| Siluriformes |
Siseridae |
Glyptothorax coheni Ganguly, Datta and Sen |
| Siluriformes |
Siseridae |
Glyptothorax conirostrae peonaensis Hora |
| Siluriformes |
Siseridae |
Glyptothorax dakpathari Tilak and Hussain |
| Siluriformes |
Siseridae |
Glyptothorax garhwali Tilak |
| Siluriformes |
Siseridae |
Glyptothorax housei Herre |
| Siluriformes |
Siseridae |
Glyptothorax lonah (Sykes) |
| Siluriformes |
Siseridae |
Glyptothorax madraspatanum (Day) |
| Siluriformes |
Siseridae |
Glyptothorax nelsoni Ganguly, Datta and Sen |
| Siluriformes |
Siseridae |
Glyptopterus saisii (Jenkins) |
| Siluriformes |
Siseridae |
Glyptopterus steliczkae (Steindachner) |
| Siluriformes |
Siseridae |
Glyptopterus trewavasae Hora |
| Siluriformes |
Siseridae |
Exostoma labiatum (McClelland) |
| Siluriformes |
Clariidae |
Clarias dayi Hora |
| Siluriformes |
Clariidae |
Horaglanis krishnai Menon |
| Siluriformes |
Clariidae |
Clarias dussumieri Valenciennes |
| Siluriformes |
Olyridae |
Olyra kempi Chaudhuri |
| Cyprinodontiformes |
Hemiramphidae |
Hyporhamphus xanthopterus (Valenciennes) |
| Cyprinodontiformes |
Hemiramphidae |
Dermogenys brachynotopterus (Bleeker) |
| Cyprinodontiformes |
Horaichthyidae |
Horaichthys setnai Kulkarni |
| Cyprinodontiformes |
Synbranchidae |
Monopterus fossorius (Nair) |
| Cyprinodontiformes |
Synbranchidae |
Monopterus indicus (Silas and Dawson) |
| Cyprinodontiformes |
Chandidae |
Parambassis thomassi (Day) |
| Cyprinodontiformes |
Nandidae |
Pristolepis marginata Jerdon |
| Cyprinodontiformes |
Cichlidae |
Etroplus canarensis Day |
| Cyprinodontiformes |
Gobiidae |
Chiramenu fluviatilis Rao |
| Cyprinodontiformes |
Gobiidae |
Silhouettea indicus Rao |
| Cyprinodontiformes |
Gobiidae |
Acentrogobius madraspatensis Day |
| Cyprinodontiformes |
Gobiidae |
Acentrogobius masoni (Day) |
| Cyprinodontiformes |
Gobiidae |
Acentrogobius griseus (Day) |
| Cyprinodontiformes |
Gobiidae |
Stigmatogobius minima (Hora) |
| Cyprinodontiformes |
Gobiidae |
Bathygobius ostreicola (Chaudhuri) |
| Cyprinodontiformes |
Gobiidae |
Parapocryptes rictuosus (Valenciennes)) |
| Cyprinodontiformes |
Gobiidae |
Callogobius seshaiyai Jacob and Rangarajan |
| Cyprinodontiformes |
Eleotrididae |
Incara multisquamatus Rao |
| Cyprinodontiformes |
Mastacembelidae |
Macrognathus guentheri (Day) |
| Cyprinodontiformes |
Chaudhuriidae |
Chaudhuria indica (Yazdani) |
| Cyprinodontiformes |
Chaudhuriid |
Chaudhuria khajuriai (Talwar, Yazdani and Kundu) |
| Tetraodontiformes |
Tetraodontidae |
Tetraodon travancoricus Hora and Nair |
MONOTYPIC GENERA OF FISHES FOUND IN INDIA (Barman, 1995)
Order |
Family |
Genus |
Species |
Orectolobiformes |
Rhiniodontidae |
Rhiniodon Smith |
R. typus Smith |
|
Stegostomatidae |
Stegostoma Muller and Henle |
S.fasciatum (Hermann) |
|
Ginglymostomatidae
|
Nebrius Ruppell
|
N.ferrugineus (Lesson)
|
Hexanchiformes |
Hexanchidae |
Heptranchias Rafinesque |
H. perlo (Bonnaterre) |
Carcharhiniformes |
Hemigaleidae |
Chaenogaleus Gill |
C.macrostoma (Bleeker) |
|
|
Hemigaleus Bleeker |
H. microstoma Bleeker |
|
|
Hemipristis Agassiz |
H.elongatus (Klunziger) |
|
Carcharhinidae |
Galeocerdo Muller and Henle |
G. cuvieri (Peron and Le Sueur) |
|
|
Lamiopsis Gill |
L.temmincki (Muller and Henle) |
|
|
Loxodon Muller and Henle |
L.macrorhinus Muller and Henle |
|
|
Prionace Cantor |
P. glauca (Linnaeus) |
|
|
Scoliodon Muller and Henle |
S. laticaudus Muller and Henle |
|
|
Triaenodon Muller and Henle |
T. obseus (Ruppell) |
|
Sphyridae |
Eusphyra Gill |
E. blochii (Cuvier) |
Pristiformes
|
Pristidae |
Anoxypristis White and May-Thomas |
A. cuspidata (Latham)
|
Rajiformes |
Rhinobatidae |
Rhina Schneider |
R.ancylostoma Schneider |
Myliobatiformes |
Dasyatidae |
Hypolophus Muller and Henle |
H. sephen (Forsskal) |
Anguilliformes |
Muraenidae |
Thyrsoidea Kaup |
T. macrura (Bleeker) |
0 |
Muraenesocidae |
Gavialiceps Wood-Mason |
G.taenila (Wood-Mason) |
Clueiformes |
Clupeidae |
Dayella Talwar and Whitehead |
D. malabaricus (Day) |
|
|
Ehirava Deraniyagala |
E.fluviatilis Deraniyagala |
|
|
Hilsa Regan |
H. kelee (Regan) |
|
Pristigasteridae
|
Raconda Gray
|
R. russelianna Gray
|
Gonorhynchiformes |
Chanidae |
Chanos Lacepede |
C. chanos (Forsskal |
Cypriniformes |
Cyprinidae |
Lepidopygopsis Raj |
L. typus Raj |
|
|
Diptychus Steindachner |
D.maculatus Steindachner |
|
|
Ptychobarbus Steindachner |
P.conirostris Sterndachner |
|
|
Oreichthys H. M. Smith |
O.cosautis ( Hamilton Buchanan) |
|
|
Rohtee Sykes |
R. ogilbii Sykes |
|
|
Securicula Gunther |
S. gora ( Hamilton Buchanan |
|
|
Bengala Gray |
B. elanga ( Hamilton Buchanan) |
|
|
Catla Valenciennes |
C. catla ( Hamilton Buchanan) |
|
Balitoridae
|
Bhavania Hora
Travancoria Hora |
B. australis Jerdon
T. jonesi Hora |
|
Cobitidae |
Enobarbichthys Whitley |
E. maculata (Day) |
|
|
Neoeucirrhichthys Banarescu and Nalbant |
N. maydelli Banarescu and Nalbant |
|
|
Somileptes Swainson |
S. gongota ( Hamilton Buchanan) |
Siluriformes |
Bagridae |
Horabagrus Jayaram |
H.brachysoma (Gunther) |
|
|
Rama Bleeker |
R.chandramara ( Hamilton Buchanan) |
|
Siluridae |
Wallago Bleeker |
W. attu (Schneider) |
|
|
Pinniwallago Gupta, Jayaram and Hajela |
P. kanpurensis Gupta, Jayaram and Hajela |
|
Schilbeidae |
Neotropius Kulkarni |
N. khavalchor Kulkarni |
|
|
Proeutropiichthys Hora |
P. takree takree (Sykes) |
|
Amlycipitidae
|
Amblyceps Blyth |
A. mangois ( Hamilton Buchanan) |
|
Sisoridae |
Conta Hora |
C. conta ( Hamilton Buchanan) |
|
|
Coraglanis Hora and Silas |
C.kishinouyei (Kimura) |
|
|
Erethis toides Hora |
E. montana montana Hora |
|
|
Pseudecheneis Blyth |
P.sulcatus (McClelland) |
|
|
Sisor Hamilton Buchanan |
S.rhabdophrus Hamilton Buchanan |
|
Clariidae |
Horaglanis Menon |
H. krishnai Menon |
|
Ariidae |
Ketengus Bleeker |
K. typus Bleeker |
|
|
Batrachocephalus Bleeker |
B. mino ( Hamilton Buchanan) |
|
|
Osteogeneiosus Bleeker |
O. militaris (Linnaeus) |
Stomiiformes |
Gonostomatidae |
Triplophos |
T. hemingi (Mc Ardle) |
Aulopiformes |
Synodontidae |
Trachinocephalus Gill |
T. myops (Schneider) |
Ophidiiformes |
Ophidiidae |
Tauredophidium |
T. hextii Alcock |
|
|
Spottebrutula |
S. mahodadi |
Lophiiformes |
Lophiidae |
Lophiomus |
L. sp. |
Cyprinodontiformes |
Hemiramphidae |
Euleptorhamphus Gill |
E.viridas (Van Hasselt) |
|
Belonidae |
Xenetodon Regan |
X. cancila ( Hamilton Buchanan) |
|
Horaichthyidae |
Horaichthys Kulkarni |
|
Zeiformes |
Zeidae |
Cyttopsis |
C. roseus (Lowe |
Perciformes |
Ambassidae |
Chanda Hamilton Buchanan |
C. nama Hamilton Buchanan |
|
Centropomidae |
Psammoperca Richardson |
P. waigiensis (Cuvier) |
|
Serranidae |
Cromileptes Swainson |
C. altivelis ( Valenciennes |
|
Sillaginidae |
Sillaginopsis Gill |
S. panijus ( Hamilton Buchanan) |
|
Lactariidae |
Lactarius Valenciennes |
L. lactarius (Schneider) |
|
Rachycentridae |
Rachycentron Kaup |
R. canadum (Linnaeus) |
|
Carangidae |
Atropus Oken |
A. atropus (Schneider) |
|
|
Elagatis Bennett |
E. bipinnulata (Quoy and Gaimard) |
|
|
Gnathanodon Bleeker |
G. speciosus (Forsskal) |
|
|
Megalaspis Bleeker |
M. cordyla (Linnaeus) |
|
|
Naucrates Rafinesque |
N. ductor (Linnaeus) |
|
|
: Selaroides Bleeker |
S. leptolepis (Cuvier) |
|
|
Seriolina Wakiya |
S. nigrofasciata (Ruppell) |
|
|
Ulna Jordan and Snyder |
U. mentalis (Cuvier) |
|
Apolectidae |
Apolectus Cuvier |
A. Niger (Bolch) |
|
Menidae |
Mene Lacepede |
: M. maculata (Bloch and Schneider) |
|
Lutjanidae |
Aprion Valenciennes |
A. virescens Valenciennes |
|
|
Lipocheilus Anderson, Talwar and Jonhnson |
L. carnolabrum (Chan) |
|
Caesionidae |
Dipterygonotus Bleeker |
D. balteatus ( Valenciennes ) |
|
|
Gymnocaesio Bleeker |
G. gumnoptera (Bleeker) |
|
Lobotidae |
Lobotes Cuvier |
L. surinamensis (Bloch) |
|
Datnioididae |
Datnioides Bleeker |
D. quadrifasciatus (Sevastianov) |
|
Gerreidae |
Pentaprion Bleeker |
P. lengimanus (Contor) |
|
Haemulidae |
Diagramma Oken |
D. pictum (Thunberg) |
|
Sparidae |
Crenidens Valenciennes |
C. crenidens (Forsskal) |
|
Lethrinidae |
Gnathodentex Bleeker |
G. aureolineatus (Lacepede) |
|
|
Monotaxis Bennett |
M. grandoculis (Forsskal) |
|
|
Wattsia Cham and Chilvers |
W. mossambica (Smith) |
|
Sciaenidae |
Macrospinosa Mohan |
M. Cuba ( Hamilton Buchanan) |
|
|
Chrysochir Trewavas and Yazdani |
C. aureus ( Richardson ) |
|
|
Daysciaena Talwar |
D. albida (Cuvier) |
|
|
Dendrophysa Trewavas |
D. russelli (Cuvier) |
|
|
Kathala Mohan |
K. axillaris (Cuvier) |
|
|
Otolitheides Fowler |
O. biauritus (Contor) |
|
|
Paranibea Trewavas |
P. semiluctuosa (Cuvier) |
|
|
Protonibea Trewavas |
P.diacanthus (Lacepede) |
|
Ephippididae |
Ephippus Cuvier |
E. orbis (Bloch) |
|
|
Tripterodon Playfair |
T. orbis Playfair |
|
Nandidae |
Badis Bleeker |
B. badis ( Hamilton Buchanan) |
|
Mugilidae |
Rhinomugil Gill |
R. corsula ( Hamilton Buchanan) |
|
|
R.corsula ( Hamilton Buchanan) |
0 |
|
Uranoscopidae |
Pleuroscopus |
P. sp. |
|
Gobiidae |
Chiramenu Rao |
C. fluviatilis Rao |
| |
|
Apocryptes Valenciennes |
A. bato ( Hamilton Buchanan) |
|
|
Oxuderces Eydoux and Souleyet |
O. dentatus Eydoux and Souleyet |
|
Eleotrididae |
Incara Rao |
I. multisquamatus Rao |
|
|
Ophieleotris Aurich |
O. aporas (Bleeker) |
|
|
Ophiocara Gill |
O. porocephala ( Valenciennes ) |
|
Gobioididae |
Odontamblyopus Bleeker |
O. rubicundus ( Hamilton Buchanan) |
|
Acanthuridae |
Paracanthurus Bleeker |
P. hepatus (Linnaeus) |
|
Scombridas |
Acanthocybium Gill |
A. solandri (Cuvier) |
|
|
Gymnosarda Gill |
G. unicolor (Ruppell) |
|
|
Katsuwonus Kishinouye |
K. pelamis (Linnaeus) |
| |
Xiphiidae |
Xiphias Linnaeus |
X. gladius Linnaeus |
|
Belontiidae |
Ctenops McClelland |
C. nobilis McClelland |
|
Callionymidae |
Eleutherochir Bleeker |
E. opercularis ( Valenciennes ) |
Tetraodontiformes |
Tetraodontidae |
Takifugu Abe |
T. oblonugs Abe |
|
|
Amblyrhynchotes |
A. sp. |
|
Triacanthodiae |
Tydemanis M. Weber |
T. navigatoris Weber |
|
|
Mephisto |
M. sp. |
|
Triacanthidae |
Pseudetriacanthus Fraser-Brunner |
P. strigilifer (Cantor) |
|
|
Trixiphichthys |
T. weberi (Chaudhuri) |
|
Balistidae |
Abalistes Jordan and Seale |
A. stellaris (Bloch) |
|
Diodontidae |
Chilomycterus |
C. sp |
| |
|
Lophodiodon |
L. calori (Bianconi) |
|
Molidae |
Ranzania Nardo |
R. laevis (Pennant) |
|
|
Mola Koelreuter |
M. mola (Linnaeus) |
Top