Keywords: Natural resources, grid-based inventorying, mapping, monitoring, prioritisation, conservation, management, sustainable development
1.0 Introduction
Natural resources are resources available in the nature providing for human well-being. They include a wide range of resources, biotic and abiotic, found in the form of stock resources (resources that take millions of years to form and considered non renewable like fossil fuels) and flow resources (can be renewed within a short lifespan like water, air, and plant life. There is a strong correlation between the management of natural resources with their ecosystem and the welfare of the humans. Ecosystems provide a range of services that are of beneficial and more importantly, fundamental to human well-being, health, livelihoods, and survival (Costanza et al., 1997; Millennium Ecosystem Assessment (MEA), 2005; TEEB Foundations, 2010; TEEBSynthesis, 2010). This heavy dependency on the mankind on ecosystems and its natural resources for its sustenance has resulted in their degradation and in some cases,annihilation. The Millennium Impact Assessment of 2005 notes that humans have made unprecedented changes to the natural world in recent decades just to meet their growing demands for food, water and energy. Around 60 percent of global ecosystem services have been degraded in just 50 years (ten Brink, 2011). The state of Karnataka has an urban population of 37% and is currently ranked as the fifth most urbanized state in India (State of Environment Report, 2015)With an increase in population, the demand for the natural resources to provide for its well-being also tremendously increases. As a developing economy, Karnataka’s heavy dependency on the natural resource wealth for economic development is depleting the very resource base. To mitigate this, conservative urban planning, keeping into account the sustenance of natural resources and people’s livelihood aspects should be deployed. The government needs to play a pivotal role in planning sustainable cities catering to a healthy urban environment and the sustenance of natural resources (Ramachandra and Aithal, 2017).
“Sustainable development of a region requires a synoptic ecosystem approach that relates to the dynamics of natural variability and the effects of human interventions on key indicators of biodiversity and productivity” (Ramachandra et al. 2007). Periodic accounting of the extraction of natural resourcesto meet theever-growingdemandand their ability to cope up with the same can help us devise appropriate conservation and management strategies. Decision-making based on the biophysical, economic and socio-cultural information provides an opportunity to overcome these constraints while ensuring sustainability of natural resources (Opdam et al. 2006; Watson et al. 2011).Effective long-term monitoring (of biological, habitat, and hydro- logical effects) and mapping of natural resources would help in formulating strategies to mitigate the impact of developmental projects (Ramachandra et al., 2016) and would enable policy makers to design, implement, and evaluate effective environmental policies (Lovett et al., 2007).Thelatteris possible for the concepts of natural capital stocks are useful ways to highlight, measure, and value the degree of interdependence between humans and the rest of nature (Costanza et al., 2014). A promising approach in thisregard is the identification of ‘hotspots’, or areas featuring exceptional concentrations of endemic species and experiencing exceptional loss of habitat (Myers et al., 2000).
This study attempts at delineating the Natural Resource Importance (NRI) Zones in the districts of Bidar and Uttara Kannada in the state of Karnataka, India. NRI Zones are bio-climatic units of high biotic and abiotic richness identified through quantitative aggregation of the quality of various natural recourses available in the unit, which need to be given the priority status while devising conservation and sustainable management strategies based in their zonation. Grid-based strategy has been chosen for the study for it will ensure that the data generated will be consistent with the grid-based informationalready available as Survey of India topographic sheets. The grids generated are of 5’x5’; Every 9 grids generated for the study will overlay precisely with a 15’x15’ grid generated for the 1:50,000 scale Survey of India topographic sheets. Adding to data validation, integrating the data generated with the already available SOI data sets can help us in correlating the various parameters – social, ecological, economic etc. – that affect the natural resource availability of a place. This has the potential to serve asatool for the effective functioning of the Biodiversity Management Committees constituted on a panchayat-level under Chapter 10 of The Biological Diversity Act, 2002 with the purpose of promoting conservation, sustainable use and documentation of biological diversity.
2.0 Objectives
Objectives of the current study are:
-
• Grid based inventorying and mapping of natural resources for Bidar and Uttara Kannada districts of Karnataka, India
• Prioritisation of Natural Resources Importance (NRI) Zones
3.0 Study Area
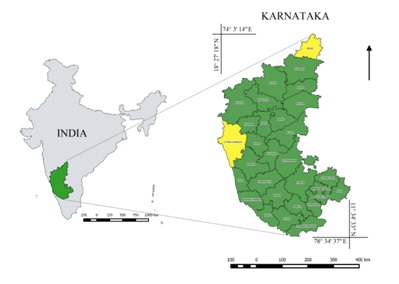
The study areas include the districts of Bidar and Uttara Kannada of Karnataka state as shown in Figure 1.Bordered by the Arabian Sea to the west, the terrain of Karnataka ascends sharply towards the east over the crest of the Western Ghats and descends gently to merge with the Deccan Plateau. Owing to this unique geography, the state has a rich variety of natural resources including rivers, hills, water- falls, valleys, plains, forests etc. The state has four physiographic regions, namely, Northern Karnataka Plateau, Central Karnataka Plateau, Southern Karnataka Plateau and Karnataka Coastal region. The chosen two districts, Bidar and Uttara Kannada, fall under the Northern Karnataka Plateau and Karnataka Coastal region respectively. The two districts were chosen with the objective of bringing out the diversity of the distribution and the trends of the natural resources found in the two extreme physiographic regions
The Bidar district is the northernmost part of the Karnataka state with geographical area of 5460 square kilometres. It lies between 17°35’ and 18°29’ North latitude and 76°41’ to 77°39’ East longitude. It is bounded by Nizamabad and Medak districts of Andhra Pradesh state on the eastern side, Latur and Osmanabad districts of Maharashtra state on the western side, Nanded district of Maharashtra state on the northern side and Gulbarga district on southern side. With a mean elevation of 615 m and annual rainfall of 824 mm, it is considered to be one of the dry districts of Karnataka. It is entirely contained in the Karnataka Plateau, hot dry semi-arid agro-climatic zone
The Uttara Kannada district is one of the biggest districts of our State with abundant natural resources. It is bordered by the state of Goa and Belgaum District to the north, Dharwad District and Haveri District to the east, Shimoga District and Udupi District to the south and the Arabian Sea to the west. With a mean elevation of 500 m and annual rainfall of 2836 mm, the district has varied geographical features with thick forest, perennial rivers and abundant flora and fauna and a long coastal line of about 140 km in length. A major part of the Western Ghats, one of the mega diversity hotspots in the world, passes through the district. The predominant agro-climatic zone is the Western Ghats, hot moist sub humid.
4.0 Method
For the purpose of this study, 5’x5’ grids (that overlay with the SOI topographic sheets of 1:50,000 scale) were generated. Raw data for various themes considered were compiled from online data sets and secondary literatures as mentioned in Table 1.
| Theme | Data | Source |
| Social | Population | Census of India |
| Forest Dwellers | Karnataka State Gazetter | |
| Geo-climate | Elevation | SRTM (Shuttle Radar Topography Mission ) -DEM |
| Rainfall | WorldClim - Global Climate Data | |
| Agroclimatic zones | ICAR-NBSS&LUP(National Bureau of Soil Survey and Land Use Planning) | |
| Lithology | ||
| Soil | ||
| Slope | Derived from SRTM-DEM | |
| Hydrology | Drainage network | Derived from SRTM-DEM |
| Reservoirs/Estuaries | Digitized from Bhuvan, SOI topographic sheets and Google Earth | |
| Land | Forest cover | ORNL DAAC - Decadal Land Use and Land Cover Classifications across India |
| Ecology | Livestock | NIC (National Informatics Centre) - District at a Glance |
| Biodiversity | http://florakarnataka.ces.iisc.ac.in/hjcb2/ https://indiabiodiversity.org/ https://avibase.bsc-eoc.org/avibase.jsp?lang=EN http://www.fishbase.org/search.php |
|
| Biomass | Ramachandra TV et al. 2000 | |
| Energy potential | Solar | Ramachandra TV and Ganesh Hegde, 2014 |
| Wind | Ramachandra TV and Shruthi BV, 2007 | |
| Bio | Ramachandra TV, 2007 |
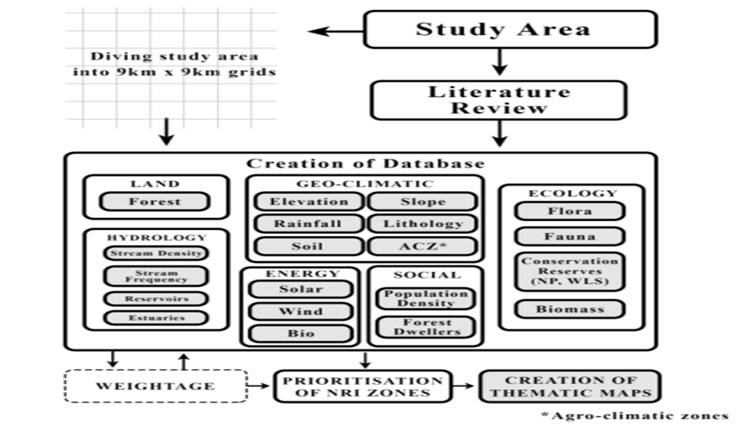
The data compiled was then integrated with the grids through the computation of zonal statistics (raster data) and intersection (vector data). The grids having data integrated under the various themes were then later synthesized for the prioritization of Natural Resource Importance (NRI) Zones. For the prioritization of NRI zones, the grids were assigned weightages of 2, 4, 6, 8 or 10 based in the significance of every theme considered. These weightages were then added to get the aggregated weight for each grid. The distribution of the calculated aggregated weight was then prioritized into 4 zones, zone 1 being the most and zone 4 being the least important natural resources regions (grids). Following the prioritization, thematic maps were created for the considered themes. The method followed for the grid-based inventorying, mapping and monitoring of the natural resources and their NRI prioritization has been outlined in the form of a flow chart in Figure 2. Identification of NRI Zones considering spatially both ecological and social dimensions of environmental variables helps in strategizing ecological and conservation planning as per Biological Diversity Act, 2002. It can also help us in understanding the natural resources’ trends and in correlation with the various themes considered, we can try and understand the influences the parameters have on each other and on the natural resource availability on the whole. This can further lead to the evolution of appropriate sustainable management strategies at a local level, adding to which it can be used as a prioritisation tool on making decisions based in the allocation of funds with regards to conservation programmes in a scenario where the allotted funds are limited.
5.0 RESULTS
This section contains thetheme-wise compilation of the thematic maps generated for the districts of Bidar and Uttara Kannada.
Geo-climatic:
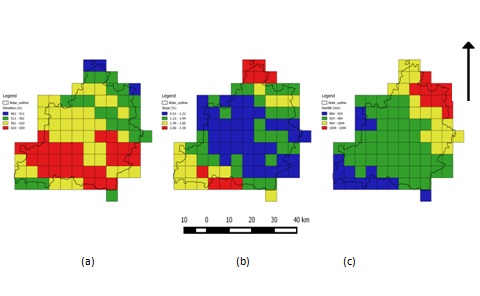
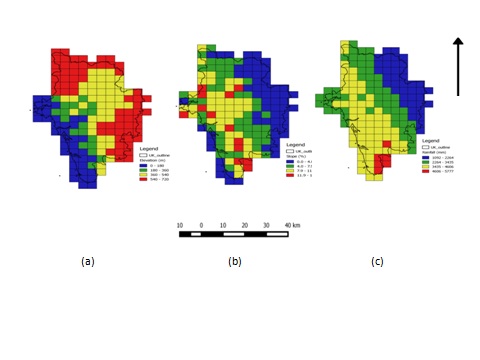
The elevation of Bidar ranges between 462 m and 659 where as for Uttara Kannada, the range extends from 9 m (Figure 3a) in the coastal regions to 720 m (Figure 4a). The slope, represented as percentage, has a maximum of 3.38 in Bidar (Figure 3b) as opposed to 15.9 in Uttara Kannada (Figure 4b), located at regions where the Central Western Ghats passes through the district. The undulating terrain of Uttara Kannada and the Ghats region majorly impact the rainfall as well. The district of Bidar receives a maximum of 1044 mm rainfall annually (Figure 3c) whereas Uttara Kannada receives a huge amount, 5777 mm of rainfall annually (Figure 4c). The coastal and hilly features present in Uttara Kannada along with the huge amount of rainfall it receives, contributes to the formation of a variety of biomes in the district, influencing its rich biodiversity and natural resource availability as opposed to Bidar, which is majorly contained in a plateau.
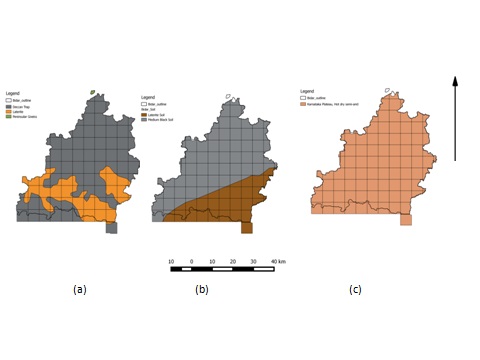
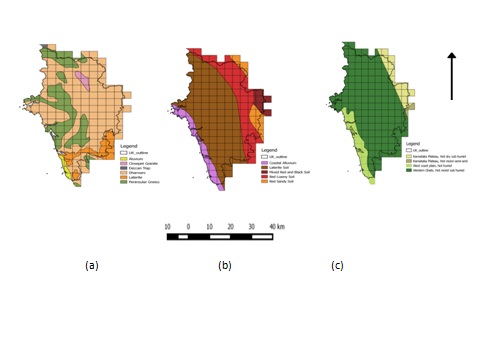
The lithology of Bidar is composed of Deccan Trap, Laterite and Peninsular Gneiss (Figure 5a) whereas with Uttara Kannada, a range of types including Aluvium and Dharwars (Figure 6a), which are very rich and support significant yield of natural resources can be found. With the soil types, Bidar has laterite and black medium soil (Figure 5b) with Uttara Kannada being composed of very fertile soil types like the coastal alluvium and red loamy soil (Figure 6b). The agro-climatic zone for Bidar is contained within the Karnataka Plateau, hot dry semi-arid (Figure 5c) whereas Uttara Kannada has West Coast plain, hot humid and the Western Ghats, hot moist sub humid (Figure 6c). Agro climatic zone is a land unit in Irens of major climate and growing period which is suitable for a certain image of crops and cultivars (FAO 1983).Uttara Kannada, having more than one type of Agro-climatic zone, adding to the other geo-climatic factors, contributes towards the diversity of resources found in the district.
Hydro-ecological:
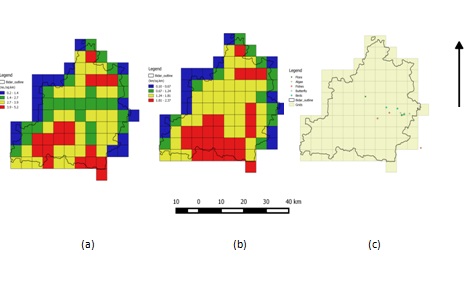
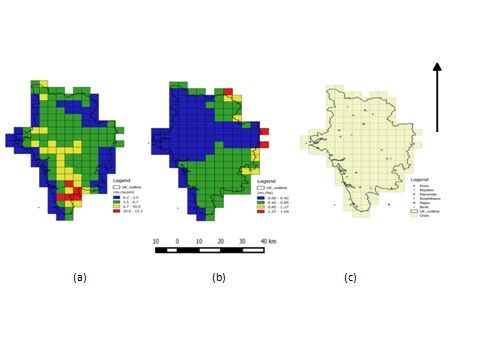
The district of Bidar depends on the Godavari river basin for its water. The presence of Karanja reservoir in the southern part of the district is the reason for the stream frequency and density trends. The stream frequency has a maximum value of 5.2 no./sq. km (Figure 7a) and the density being 2.37 km/sq. km (Figure 7b). The district of Uttara Kannada has Kali, Aghanashini, Sharavati, Gangavali and Venkatapura river basins. This contributes to a maximum stream frequency of 13.2 no./sq. km (Figure 8a). The stream density is however at a low of 1.69 km/sq.km (Figure 8b) as compared to Bidar for the river courses take erratic paths owing to the undulation in the terrain. The Kali basin in particular has been facing environmental problems recently with the number of development projects coming in disguised as hydro-electric and river diversion projects. Development projects in forest areas result in their fragmentation and the massive destruction and loss of habitat for the flora-fauna of the region. The flora and fauna for both the districts were mapped spatially (Figures 8c and 9c) in monitoring the biodiversity of the regions and their changes in relation to the changes caused in the ecosystem due to anthropogenic activities.
Social:
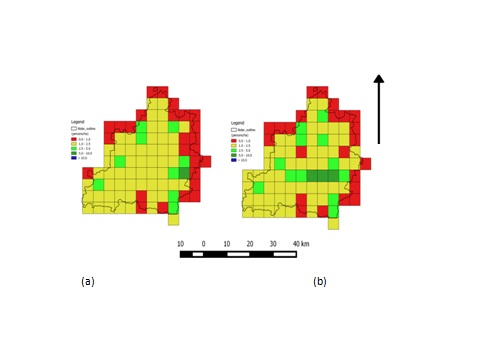
The population density for Bidar is found to have not changed significantly except in and around the Bidar city where the density has jumped from the 1.0-2.5 persons/ha range to 2.5-5.0 and 5.0-10.0 range (Figure 9). This is a typical result of sub-urbanization through agglomeration. Urbanization directly impacts the natural resources availability for with the increase in the population, the demand for the natural resources also increase, putting a huge pressure on the ecosystems supporting them.
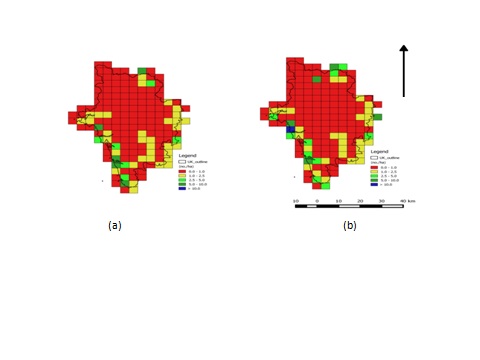
The population of Uttara Kannada can be seen to be concentrated towards the coast as mapped in Figure 10. The northern and the central portion of the district are covered with forest and hence the low population density. There is aninverse relation between population and forest cover, brought out in correlation with the forest cover maps generated. There is a steady increase in the population from 1991 to 2001 along the coast with a few grids because of the presence of estuary present in the region. Estuaries are regions where the fresh water mixes with brackish water. This leads to the formation of a unique ecosystem that provides for life-supporting services rendered as a result of its functioning.
Land:
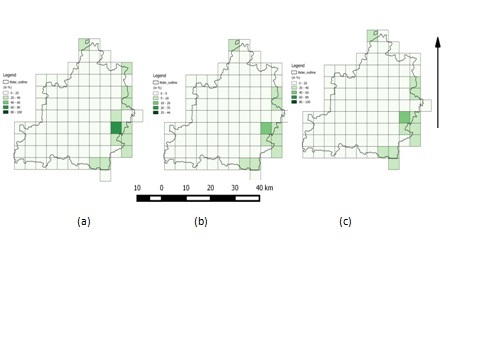
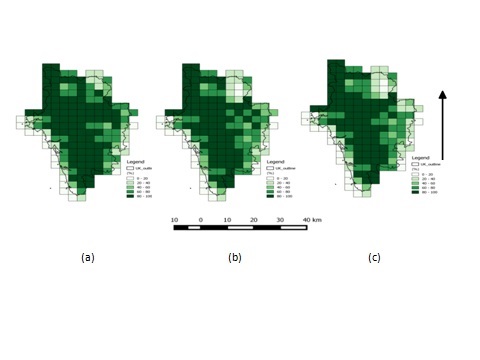
Healthy forests play a very important role in protecting and sustaining water resources.. The entire river system of Karnataka is dependent upon the forests of the Western Ghats which arrest, regulate and release rainwater throughout the year, both of which together influence the biodiversity and the natural resources available. The percentage forest for the grids was computed as the area covered in forest per grid divided by the area of the grid. The results show that the district of Bidar has very poor forest cover will almost all of its grids having less than 20%. The only grid with a 60-80% cover in the year 1995 further deteriorated to have only 40-60% by 1995 with the grids around it going from 40-60% to 20-40%. The vegetation cover in the district makes up for only 5.24% of the geographical area.In contrast, the district of Uttara Kannada has 80% covered in vegetation. The Ghats region of the districts, which happens to form the majority of it, has 80-100% forest cover. However, significant degradation of forests in the Northern part of the district over the years is evident as seen in Figure 12.
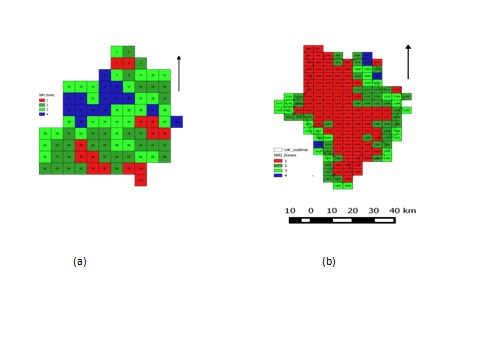
Natural Resources Importance (NRI) Zones:
For the prioritization of NRI Zones, weights (ranging 0-10) were assigned to each grid based in the parameters considered under the themes, geo-climate, social, ecology, hydrology, land and renewable energy potential. Aggregation of these weights per grid aided in prioritising the grids based on the relative weights. Aggregated metric score helped in grouping the study region into four natural resources importance regions, Zone 1 being the richest in terms of the resources found. The NRI zones identified require effective conservation measures to ensure the sustainability of natural resources – water, forest products etc., - for the sustenance of people’s livelihood. Inventorying of natural resources and prioritising the zones importance zones has been done with the sustainable aspects considered. The mapping of the same can complement the functioning of the Biodiversity Management Committees, constituted for every local body under Chapter 10 of The Biological Diversity Act, 2002 with the purpose of promoting conservation, sustainable use and documentation of biological diversity.
A total of 85 grids were generated for the district of Bidar for the inventorying, mapping and monitoring and further, for prioritizing the NRI Zones (Figure13a). Out of 85 grids, 11 were prioritized under NRI Zone 1 (12.94%), 27 under Zone 2 (31.76%), 32 under Zone 3 (37.65%) and 15 under Zone 4 (17.65%).
A total of 145 grids were generated for the district of Uttara Kannada which were integrated with the data and prioritized for NRI Zonation (Figure13b). Out of 145 grids, 88 were prioritized under NRI Zone 1 (60.69%), 34 under Zone 2 (23.45%), 20 under Zone 3 (13.79%) and 3 under Zone 4 (2.07%).
6.0 FUTURE SCOPE
Natural resources are imperative not only for leading a sustaining lifestyle but also as provides to be an important input for economic growth. Currently, due to poor availability of information on various aspects of natural resources and the existing problem in quantification of natural resources, it is not possible to fully assess the damage being done to the natural resources. Grid-based inventorying mapping and monitoring of natural resources seeks to address this gap by providing information that can facilitate informed decision-making. Ensuring the sustenance of natural resources is crucial for maintaining an environment that can be beneficial to the humankind. Most of the environmental problems arise because of resource depletion and negative externalities caused by the development processes and projects, adversely affectinghuman well-being. Mapping and monitoring of natural resources can aid us in understanding the effects anthropogenic activities have on natural resources and consequently come up with strategies to mitigate the adverse effects. Long-term research and monitoring can provide important ecological insights and are crucial for the improved management of ecosystems and natural resources (Lindenmayer and Likens, 2009). Karnataka Biodiversity Board, established in 2003, currently has a total of 5087 Biodiversity Management Committees and a total of 1713 People’s Biodiversity Register across Karnataka (State of Environment Report, 2015). The spatio-temporal availability of information on natural resources can serve as an effective management tool in empowering the Biodiversity Management committees (People’s Biodiversity Register) constituted on a panchayat-level under Chapter 10 of the Biological Diversity Act 2002. By integrating and co-relating various parameters considered under different themeswith the already available Survey of India topographic sheets data, effective conservation and sustainable management practices can be worked upon, thereby maintaining the balance between the prudent use of natural resources and ensuring theirsustenance, augmenting India’s path towards sustainable development
7.0 ACKNOWLEDGEMENT
The integration of data with the grids was performed for the Green Skill Development Programme (GSDP) on ‘Valuation of Ecosystems Goods and Services’ and Green GDP held between 5th and 19th of August 2018, organised by ENVIS centers at IISc and EMPRI, Bangalore. We are thankful to the Ministry of Environment, Forest & Climate Change (MoEF&CC) for the GSDP initiative
8.0 REFERENCES
- Costanza R., deGroot R., Sutton R., Ploeg S., Anderson S.J., Kubiszewski I., Farber S., Turner R.K., 2014. Changes in the global value of ecosystem services. Global Environmental Change,Volume 26,Pages 152-158,ISSN 0959-3780.https://doi.org/10.1016/j.gloenvcha.2014.04.002.
- Costanza, R., dArge, R., de Groot, R., Farber, S., Grasso, M., Hannon, B., Limburg, K., Naeem, S., Oneill, R.V., Paruelo, J., Raskin, R.G., Sutton, P., van den Belt, M., 1997. The value of the world’s ecosystem services and natural capital. Nature 387, 253–260.
- Environmental Management & Policy Research Institute, 2016. State of Environment Report Karnataka 2015-16.
- Lovett, G.M., Burns, D.A., Driscoll, C.T., Jenkins, J.C., Mitchells, M.J., Rustad, L., Shanley, J.B., Likens, G.E., Haeuber, R., 2007. Who needs environmental monitoring? Frontiers in Ecology and the Environment, 5(5), 253-260.
- Millennium Ecosystem Assessment (MEA), 2005. Ecosystems and Human Well-Being: Synthesis. Island Press, Washington, DC.
- Myers N, Mittermeier RA, Mittermeier CG, Da Fonseca GA, Kent J, 2000. Biodiversity hotspots for conservation priorities. Nature 403(6772):853–858.
- Opdam P, Steingröver E, Van Rooij S, 2006. Ecological networks: a spatial concept for multi-actor planning of sustainable landscapes. Landsc Urban Plan 75(3):322–332.
- Ramachandra TV, 2007. Geospatial Mapping of Bioenergy Potential in Karnataka, India. Journal of Energy and Environment (JEE), 6(1): 28-44.
- Ramachandra TV, Aithal B., 2017. Escalating Pollution Threats in Urbanising Indian Cities. Union Budget 2017-18: Outlook .eSS Current Affairs, Union Budget 2017-18.
- Ramachandra, T.V.,Bharath, Setturu., SubashChandran, M.D. Joshi, Niranjan.V. (2018). Salient Ecological Sensitive Regions of Central Western Ghats, India. Earth Syst Environ 2: 15. http://doi.org/10.1007/s41748-018-0040-3.
- Ramachandra TV, Chandran MD, Gururaja KV, Sreekantha. 2007. Cumulative environmental impact assessment. Nova Science Publishers, New York.
- Ramachandra TV, Ganesh Hegde, 2014. Solar Energy: Sustainable Energy Option, AEE-Energy Window, 11(3): 3-5
- Ramachandra TV, Joshi NV, Subramanian DK, 2000. Present and Perspective Role of Bioenergy in Regional Energy System, Renewable and Sustainable Energy Reviews, 4, 375-430.
- Ramachandra TV, Setturu B, Rajan KS, Chandran MD, 2016. Stimulus of developmental projects to landscape dynamics in Uttara Kannada, Central Western Ghats. The Egyptian Journal of Remote Sensing and Space Science. Volume 19, Issue 2, Pages 175-193, ISSN 1110-9823. https://doi.org/10.1016/j.ejrs.2016.09.001.
- Ramachandra TV, Shruthi BV, 2007. Spatial mapping of renewable energy potential, Renewable and Sustainable Energy Reviews, 11(7):1460-1480
- TEEB Foundations, 2010. The Economics of Ecosystems and Biodiversity: Ecological and Economic Foundations. Earthscan, London and Washington.
- TEEB Synthesis, 2010. Mainstreaming the Economics of Nature: A Synthesis of the Approach, Conclusions and Recommendations of TEEB. Earthscan, London and Washington.
- Food and Agriculture Organisatoin (FAO), 1984. The State of Food and Agriculture 1983. FAO Agriculture Series, No. 16, ISSN 0081-4539, Italy.
- Watson JEM, Grantham H, Wilson KA, Possingham HP, 2011. Systematic conservation planning: past, present and future. In: Whittaker R, Ladle R (eds) Conservation Biogeograph. Wiley- Blackwell, Oxford, pp 136–160.