Climate in the Western Ghats varies with the altitudinal gradient and distance from the equator. Annual rainfall in the region with proximity to the Sea averages to 3000-4000 mm whereas those at the eastern region of the Ghats receive much less annual rainfall of about 1000 mm. The Western Ghats, being one of the global biodiversity hotspots, ensures the water and food security to the peninsular India. The objective of the current study is the analysis of the changes in surface air temperature and rainfall across the Western Ghats along the Coast, Ghat and Plain regions and visualizing the likely scenario in land use and water availability in two selected basins viz., Karamana Basin (Thiruvananthapuram, Kerala and Sita Basin, Udupi, Karnataka) under the projected climate change scenario. The data required for the study were obtained from the Directorate of Economics and Statistics, Government of Karnataka, website of NOAA, website of Hydrology Department, University of Princeton and from the publications of the Central Government Department and the concerned State Departments.
The study revealed that the rainfall over the Western Ghats as a whole doesn’t reveal any trend from 1901-2010 while it is not so at the regional level. However, the maximum and minimum temperatures along the Western Ghats showed an increasing trend from 1948- 2010. The trend was similar at regional level except in the plains of the Northern Western Ghats which showed a marginal increase in the mean minimum temperature. Both the representative river basins viz., Karamana in Thiruvananthapuram district and Sita in Udupi district have undergone changes in the land use pattern which altered the water balance of the basin along with the change in population since last two decades from 1990 to 2010. The Karamana Basin suffered a deficit in the available water owing to the low rainfall received in the basin in comparison to the huge demand of water and the situation would aggravate with an increase in water demand and decrease in rainfall over the basin. But, Sita basin receives abundant rainfall which caters to the needs of the basin except during the period of moderate to severe drought.
The Western Ghats are the unbroken chain of hills (of which Palakkad gap is an exception) running in the North-South direction for about 1600 km parallel to the Arabian Sea from river Tapti (22˚26’N) to Kanyakumari (about 8˚0’ N) and extends zonally from 72˚55’E to 78˚11’ E covering an area of about 1, 64,280 km2. It is designated as one of the 35 global biodiversity hotspots and the habitat to a large number of endemic plant and animal species. These species face threat of vulnerability and extinction due to habitat loss with changes in weather and climate. Climate in the Western Ghats varies with the altitudinal gradient and distance from the equator. Annual rainfall in the region with proximity to the Sea averages to 3000-4000 mm whereas those at the eastern region of the Ghats receive much less annual rainfall of about 1000 mm. Forests of the Western Ghats have been highly fragmented due to clearing for conversion to agricultural land, construction of dams and reservoirs, building and transportation pathways (INCCA, 2010). The Western Ghats, being one of the global biodiversity hotspots, ensures the water and food security to the peninsular India.
Climate is one of the key drivers of the Earth’s environment. It has continuously been modified and is being modified through natural processes and more recently, through human interferences. It is evident from the earlier studies that atmospheric composition is being affected by the unplanned human activities since industrial revolution (Ruddiman, 2003 and Puniaet al., 2015). Escalated anthropogenic activities like burning of fossil fuels, industrial emissions and deforestation have resulted in emission and thereby increase in the atmospheric concentration of greenhouse gases like carbon dioxide, nitrous oxide and sulphur dioxide. These gases trap heat by absorbing the outgoing long wave radiation, which increases the mean temperature of the atmosphere and this phenomenon is widely known as global warming. Climate change is evident from the increased mean temperature over the earth’s surface, increase in the rate of melting of the polar ice caps and glaciers, increase in the Sea level due to the melting of ice and expansion of water due to increased temperature. The global land and ocean surface temperature has increased by about 0.72°C during 1951-2012 (IPCC, 2013). According to the U.S National Academy of Sciences (2010), changes in climate is occurring, caused largely by the human activities, which has already affecting a wide range of human and natural systems (http://www. c2es.org). Climate change is said to have impacts on all sectors of life such as agriculture and food security, water resources, human health, extreme weather events and biodiversity. Altered precipitation patterns, greater uncertainty in rainfall along with increased temperature are a consequence of the changes in climate, which has affected the production and productivity of crops with the changes in pest and disease outbreak patterns. The global temperature is projected to increase at least by 1.5° C and global Sea level is projected to rise by 0.26-0.55m (low emission scenario) to 0.52-0.98m (high emission scenario) by the year 2100. Adverse impacts of climate change are predicted all over the world, tropical countries especially African and south Asian countries are said to be highly vulnerable to the adversities of climate. Rainfall shows inter annual variability with more frequent deficit monsoon over South Asia. The summer monsoon rainfall in India is projected to increase under all the RCP (Representative Concentration Pathway) scenarios and temperature is projected to increase by more than 3° C in south Asia under the worst scenario of RCP 8.5 by late 21st century. The frequency of weather extremes such as floods, droughts, heat waves and cold waves is likely to increase in the ensuing decades with the global warming and changes in the climate. This could be a threat to water and hence the sustenance of other society linked sectors like agriculture, food and nutritional security.
The studies conducted across the Western Ghats showed a decrease in the summer monsoon rainfall (Ghoshet al., 2009) and an increase in hot days with subsequent decrease in cold nights over the region for the period from 1971 to 2005. Rajeevanet al. (2008) analyzed the gridded rainfall data averaging 1803 stations over India and found an increase in the frequency of very heavy rainfall events (more than 150mm/ day) during post mid-1970s. Guhathakurta and Rajeevan (2008) has also reported an increase in rainfall during monsoon season over Konkan, Goa and Maharashtra region and a decrease over the Chattisgarh and adjacent areas during 1901-2003. The mean temperature was also found to increase over the region for the same period (Kothawale et al., 2010). The changes and/or fluctuations in the hydrological cycle affect the availability and quantity of fresh water and have become a serious issue in the 21st century (Pal and Al-Tabbaa, 2011 and Suryavanshi et al., 2013). Temperature drives the hydrological cycle by influencing the hydrological processes directly or indirectly. Warmer climate intensifies the hydrological cycle, resulting in high evaporation rate and increase in liquid precipitation. When associated with shift in precipitation pattern, these processes will affect the spatial and temporal distribution of runoff, soil moisture and groundwater reserves, and increase the frequency of droughts. Changes in the climate would have serious implications on biota as well as abiotic components, threatening the livelihood of millions of people. This necessitates appropriate water management strategies with understanding of the temperature and precipitation dynamics associated with the changes in regional climate. Keeping the above in view, the current study has been taken up with the objectives of analyzing the changes in surface air temperature and rainfall pattern across the Western Ghats and visualizing the likely scenario in water availability due to the predicted climate changes.
The global mean surface temperature has increased since 19th century, each of the past three decades is successively greater than the other and the last decade was the warmest. The combined Sea and land surface temperature has increased by 0.89°C in the period 1901-2012 while the increase for the period 1951-2012 was 0.72°C. It was found to be virtually certain that the maximum as well as the minimum temperature over the land surface and the Sea surface temperature has increased since 1950. The number of hot days and nights has increased while the cold days and nights have decreased globally from 1951-2010. The heavy precipitation events have increased in many regions over the world. The Greenland and Antarctic ice sheets have lost mass, Artic sea ice and the spring snow cover in the northern hemisphere has decreased in its extent and glaciers all over the world have been shrinking in the past two decades. The rise on the global sea level has been 0.19m from 1901-2010. There is a 7.5% increase in RF from GHGs from 2005 to 2011, with carbon dioxide (CO2) contributing 80% (IPCC, 2013).
2.1. Global greenhouse gas emissions and climate change: Human activities are responsible for the changes in the composition of the earth’s surface and atmosphere. These directly influence the heat energy of the earth and thus act as drivers of the climate change. Radiative forcing is a measure of the net change in the earth’s energy system in response to external perturbation, a positive radiative forcing indicates a warming trend while the negative radiative forcing indicates a cooling trend. The latest IPCC report ascertains the fact that more than half of increase in the global mean temperature has been due to the anthropogenic activities from 1951 to 2010 (IPCC,2013).
Studies indicate that the increased global mean temperature affects the global hydrological cycle spatially and temporally and the risk of increased floods and droughts at local level and an increase or decrease of water availability at continental scale (Labat et al.., 2004; Arnell et al., 2001, IPCC, 2013). Regression analysis of variables indicate that for every 1°C rise in the global temperature, there was a 4% increase in the global runoff which is in agreement with the recent findings of an increasing global precipitation. There has been an unprecedented increase of 0.6 ± 0.2°C in the global temperature since 1900 (Houghton et al.., 2001 and Matthews et al.., 2004).The twentieth century changes in temperature have been attributed to greenhouse gas and sulphate aerosol forcing (Stott et al., 2001 and Matthews, 2004) and changes in volcanic aerosols and solar irradiance (Jones et al., 2003 and Matthews, 2004).
Drostet al. (2011) has derived global indices namely area-weighted global average of surface temperature (GM), Land–Ocean surface temperature contrast (LO), Northern–Southern Hemisphere temperature contrast (NS), mean magnitude of the Annual Cycle in temperature over land (AC), mean MTG (Meridional temperature gradient ) in the Northern Hemisphere between 52.5°N–67.5°N and 22.5°N–37.5°N and ratio between changes in Land and Ocean temperatures (RLO) using the monthly mean global surface temperature data and were determined from three different observational datasets and data from simulations with eight CMIP3 (Coupled Model Inter comparison Project, phase 3) coupled atmosphere- ocean-sea-ice climate models (Meehl et al., 2007 and Drost et al., 2011) to study the evidence of anthropogenic warming of the climate. The study indicated an increased evidence of anthropogenic warming of the climate while considering multiple climate indices.
Climate sensitivity (which measures the changes in the global climate system to a particular forcing) and the rate of heat uptake (by the deep ocean) are the two parameters that decide the response of the climate system to radiative forcing in the decadal to century time scales (Forest et al., 2002).
Hansen et al. (2006) analyzed the global surface temperature over land and Sea and reported an increase of 0.2° C per decade for the past decade in the past 30 years, in par with the predictions of the climate model simulations in 1980s. The warming was predominant over land than over the oceans with the greenhouse gases being the major drivers of forcing. Alexander et al. (2006) has derived several climate indices from the daily precipitation and temperature data which was collaborated from the datasets of various organizations throughout the world and found an increasing trend in the warm nights and decreasing trend in the cold nights during 1951-2003 over almost 70% of the global sampling sites. The Indian summer monsoon rainfall (ISMR) is a major component of the Asian summer monsoon. India receives about 80% of its total rainfall during the summer monsoon season, from June to September (Sahani et al., 2003 and Ghosh et al., 2009). Changes in the ISMR have huge social and political impacts due to the heavy dependability of the Indian agriculture on ISMR (Ghosh et al., 2009). Air temperature is generally recognized as a good indicator of the state of climate globally because of its ability to represent the energy exchange process over the earth’s surface with reasonable accuracy (Vinnikov et al., 1990; Thapliyal and Kulshrestha 1991; Bhutiyani et al., 2007). The sea level rise along the Indian coast when estimated using the tide gauge data showed that the sea level has increased slightly less than 1mm/ year for the Kochi, Vishakhapatnam and Mumbai coast while the Chennai coast showed a decrease from 1880-2000 (Unnikrishnan et al., 2006).
2.2. Rainfall Analysis: As per IPCC, the Indian subcontinent will be affected by the enhancement in the climate variability, temperature increment and reduction in summer rainfall in some parts of the country and hence water stress by 2020s (Cruz et al., 2007). A study was conducted by Ghosh et al. (2009) to analyze the trends in the ISMR all over India using the 1°x 1° gridded rainfall data provided by IMD for the period 1951- 2003. It was found that the mean summer monsoon rainfall was significantly increasing in the regions of West Bengal while the rainfall over the west coast of India was found to be significantly decreasing. The study reports that the summer monsoon rainfall has not only been affected by global warming but also local phenomenon such as urbanization, industrialization and deforestation.
Subash and Sikka (2014) has analyzed the trends in temperature and rainfall over India using the sub-divisional monthly time series rainfall data and monthly temperature data series from 1904 to 2003 obtained from IITM website (http://www.tropmet.res.in) and found no significant increasing/ decreasing trend over all India. Maximum increase in rainfall was observed in coastal Karnataka while the Kerala region showed the maximum decreasing trend over the study period. The annual maximum temperature was found to have a significant increasing trend of about 0.78°C over 100 years and an increase of 0.26°C during100 years was observed in the case of annual minimum temperature over India. Maximum temperature was found to increase in all months and seasons over India. The maximum temperature increase was maximum over the west coast with an increase of about 1.2°C/100 years. The maximum as well as the minimum temperature was found to increase in the last three decades at all the stations in the western Himalaya at different rates (Dimri and Dash, 2012). India meteorological Department published two monographs on rainfall and temperature trends (Attri and Ajit Tyagi, 2010 and Rathore et al., 2013).
Extreme weather events studies indicate that almost 60-70% of the coastal stations over India show an increase in the critical extreme maximum day temperature and night temperature during summer (Subash et al., 2010). Based on the data collected by IMD over the Indian region, there was found to be a warming of 0.5°C per 100 years over India. The study was done to analyze the rainfall and temperature characteristics in the central northeast India from 1889 to 2008 using the monthly rainfall and temperature data of five subdivisions obtained from IITM website and the decreasing trend was confirmed by the Mann Kendall test. The study found a significant decreasing trend for the annual rainfall in Jharkhand and Central north east India and an increase in maximum and minimum temperature was seen during the post monsoon season which may affect the important crops grown in the region.
The intense rainfall events when studied from 1951-2003 using the 1°x1° daily gridded rainfall data obtained from National Data Center (NDC), IMD showed a significant contribution to the total rainfall in many parts of India especially in the Northwest, peninsular and west coast of India. Short spells of heavy intensity rains have increased while long spells of moderate intensity rains have decreased in the summer monsoon season over India. Short spell heavy intensity rainfall has increasingly contributed to the total rainfall over the time period (Dash et al., 2011). Analysis by Goswami et al. (2006), using the same data for the period 1951-2000 showed an increase in the extreme rainfall events over all India and central India but the mean rainfall for the whole of India during the summer monsoon remained stable over the same period. The number of severe cyclonic storms over the north Indian Ocean has shown an increasing trend in the past three decades (Webster et al., 2005; Rupa Kumar et al., 2002; Goswami et al., 2006).
Rajeevan et al. (2008) investigated the long term trend in extreme rainfall over India using the 1°x1° daily gridded rainfall data obtained from NDC, IMD for the period 1901-2004 and found an increase in the frequency of very heavy rainfall events (> 150mm/ day) post mid-1970s and a significant decrease in the frequency of moderate rain events (5-100mm/ day) for India as a whole. The SST variations over the tropical Indian Ocean influences the inter annual and inter decadal variability of extreme rain events over India. A decrease in the precipitation in the regions including the Western Ghats, central and north east India was observed by Ratna et al. (2015) for a time period 1951-2007 in a study conducted to understand the relationship between the sea surface temperature and atmospheric variables over the Indo – Pacific region with the ISMR using the data of monthly mean sea surface temperature (SST), monthly mean precipitation, monthly mean specific humidity, winds and vertical velocity obtained from the various global gridded datasets. The decreased precipitation was attributed to the decrease in moisture carried to the Indian landmass due to the weakening of winds from the western region.
The seasonal changes in rainfall in India could be due to either or cumulative effect of multiple factors namely changes in the number of rainy days, rainfall intensities, sea surface temperature and ENSO (Pal and Tabbaa, 2011).The North East monsoon rainfall (NEMR) exhibits significant inter annual and decadal variability (Singh and Sontakke, 1999; Kripalani and Kumar 2004; Nayagam et al., 2009; George et al., 2011; Sreekala et al., 2012; Prakash et al., 2013).There was a significant increase in the NEMR over the equatorial Indian Ocean, peninsular India and Sri Lanka (Prakash et al., 2013) in the study of 32 years from 1979-2010 using rain gauge data of the region which can be attributed to the increased frequency in the frequency of cyclone in Bay of Bengal in November and increased warming of the Indian Ocean.
A significant linear increasing trend in the number of reported extreme weather events over India was found out by a study conducted by Singh and Patwardhan (2012) from 1967 to 2006. The study found that the maximum number of extreme events was reported from Maharashtra with the state leading in the events such as lightning, flooding and hailstorms over the period. Almost all the states show an increasing trend in the reported events of floods and heat waves.
The contiguous sub divisions north of 12°N and west of 80°E showed an increasing trend in annual rainfall (Parthasarathy and Dhar, 1974; Rakhecha and Soman, 1994). An increase in the annual rainfall was observed in the west coast stations north of 80°E (Alvi and Koteswaram, 1985 and Rakhecha and Soman, 1994). The rain gauge stations over the West coast peninsula and over the central part to the east of Western Ghats has reported a significant increasing trend in the annual extreme rainfall in a study done to look into the year to year variations in the annual extreme rainfall using the data from 316 stations well distributed all over India, obtained from the IMD National Data Center. The increasing trend in annual rainfall in the west coast regions can be partly attributed to the increase in the heavy rainfall events over the same region (Rakhecha and Soman, 1994). The average rainfall in the west coast of India as found out using the data obtained from IMD for the rain gauge stations over the west coast is very high from the month of June till August but show a dip in the first two weeks of July and this variation in the average rainfall is consistent with the frequency of intense rainfall events indicating that these intense rainfall events contribute significantly to the average rainfall over the west coast. The intense rainfall events (>15cm/day) for the west coast for the period 1951-1987 was maximum in the latitude 15°N-16°N and this was the region where the Ghats was closer to the coast (Francis and Gadgil, 2006).
There has been an increase in the summer monsoon rainfall in the meteorological subdivisions of Coastal Karnataka and Konkan and Goa, decrease in the rainfall for Kerala when the trend was analyzed for the rainfall in the homogenous regions of India for the period of 1871-2002 using the rainfall data available in the IITM data archive. There was no trend for the rainfall in Tamil Nadu for the study period (Dash et al., 2007). Also, the frequency of heavy rainfall events (>7cm rainfall in 24 hours) showed an increasing trend in the west coast in the summer monsoon season. Guhathakurta and Rajeevan (2008) has found out an increase in rainfall activities in the monsoon season over Konkan, Goa and Maharashtra region and a decrease over the Chattisgarh and adjacent areas during 1901-2003.
The mean annual rainfall has shown an insignificant decreasing trend for the period 1871-2005 while a significant increasing trend was observed in the period 1951-2005. The post monsoon rainfall showed a significant increasing trend while the monsoon rainfall showed a significant decreasing trend with the maximum decrease in the month of June and July and a slight increase in the month of August and September over Kerala in an analysis to study the recent trends in annual and seasonal rainfall over the state (Krishna Kumar et al., 2009). The analysis of the daily gridded rainfall data provided by IMD indicates that the seasonal monsoon rainfall showed an oscillatory trend over a period of 1901-2004 over the South West and North West region of India and the south west region rainfall value was closer to the long term mean. South west region showed a significant increasing trend in the rainfall in the period 1901-1975 and then showed a decreasing trend from 1976-2004 (Kulkarni, 2012).
Guhathakurta and Saji (2013) have studied the rainfall pattern for the state of Maharashtra for a period of 1901-2006 using the data from 335 rain gauge stations collected from IMD. The results showed a significant decrease in the monthly rainfall from January to May for many areas in the state. Even though the monsoon rainfall has increased in many districts, the reduction in rainfall in the initial five months of the year leads to increased heating in those months which may result in reduced soil moisture and ground water level. August has experienced an increased rainfall trend for many of the districts of the state. Seasonality indices showed maximum values in the coastal region of the state followed by the western and eastern part of the state.
Seasonal coefficient of variation of rainfall was found to be maximum in winter followed by pre monsoon and post monsoon and was minimum in the monsoon season for the period 1901-2000 for all the districts of Kerala in the study by Nair et al. (2014) using the district monthly rainfall data obtained from IMD. There is a decreasing trend in the monthly rainfall in most of the districts in Kerala from 1901 to 2000 especially in the months of January, July and November. Annual rainfall was found to be decreasing in the districts of Kannur, Kozhikode, Malappuram, Palakkad and Alappuzha. Seasonality index, a measure of the distribution of rainfall over a region in a year shows an increasing trend in the districts of Kottayam, Pathanamthitta, Idukki, Thrissur and Wayanad indicating that the rainfall has become less seasonal over the years in those districts. According to Mondalet al., (2014), the monsoon rainfall showed a significant positive trend in the meteorological subdivisions of Konkan, Goa and coastal Karnataka while Kerala showed a non-significant negative trend when the data was analyzed from 1871-2011. There is an increasing trend in the rainfall in Peninsular India as the region receives rainfall from both the Southwest and North east monsoon.
2.3. Temperature Analysis: The annual mean temperature over India showed an increasing trend during 1901-1987 and this was attributed to the increase in maximum temperature (0.6°C/100 years) with the minimum temperatures not revealing any trend (Rupa Kumar et al., 1994; Kothawale et al., 2012). The increase in the maximum temperature over the whole India was more than the increase in the minimum temperature (Srivastava et al., 1992; Arora et al., 2005). Over India, the mean maximum as well as minimum temperatures have increased by about 0.2°C per decade during the period 1971–2003 (Kothawale and Rupa Kumar, 2005; Revadekar et al., 2012). Analysis of 121 stations all over India for the period 1971-2003 by Revadekar et al. (2012) showed that there is widespread warming all over India and higher magnitude changes in temperature extremes are seen in winter months than in other parts of the year.
According to Punia et al., (2015), 1970-2000, the minimum temperature showed an increasing trend in the sites selected for the study in the North-West part of India annually and seasonally while there was no significant trend for maximum temperature for the same time period over the region. A study by Bhutiyani et al.(2007), for the period 1901-2002 confirmed that the North western Himalaya has warmed significantly over the time period. The rise in air temperature in the North western Himalaya has been primarily due to rapid increases in both, the maximum as well as minimum temperatures, with the maximum temperature increasing more rapidly. South Indian stations showed an increase of about 1.06°C (100 year) in mean regional temperature while the West Indian stations showed an increase of about 0.36°C in a study done to look upon the trends in temperature over India using the data from 125 stations distributed all over India (Aroraet al., 2005). According to Kothawale et al. (2005), the maximum as well as minimum temperature during dry months showed significant increasing trend of 1.0 and 0.3°C per hundred years respectively for the period 1901-2007 in South India. Kothawale and Rupa Kumar (2005) reported that the accelerated warming is observed during the period 1971–2003 when compared to the period 1901–2003. The maximum temperature in the West coast showed an increase of 1.2°C (Dash et al., 2007) for the period of 1901-2003 in the analysis of the changes in temperature trends over the temperature homogenous regions over India. Seasonal analysis of minimum temperature over the temperature homogenous regions of India from 1871-2007 showed a significant increase in the West coast and peninsular India for all the seasons with the maximum increase in the minimum temperature for the post monsoon and winter season. The maximum temperature has showed an increasing trend in the west coast of India for the period 1871-2007 in all seasons with a significant increase in the pre monsoon and monsoon seasons. An increasing trend was observed in the annual minimum temperature over the west coast of India (Mondal et al., 2014).
2.4. Water Availability: Land and water are the vital natural resources that sustain the functioning of ecosystem and economic growth of any country. However, burgeoning human population along with the changing lifestyle, urbanisation and industrialisation have caused tremendous pressure on the earth’s natural resources resulting in their over exploitation and depletion leading to an irreversible damage to the ecosystem and biodiversity. This poses a serious threat to the sustainable development to the earth (Biswas et al., 2009; Oki and Kanae, 2006; Uniyal et al., 2015). Climate change is considered as the major driver of the changes in the modern world. It is considered to affect water system through increased/ unusual spatio-temporal variability, long- term temperature and water balance changes which would in turn affect the water and food security, human health and their livelihood and ecosystem (Vorosmarty et al., 2000; UNDP 2007; Richardson et al., 2011). The impacts of climate change are likely to be more evident in the developing countries, especially in those, where agricultural production is the major source of income (Kumar et al., 2006).
Mountains are important sources of water, energy, minerals, forest, agricultural products which are the major elements in the hydrological cycle. They cater to the majority of freshwater needs such as hydroelectric generation, domestic demand, agriculture etc. (Barry, 1990). Climate change has a powerful influence on the environment, ecosystems, water resources and almost each and every aspect of human life. Global warming changes the local and regional water availability by the interaction of the climate system with the hydrologic cycle and in turn affects the water resource system (Arnell et al. 2001; IPCC 2001, 2007, 2013). These interactions result in changes in the magnitude and timing of runoff, frequency and intensity of floods and droughts, rainfall patterns, extreme weather events and quality as well as quantity of available water (Jiang et al., 2007). Changes in the river hydrology may result in flooding, landslides, sedimentation due to intense rainfall events and unreliability of dry season flows that possess risk to water and energy supplies in the lean season (Mir et al., 2015).
Minor changes associated with the global warming like changes in the surface temperature alters the hydrological cycle in the snow–fed regions owing to the shifts in the stream flow pattern (Barnett et al., 2005). The changes in the land use and land cover influences the hydrological response of any river basin. Analysis of the impact of land use changes on runoff is important, as increase in population leads to increased water demand which in turn will be associated with the changes in the land use pattern and hence the use of available natural resources (Khare et al., 2015). Urbanisation alters the hydrological cycle by disturbing the evaporation, transpiration and infiltration processes and has been one of the major causes for the pollution of the natural resources (Misra, 2011). It is one of the major drivers of the changes in the frequency and volume of the groundwater recharges (Foster, 1999; Misra, 2011). Direct anthropogenic impacts along with the human influenced climate change may induce changes in the hydrological cycle and hence changes the natural flow characteristics. Increased temperatures increase evaporation as well as plant transpiration rates, leading to a reduction in the quantity of runoff (Bates et al., 2008; Mittal et al., 2015).
Mehrotra (1999) studied the runoff and soil moisture characteristics in the three basins of central India that are representatives of the humid, moist sub humid and dry sub humid climates and concluded that runoff changes are more evident in the low flow time period and the arid regions are more sensitive to changes in hydrological parameters in response to various climate change scenarios owing to the aridity and metamorphic characteristics of the region. Increased temperature accelerates the rate of evaporation which in turn results in the depletion of the stored water in the region. Jain et al, (2010), has conducted runoff simulation studies in the Satluj basin with the help of GCM models and found that the effect of increased temperature on the annual stream flow is not very severe when compared to the effect on the seasonal stream flow as higher temperatures causes early melting of snow thus increased stream flow during the early summer resulting in the decrease in the water availability of the region during late summer when the water demand is at the peak. Rangan et al. (2010), analysed the rainfall trends and pattern from 1971 to 2007 in the Palni hills of the Southern Western Ghats, and found that the reduction in the South west monsoon together with the increased intensity of rainfall resulted in the reduction of soil moisture and stream flow over the region.
The role of urbanisation in changing the characteristics of hydrological cycle of the Ganga basin was studied by Misra (2011) and it is revealed that the removal of natural land cover and replacing it with buildings and other impervious structures lead to the reduction in the rate and amount of infiltration to the ground and evapo-transpiration and increased surface runoff in the region. Analysis of the temperature and precipitation pattern in the Yellow river basin, China (Wang et al., 2013) showed that the basin has undergone a significant increase in the minimum temperature rather than the maximum temperature which can be attributed to the man-made global warming.
Regression analysis of the temperature and rainfall with the forest and vegetation cover showed that the response varied with seasons and that the vegetation cover varies inversely with temperature (Palmate et al., 2014).Water balance simulation studies in the Baitarani river basin, Odisha (Uniyal et al., 2015) using the SWAT model showed that an increased temperature and rainfall results in decreased average annual surface runoff, base flow and groundwater recharge and an increased evapotranspiration from the baseline condition. The study inferred that the variations in the components of water balance of the study area can be attributed mainly to enhanced anthropogenic influences in the system such as urbanization, industrialization, technological advancements and rapid economic growth.
Khare et al., (2015) has employed the SCS- curve number method to study the runoff characteristics’ changes in the Narmada basin with respect to the changes in the land use of the region from 1990 to 2010 and found out that the runoff has increased and infiltration has reduced considerably in the study region when there was loss in the forest cover and no significant change in the quantity of rainfall received in the basin. Study of the stream flow trends in the Himayat Sagar catchment (Nune et al., 2014) revealed that the stream flow has reduced considerably in the catchment for the period from 1980 to 2004, owing largely to the changes in the land use pattern especially the increase in the agricultural area, with the rainfall pattern not exhibiting any significant changing trend. The declining stream flow trends can be attributed to the increased irrigation and groundwater extractions.
3.1. Data used for the study: The daily rainfall data for the rain gauge stations of Karnataka were obtained from the Directorate of Economics and Statistics, Government of Karnataka for the period 1901-2010 (http://des.kar.nic.in). The daily rainfall data from 1901 to 1970 was downloaded, rain gauge station wise from the National Oceanic and Atmospheric Administration (NOAA) website (http://gis.ncdc.noaa.gov/map/viewer) for Kerala, Tamil Nadu, Maharashtra, Goa and Gujarat. The 0.25°x0.25°degree daily gridded rainfall data for the period 1971 to 2010 and temperature data (for Kerala, Karnataka, Tamil Nadu, Gujarat, Goa and Maharashtra) for the period 1948 to 2010 were downloaded from the website of Terrestrial Hydrology Research Group, Department of Civil and Environmental Engineering, Princeton University (hydrology.princeton.edu/data/pgf/daily). Temporal NDVI data at 500m resolution for land cover analyses were downloaded from the Foreign Agricultural Service subset of the Rapid Response imagery from the Land, Atmosphere Near real-time Capability for EOS (LANCE) system operated by the NASA (National Aeronautics and Space Administration)/GSFC(Goddard Space Flight Centre)/Earth Science Data and Information System (ESDIS)(http://lance- modis.eosdis.nasa.gov/imagery/subsets/ ?project=fas).
The data required for the hydrological calculations in water availability assessment of the Karamana river basin, Thiruvanathapuram, Kerala and Sita river basin, Udupi, Karnataka were obtained from the reports and publications of the various Government departments. The population data as well its decadal changes were obtained from the Registrar General and Census Commissioner of India (http://www.censusindia.gov.in). The livestock population data for 2010 and 1990 were obtained from the livestock census of India published by the Department of Animal husbandry, Dairying and Fisheries (http://dahd.nic.in). The 30m resolution Landsat images for the years 1990 and 2010 were downloaded from the public domains of the United States Geological Survey (http://www.glovis.usgs.gov). The training data of the various land use classes for both the basins were digitized with respect to the google earth data of 2010 (https://earth.google.com). The monthly extra-terrestrial solar radiation values for the basin were taken from the meteorological tables published by the FAO (http://www.fao.org). The details of the crops grown in the basins were obtained from the crop weather calendars (http://www.nfsm.gov.in, http://raitamitra.kar.nic.in) and publications of various State Departments (http://www.prd.kerala.gov.in,http://eands.dacnet.nic.in,http://www.keralaagriculture.gov.in, http://www.spb.kerala.gov.in).
3.2. Rainfall Analysis: The whole study area was grouped into three zones viz., Southern, Central and Northern Western Ghats from the southern tip of India to Gujarat State and analysis was carried out for the Coast, Ghats and Plain region of zone. The rain gauge stations falling in each region of the zone were identified the help of the open source GIS (Geographic Information System) software QGIS (Quantum Geographic Information System) 2.6.1 and principle component analysis (PCA) was carried out in the software ‘PAST – version 3’ to identify the representative station from the group of stations in each region of the zone. For the representative station found out using PCA, trend analysis of annual rainfall using linear regression was done for the whole time period from 1901-2010 as well as for the tri decades 1901-1930, 1930-1960, and 1960-1990 and the two decade of 1991-2010. The missing data for the station were filled using the normal ratio method. The coefficient of variation (CV) for each of the tri decade was worked out for the representative stations (CV= Standard deviation/Mean) in % to find out the variability of rainfall over the tri decades.
The variability in the monthly rainfall over the regions in each zone for the months from May to December was found out by plotting a box plot of rainfall in each month for each tri decade and the tri decadal trend analysis of the monthly rainfall was done for the representative stations of each region found out using PCA.
3.3. Seasonality Index: It is the measure of the rainfall distribution in an area over the months of a year. It helps in identifying the rainfall regimes based on the monthly distribution of rainfall (Guhathakurtha and Saji, 2013).The seasonality index (SI) (Walsh and Lawer 1981; Kanellopoulou 2002; Guhathakurtha and Saji, 2013), which is a function of mean monthly and annual rainfall, is computed using the following formula:
![]()
Where,
Xn – Mean rainfall of month n
R- Mean annual rainfall
The following table is used for identifying the rainfall regimes using the seasonality index
Rainfall regime |
Seasonality index (SI) |
Very equable |
≤0.19 |
Equable but with a definite wetter season |
0.20–0.39 |
Rather seasonal with a short drier season |
0.40–0.59 |
Seasonal |
0.60–0.79 |
Markedly seasonal with a long drier season |
0.80–0.99 |
Most rain in 3 months or less |
1.00–1.19 |
Extreme, almost all rain in 1–2 months |
≥1.20 |
Theoretically, SI can have values from 0 (if all the months have equal rainfall) to 1.83 (if all the rainfall occurs in one month) as classified in Table 1. The seasonality Index was computed for the representative stations in each region of every zone for the entire time period from 1901-2010.
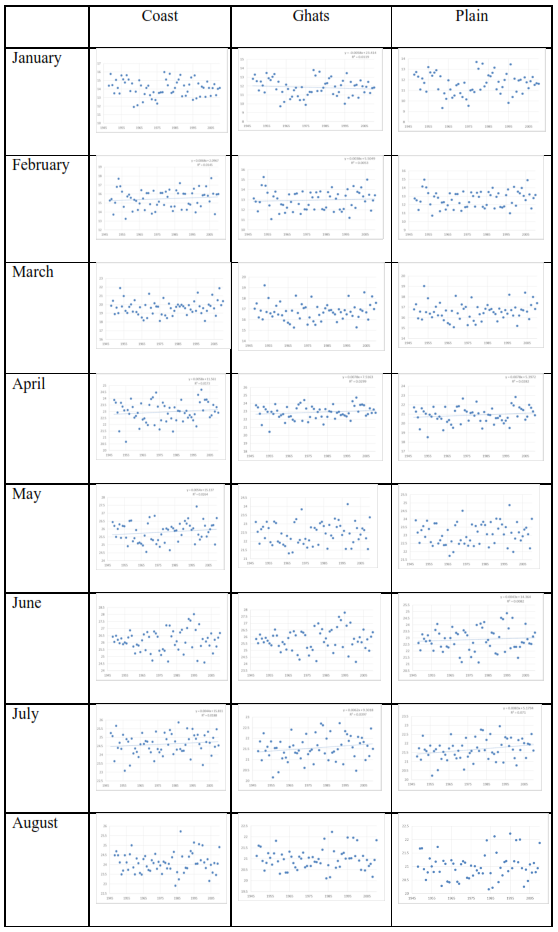
3.4. Temperature analysis: The trend in the annual maximum and minimum temperature was analyzed for the representative stations found out by PCA for each region three zones from the southern end to the northern end of the Western Ghats districts from 1948 to 2010. The monthly temperature trend for the maximum and minimum temperature for all the months was found out using linear regression for the entire time period for the representative stations in each region.
3.5. Land cover analysis: The MODIS NDVI data at 500 m resolution for the years 2005, 2010 and 2015 were downloaded from the USDA Foreign Agricultural Services subsets for the Indian region from the website lance-modis.eosdis.nasa.gov/imagery/subsets/project=fas. The downloaded remote sensing data were clipped to the Western Ghats boundary. The clipped data consisted of three bands namely Red as Band 1 (0.63-0.69 µm), near Infra-red as band 2 (0.75-0.9 µm) and blue as band 3 (0.45-0.515 µm). The NDVI was calculated by the equation 1,
![]()
Where,
NDVI- Normalised Difference Vegetation Index
NIR- Near Infra-red band
This was assigned the colour code ‘gyr’ in the open source GIS software ‘GRASS 7.1 (http://ces.iisc.ac.in/grass)’ (Geographic Resources Analysis Support System). Land cover details were verified using online Google earth data (http:// earth.google.com). Land cover analyses aided in mapping the regions under vegetation as well as non-vegetation.
The land cover analyses were done using the NDVI images and the false colour composite (FCC) generated for the basin for the years 1990 and 2010. The range of NDVI values for the different land use classes was identified using the training dataset digitized using the Google earth images (http://earth.google.com). Accordingly, the whole area was classified into five different land use classes such as forest, plantation, agricultural land, water and others (which include open land and buildings).
3.6. Water availability: The water availability studies have been conducted in the two representative basins, viz., Karamana river basin in Thiruvanathapuram district of Kerala and Sita river basin in Udupi district of Karnataka.
Karamana River: River Karamana flows for 68 km, originates from the Chemmunjimottai peak (1717km)) in the Agastyarkoodam hills of Kerala, in the Western Ghats and drains into the Arabian Sea near Thiruvallom in Thiruvananthapuram district, Kerala. Extending between 8°21’49” N and 8°40’55” N latitudes and 76°49’46” E and 77°14’35” E longitudes, it covers an area of 685.87 sq.km and spread across three taluks namely Thiruvananthapuram, Neyyattinkara and Nedumangad. Two dams have been constructed over the river, namely Peppara and Aruvikkara that serves as the major drinking water source for the Thiruvananthapuram city and Nedumangad town.
Sita River: Sita River flows about 60 km originating at Narasimha parvatha, Hebri, Udupi district of Karnataka, joining the Arabian Sea. Extending between 13°21’16” N to 13°35’ 32” N latitude and 74°40’47” E to 75°09’18” E longitude, basin covers an area of 647.39 sq.km in the three taluks of Udupi district (Udupi, Karkal and Kundapura).
3.6.1 Hydrological calculations: The data of point based daily rainfall and gridded temperature in and around the basin were used to obtain the average monthly rainfall, maximum and minimum temperature of each basin by the method of interpolation. The hydrological parameters were computed on monthly basis.
3.6.1.1 Gross rainfall yield: The gross rainfall yield in the basin was calculated using the equation 2.
![]()
3.6.1.2 Interception: It is the portion of rainfall that doesn’t reach the earth’s surface and is intercepted by the canopy of trees, leaves, rooftops etc. and later get evaporated. The water loss due to interception varies with the type of vegetation (Ramachandra et al., 2015) as given in table 1.
Table 1: lad use wise interception
Vegetation |
Period |
Interception |
Evergreen/semi evergreen forests |
June-October |
I = 5.5 + 0.3 (P) |
Moist deciduous forests |
June-October |
I = 5 + 0.3 (P) |
Plantations |
June-October |
I = 5 + 0.2 (P) |
Agricultural crops (paddy) |
June |
|
July-August |
I = 1.8+ 0.1 (P) |
|
September |
I = 2 + .18 (P) |
|
Grasslands and scrubs |
June-September |
I = 3.5 +0.18 (P) |
October |
I = 2.5 + 0.1 (P) |
3.6.1.3 Net Rainfall Yield: Net rainfall yield is the difference between the gross rainfall and interception losses. It is computed by the equation 3,
![]()
RN = RG – I …3
Where,
RG-Gross rainfall volume in cubic metres
A- Area in hectares
P- Rainfall in mm
RN- Net rainfall yield
I- Interception loss
3.6.1.4 Runoff: It is the portion of rainfall that moves in the stream after rainfall. Surface runoff is computed by the following equation 4 (Subramanya, 1994):
![]()
Where,
Q- Runoff in cubic metres per month
PR- Net rainfall in mm (Gross rainfall – Interception)
C- Runoff coefficient which is dependent on different land use classes as given in the table 2 below (Ramachandra et al., 2015)
Table 2: land use class wise run off coefficient (catchment coefficient)
Land use classes |
Runoff coefficient |
Urban |
0.85 |
Agriculture |
0.60 |
Open lands |
0.70 |
Evergreen forest |
0.15 |
Scrub/Grassland |
0.60 |
Forest Planation |
0.65 |
Agriculture Plantation |
0.50 |
Deciduous Forest |
0.15 |
3.5.1.5 Infiltration: This is the process by which a portion of precipitation enters into the subsurface soil (vadose and groundwater zones). This water flows laterally in the subsurface region towards the streams and contribute to the stream flow during non-monsoon period called pipe flow in post monsoon and base flow in summer. This is computed by the equation 5.
![]()
3.6.1.6 Ground water recharge: A portion of water is infiltrated through the unsaturated i.e., vadose zone and moves to greater depths called the groundwater recharge. Equation 4 (Krishna Rao equation, 1970), which was used to compute the ground water recharge of the basin is given by equation 6,
![]()
Where,
GWR- Groundwater recharge
RC- Groundwater recharge coefficient (as given in table 3)
C- Rainfall coefficient (as given in table 3)
Table 3: Groundwater (C) and rainfall coefficient (Rc) based on quantum of rainfall
Annual Rainfall |
RC |
C |
400 to 600mm |
0.20 |
400 |
|
0.25 |
600 |
> 2000 mm |
0.35 |
600 |
3.6.1.7 Sub-Surface flow (Pipe flow): A part of the infiltrated rainwater is circulated in the unsaturated soil layer and appears in the surface through the drainage channels, known as the sub surface flow. Pipe flow is computed by the equation 7,
![]()
Where,
Pf - Pipe flow
Kp -Pipe flow coefficient
3.6.1.8 Groundwater discharge: This is estimated by the multiplication of the average specific yield of aquifer under each land use class with the recharged water. Specific yield depends upon the water bearing material. Groundwater discharge sustains flow in the river after the monsoon recedes and after the cessation of the pipe flow. It is computed with the equation 8, given below (Ramachandraet al., 2015),
![]()
Where,
GWD- Groundwater discharge
YS -Specific yield
3.6.1.9 Estimation of Water Demand: Evaporation is the process of transfer of water to the atmosphere in the form of vapour. Transpiration is the process by which the water is lost from leaves and other aerial parts of the plant. Hence, evapotranspiration is the total water lost to the atmosphere from the soil, plants and water bodies. Evapotranspiration is influenced by the temperature, humidity, wind speed, intensity and duration of sunlight, plant characteristics and soil characteristics. Potential evapotranspiration is the quantity of water that would have evapo-transpired if there was enough water available to meet the demands of the vegetation whereas actual evapotranspiration is the amount of water lost as evapotranspiration in reality, in a particular region under specific atmospheric and vegetative condition. Equation 9, i.e Hargreaves’ equation (1972) used to compute the potential evapotranspiration in the basin is given as,
![]()
Where,
RA- Extra- terrestrial radiation (MJ/m2/day)
Tmax- Maximum temperature
Tmin- Minimum Temperature
λ- Latent heat of vapourisation of water, 2.501 MJ/ kg
PET- Potential evapotranspiration
Actual evapotranspiration is the product of the potential evapotranspiration and the evapotranspiration coefficient which varies with the land use and is estimated from the equation 10 (Ramachandra et al., 2015),
![]()
Where,
AET- Actual evapotranspiration
KC - Evapotranspiration coefficient (Land use wise Kc is listed in Table 4)
Table 4: Land use wise evapotranspiration coefficient
Land use |
Evapotranspiration coefficient (KC) |
Built-up |
0.15 |
Water |
1.05 |
Open space |
0.30 |
Evergreen forest |
0.95 |
Scrub and grassland |
0.80 |
Forest Plantation |
0.85 |
Agriculture Plantation |
0.80 |
Deciduous forest |
0.85 |
Domestic Demand: The population of the basin for year 2010 was estimated from the taluk population data and for the year 1990, data were estimated using the decadal population change of the district. Domestic water requirement is dependent on the number of persons, season and water requirement per day. Daily water requirement of a person includes the water for drinking, washing, bathing and other basic needs of an individual.
Livestock Water Requirement: The total livestock population of the basin was estimated from the district livestock population. The water demand of livestock and poultry varies with the season (Ramachandra et al., 2015) is listed in Table 5:
Table 5: Water requirement in litres per day
|
Summer |
Monsoon |
Winter |
Human |
150 |
125 |
135 |
Livestock |
85 |
70 |
75 |
Poultry |
0.35 |
0.25 |
0.3 |
Crop water requirement: The water requirement for each crop was estimated considering the cropping pattern followed in the region and the crop growth stage (based on publications like crop calendars, reports of state agriculture department).
The hydrological status in the basin is computed by the balance of the water supply to the demand in each month. The supply of water in each month is through the runoff, soil water and the water stored in the reservoirs, whereas the demand of water is from the human population, livestock and agriculture sector. If water supply in a month can sufficiently cater to the demands of that month, then that month is said to have sufficient or surplus water whereas when the water demand for a month exceeds the water supply, that month experiences a water deficit.
The study area - Western Ghats has been divided into three regions viz., southern Western Ghats, central Western Ghats and northern Western Ghats. Rainfall and temperature analysis of the three above regions was carried out topographically such as the Coast, Ghats and Plains. The results of the same are presented and discussed in this section:
4.1. Rainfall across the Western Ghats
4.1.1. Rainfall across Southern Western Ghats: The mean annual and monthly rainfall over the Coast, Ghats and Plain regions of southern Western Ghats is depicted in Table 6. The annual rainfall is 2751.8 mm over the Coast while 775 mm in the Plains across the southern Western Ghats. The Ghats region experiences an annual rainfall of 1566.6 mm. It revealed that the annual rainfall is high along the Coast and low along the Plains while intermediary across the Ghats region of southern Western Ghats, experiencing the mean annual rainfall of 1697.8 mm. The variation in the rainfall pattern is due to orographic and topographic effects since the windward side (Coast) receives more rainfall while low rainfall towards the leeward side (Plains) of southern Western Ghats.
Table 6: Mean annual and monthly rainfall (mm) in southern Western Ghats
Month |
Coast |
Ghats |
Plain |
SWG |
January |
15.2 |
23.2 |
30.4 |
22.9 |
February |
30.6 |
20.5 |
25.6 |
25.6 |
March |
80.1 |
40.0 |
37.2 |
52.4 |
April |
194.7 |
101.5 |
62.7 |
119.6 |
May |
270.7 |
180.8 |
43.3 |
164.9 |
June |
496.8 |
258.7 |
28.0 |
261.2 |
July |
458.1 |
178.6 |
37.3 |
224.7 |
August |
296.0 |
113.1 |
27.8 |
145.6 |
September |
239.1 |
128.4 |
45.9 |
137.8 |
October |
380.4 |
248.3 |
160.1 |
262.9 |
November |
234.0 |
202.1 |
185.4 |
207.2 |
December |
56.0 |
71.7 |
91.3 |
73.0 |
Annual |
2751.8 |
1566.6 |
775.0 |
1697.8 |
The monthly rainfall over the Coast indicated that June recorded high rainfall (496.8 mm), followed by July (458.1 mm), August (296 mm), May (270.7 mm) and September (239.1 mm). October and November also recorded high rainfall due to influence of North east monsoon. October recorded rainfall of 380.4 mm while November recorded 234 mm rainfall. Thereafter, a significant decline in monthly rainfall is noticed from December to February. Again, March and April received significant rainfall of 194.7 mm and 270.7 mm rainfall, respectively. High rainfall during March, April and May could be explained due to pre-monsoon showers and summer rains as a result of formation of convective clouds towards windward side. Though the monthly rainfall is relatively less over the Ghats of southern Western Ghats when compared to the Coast, the trend in monthly rainfall is similar due to the influence of both southwest and northeast monsoons. However, the monthly rainfall pattern across the Plains is different as November receives high rainfall (185.4 mm), followed by October (160.1 mm). It revealed that the Plains of southern Western Ghats experience more rainfall during the northeast monsoon when compared to that of southwest monsoon. Therefore, it is understood that the Plains of southern Western Ghats are influenced by the Northeast monsoon while the Coast and Ghats regions receive rainfall from both the Southwest and Northeast monsoons (Table 7).
Table 7: Mean seasonal rainfall (mm) in southern Western Ghats
Season |
Coast |
Ghats |
Plains |
SWG |
Monsoon (June – September) |
1490.0 |
678.8 |
139 |
769.3 |
Post monsoon (October and November) |
614.4 |
450.4 |
345.5 |
470.1 |
Winter (December – February) |
101.8 |
115.4 |
147.3 |
121.5 |
Summer (March –May) |
545.5 |
322.3 |
143.2 |
337.0 |
Annual |
2751.7 |
1566.9 |
775.0 |
1697.9 |
The Southwest monsoon season is the major contributor of annual rainfall along the Coast (1490.0 mm) and Ghats (678.8 mm), followed by the north east monsoon / post monsoon season (614.4 mm and 450.4 mm in the Coast and Ghats, respectively) whereas the Plains is greatly influenced by the post monsoon / northeast monsoon season (345.5 mm), followed by winter (147.3mm). The summer rainfall from March to May was also less (143.2 mm) along the Plains when compared to that of Coast (545.5 mm) and Ghats (322.3 mm) as a result of windward and leeward influences due to orographic effect. As a whole, the southern Western Ghats experiences bi-modal rainfall due to the influence of southwest and northeast monsoons. June is the wettest month in this region.
4.1.2. Rainfall across Central Western Ghats: The mean annual and monthly rainfall for the coast, ghats and plains of the central Western Ghats are given in Table 8. The mean annual rainfall was the maximum (4192.7 mm) over the Ghats and minimum (772.1mm) in the plains. The coastal region receives a mean annual rainfall of about 3859.4 mm which is intermediary to the coast and plains. The variation in the rainfall can be attributed to the orography of the region, as the slopes of the Ghats cause heavy rainfall in the region. The monthly rainfall over the coastal region reveals that the month of July recorded the maximum rainfall (1202.4 mm), followed by June (992.2 mm), August (755.2 mm), September (306.2), October (226.5 mm) and May (161.9 mm). The region recorded less rainfall from November to April. Ghats of central Western Ghats follows a similar trend but the plain region receives high rainfall in October (155.2 mm), followed by September (113.8 mm) and May (108.6 mm). It shows that the influence of the north east monsoon is more than that of the south west monsoon in the plain region. It is true in the case of southern Western Ghats.
Table 8: Mean annual and monthly rainfall (mm) in central Western Ghats
Month |
Coast |
Ghats |
Plain |
CWG |
January |
12.9 |
24.9 |
11.7 |
16.5 |
February |
7.4 |
8.3 |
13.2 |
9.6 |
March |
33.0 |
23.8 |
34.3 |
30.4 |
April |
41.7 |
33.4 |
51.3 |
42.1 |
May |
161.9 |
174.6 |
108.6 |
148.4 |
June |
992.2 |
1117.7 |
57.6 |
722.5 |
July |
1202.4 |
1271.3 |
68.8 |
847.5 |
August |
755.2 |
827.8 |
65.7 |
549.6 |
September |
306.2 |
397.9 |
113.8 |
272.6 |
October |
226.5 |
206.0 |
155.2 |
195.9 |
November |
88.3 |
72.7 |
68.0 |
76.3 |
December |
31.8 |
34.2 |
23.8 |
29.9 |
Annual |
3859.4 |
4192.7 |
772.1 |
2941.4 |
Table 9: Mean seasonal rainfall (mm) in central Western Ghats
Season |
Coast |
Ghats |
Plains |
CWG |
|
Monsoon (June – September) |
3256.0 |
3614.7 |
305.9 |
2392.2 |
|
Post monsoon (October and November) |
314.8 |
278.7 |
223.2 |
272.2 |
|
Winter (December – February) |
52.1 |
67.4 |
48.7 |
56.1 |
|
Summer (March –May) |
236.6 |
231.8 |
194.2 |
220.9 |
|
Annual |
3859.5 |
4192.6 |
772.0 |
2941.2 |
|
The mean seasonal rainfall over the central Western Ghats is depicted in Table 9. It is evident that the entire central Western Ghats receives high rainfall during the south west monsoon season, followed by the post monsoon season. Coastal areas receive mean seasonal rainfall of 3256.0 mm, Ghats receive 3614.7 mm and plains receive 305.9mm during south west monsoon season. Mean seasonal rainfall of 314.8mm is received in the coast, 278.7 mm in the Ghats and 223.2 mm in the plains during the post monsoon season.
4.1.3. Rainfall across Northern Western Ghats: The mean annual rainfall and monthly rainfall of the coast, ghats and plains in the northern Western Ghats are given in Table 10. The mean annual rainfall was high (2219.1) in the coast, followed by the Ghats (1828.0 mm) and less in the plains (809.5 mm). Thus, it is evident that the region receives maximum rainfall along the coast and minimum in the plains with the Ghats region receiving intermediary rainfall and this variation can be explained as due to orographic effect.
June was the rainiest month in the coast of the northern Western Ghats with. a recorded rainfall of 671.2 mm, followed by the month of July (659.3 mm), August (418.7 mm), September (272.6 mm), October (95.9 mm) and May (56.7 mm). The period from November to April doesn’t receive significant rainfall over the region. July (705.8 mm) was the rainiest month in the Ghats, followed by August (498.1 mm), September (252.3 mm) and June (246.2 mm). A similar rainfall trend was observed in all the three regions of northern Western Ghats in spite of the variation in the magnitude of rainfall. The northern Western Ghats experiences the influence of Southwest monsoon mostly unlike other two regions viz., southern Western Ghats and Central Western Ghats.
Table 10: Mean annual and monthly rainfall (mm) in northern Western Ghats
Month |
Coast |
Ghats |
Plain |
NWG |
January |
1.4 |
2.0 |
5.1 |
2.8 |
February |
0.1 |
1.1 |
1.1 |
0.8 |
March |
0.7 |
0.9 |
3.2 |
1.6 |
April |
7.5 |
4.9 |
2.7 |
5.0 |
May |
56.7 |
17.7 |
13.1 |
29.2 |
June |
671.2 |
246.2 |
136.5 |
351.3 |
July |
659.3 |
705.8 |
214.9 |
526.7 |
August |
418.7 |
498.1 |
203.0 |
373.3 |
September |
272.6 |
252.3 |
175.0 |
233.3 |
October |
95.9 |
75.6 |
38.7 |
70.1 |
November |
28.6 |
19.6 |
23.0 |
23.7 |
December |
6.6 |
3.9 |
9.7 |
6.7 |
Annual |
2219.3 |
1828.1 |
826.0 |
1624.5 |
The mean seasonal rainfall over the central Western Ghats is depicted in Table 11. It is evident that the entire central Western Ghats receives high rainfall during the south west monsoon season, followed by the post monsoon season. Coastal areas receive mean seasonal rainfall of 3256.0 mm, Ghats receive 3614.7 mm and plains receive 305.9 mm during south west monsoon season. Mean seasonal rainfall of 314.8mm is received in the coast, 278.7 mm in the Ghats and 223.2 mm in the plains during the post monsoon season.
The mean seasonal rainfall in the northern Western Ghats is given in Table 12. South west monsoon season is the major contributor of rainfall in the coast, Ghats and plains of northern Western Ghats unlike in southern and central Western Ghats. Coastal areas receive seasonal rainfall of 2021.8 mm, 1702.4 mm in the Ghats and 729.4 mm in the plains during the south west monsoon.
Table 11: Mean seasonal rainfall in northern Western Ghats
Season |
Coast |
Ghats |
Plains |
Mean |
Monsoon (June – September) |
2021.8 |
1702.4 |
729.4 |
1484.5 |
Post monsoon (October and November) |
124.5 |
95.2 |
61.7 |
93.8 |
Winter (December – February) |
8.1 |
7 |
15.9 |
10.3 |
Summer (March –May) |
64.9 |
23.5 |
19 |
35.8 |
Annual |
2219.3 |
1828.1 |
826.0 |
1624.5 |
The mean annual rainfall over the Western Ghats is 2086 mm (Table 12). The Central Western Ghats experience high rainfall (2941.4 mm) while less (1697.8 mm) across the southern Western Ghats and northern Western Ghats (1618.9 mm). The Ghats receive high rainfall (2529.1 mm), followed by the Coast (2393.4 mm) and the least (785.5 mm) in Plains in all the above three regions. Interestingly, the Ghats and Coast of Central Western Ghats experience heavy rainfall of 4192.7 mm and 3859.4 mm, respectively.
Table 12: Annual rainfall (mm) across Western Ghats
Region |
Southern WG |
Central WG |
Northern WG |
Mean |
Coast |
2751.8 |
3859.4 |
2219.1 |
2393.4 |
Ghats |
1566.6 |
4192.7 |
1828.0 |
2529.1 |
Plains |
775.0 |
772.1 |
809.5 |
785.5 |
Mean |
1697.8 |
2941.4 |
1618.9 |
2086.0 |
The leeward side receives low rainfall evident from annual rainfall of 772.1 mm to 809.5 mm in plains. High rainfall in the central Western Ghats can be attributed to the vortices developed in the head of the off shore trough frequently during the monsoon season and influenced by orography of the region. Off shore troughs develop frequently during the southwest monsoon season along the northern Kerala – Karnataka region. Closed vortices formed at the head of the off shore trough coincide with the location of the central Western Ghats resulting in copious rainfall in the region. Orography of the region with steep slopes in the Ghats also contributes to high rainfall recorded in the region. Plains along the Western Ghats receive less rainfall when compared to the Coast and Ghats. Low rainfall along the Plains can be attributed to the orography of the region as they mostly fall in the leeward side of the Ghats which acts as a barrier for the trade winds to reach the Plains.
4.2. Maximum temperature across Western Ghats: The mean annual and mean monthly maximum temperature of the regions in the southern Western Ghats is given in Table 14. Mean annual maximum temperature was highest in the plains (30.7 °C), followed by coast (30.6 °C) and least in the Ghats (29.8 °C). High maximum temperature observed in the plains and coast can be attributed to the lower elevation and higher humidity respectively. Lower maximum temperature in the Ghats when compared to the coast and plains can be attributed to the higher elevation in the Ghats when compared to the coast and plains.
The coastal areas of southern Western Ghats experience high maximum temperature in the month of March (33.1 °C) followed by April (32.4 °C) and May (31.7 °C). Maximum temperature along the coast was found to be least in the month of August (28.5 °C). May (31.9 °C) is the hottest month along the Ghats of southern Western Ghats followed by March (31.8 °C), April (30.3 °C), February (31.3 °C) and June (30.2 °C). The maximum temperature along the plains of the southern Western Ghats was noticed to be maximum in April (32.4 °C), followed by March (32.2 °C), May (32.1 °C) and February (31.4 °C).
Table 15 depicts the mean annual and mean monthly maximum temperature over the coast, Ghats and plains of the central Western Ghats. Mean annual maximum temperature was found to be highest in the Ghats (30.4 °C) followed by coast (30.2 °C) and the plains (30.0 °C).
Table 14: Mean annual and monthly maximum temperature (°C) in southern Western Ghats
Month |
Coast |
Ghats |
Plain |
Mean |
January |
31.1 |
28.9 |
30.4 |
30.1 |
February |
31.6 |
31.3 |
31.4 |
31.4 |
March |
33.1 |
31.8 |
32.2 |
32.4 |
April |
32.4 |
30.3 |
32.4 |
31.7 |
May |
31.7 |
31.9 |
32.1 |
31.9 |
June |
30.0 |
30.2 |
30.3 |
30.2 |
July |
29.3 |
29.7 |
29.6 |
29.5 |
August |
28.5 |
28.0 |
29.8 |
28.8 |
September |
28.9 |
30.0 |
30.5 |
29.8 |
October |
29.8 |
29.9 |
29.9 |
29.9 |
November |
29.9 |
27.7 |
29.7 |
29.1 |
December |
30.4 |
28.2 |
29.6 |
29.4 |
Annual |
30.6 |
29.8 |
30.7 |
30.3 |
Table 15: Mean annual and monthly maximum temperature (°C) in central Western Ghats
Month |
Coast |
Ghats |
Plain |
Mean |
January |
30.6 |
31.4 |
30.0 |
30.7 |
February |
31.2 |
30.5 |
31.8 |
31.2 |
March |
32.2 |
33.1 |
33.7 |
33.0 |
April |
32.7 |
33.3 |
32.3 |
32.8 |
May |
31.9 |
33.5 |
33.1 |
32.8 |
June |
29.1 |
30.3 |
28.7 |
29.4 |
July |
27.7 |
25.7 |
27.5 |
27.0 |
August |
27.8 |
25.5 |
26.7 |
26.7 |
September |
28.8 |
28.7 |
28.6 |
28.7 |
October |
29.6 |
30.9 |
29.4 |
30.0 |
November |
30.5 |
31.3 |
29.4 |
30.4 |
December |
30.4 |
31.0 |
28.9 |
30.1 |
Annual |
30.2 |
30.4 |
30.0 |
30.2 |
The mean maximum temperature recorded in the coast of central Western Ghats was highest in the month of April (32.7 °C), followed by March (32.2 °C), May (31.9 °C), February (31.2 °C). May (33.5 °C) was hottest month in the Ghats region followed by April (33.3 °C) and March (33.1 °C). The mean maximum temperature along the plains was highest in the month of March (33.7 °C), May (33.1 °C) and April (32.3 °C).
Mean annual and mean monthly maximum temperature over the northern Western Ghats is given in Table 16. The mean annual maximum temperature was highest in the plains (32.9 °C) of the northern Western Ghats and least in the coastal areas (31.1 °C). Ghats region of the northern Western Ghats recorded mean maximum temperature of 31.4 °C which is intermediary to the coastal and plain areas.
Table 16: Mean annual and monthly maximum temperature (°C) in northern Western Ghats
Month |
Coast |
Ghats |
Plain |
Mean |
January |
31.9 |
28.3 |
30.7 |
30.3 |
February |
33.4 |
32.1 |
33.1 |
32.9 |
March |
34.1 |
34.1 |
36.1 |
34.8 |
April |
33.0 |
34.8 |
38.1 |
35.3 |
May |
30.4 |
35.0 |
39.3 |
34.9 |
June |
28.4 |
32.5 |
33.2 |
31.4 |
July |
27.8 |
30.1 |
30.8 |
29.6 |
August |
29.0 |
26.2 |
30.0 |
28.4 |
September |
31.4 |
30.7 |
30.6 |
30.9 |
October |
31.9 |
33.1 |
32.4 |
32.5 |
November |
31.0 |
31.3 |
30.8 |
31.0 |
December |
31.2 |
28.7 |
29.9 |
29.9 |
Annual |
31.1 |
31.4 |
32.9 |
31.8 |
Highest mean maximum temperature was recorded in the month of March (34.1 °C), February (33.4 °C) and April (33.0 °C) in the coastal areas of northern Western Ghats. The Ghats region recorded highest mean maximum temperature in the month of May (35.0 °C), April (34.8 °C), March (34.1 °C). A similar trend was noticed along the plains though the recorded mean maximum temperature were of higher magnitude than the Ghats.
Table 17 shows the mean seasonal maximum temperature in the southern Western Ghats. It reveals that the higher maximum temperature was recorded the in the coast (32.3 °C), Ghats (33.3 °C) and plains (33.0 °C) of the southern Western Ghats during the summer season.
Table 17: Mean seasonal maximum temperature (°C) in southern Western Ghats
Season |
Coast |
Ghats |
Plain |
Mean |
Summer (March –May) |
32.4 |
31.3 |
32.2 |
32.0 |
Monsoon (June – September) |
29.2 |
29.5 |
30.1 |
29.6 |
Post monsoon (October and November) |
29.9 |
28.8 |
29.8 |
29.5 |
Winter (December – February) |
31.0 |
29.5 |
30.5 |
30.3 |
Table 18 shows the mean seasonal maximum temperature in the central Western Ghats. Mean seasonal maximum temperature was found to be highest in the Ghats (33.3 °C) and least in the coast (32.3 °C) during summer while it was intermediary in the plains (33.0 °C). Mean seasonal maximum temperature was high in the Ghats (31.1) during the post monsoon season while in the coast (30.7 °C) and plains (30.2 °C) during Winter season.
Table 18: Mean seasonal maximum temperature (°C) in central Western Ghats
Season |
Coast |
Ghats |
Plain |
Mean |
Summer (March –May) |
32.3 |
33.3 |
33.0 |
32.9 |
Monsoon (June – September) |
28.4 |
27.6 |
27.9 |
28.0 |
Post monsoon (October and November) |
30.1 |
31.1 |
29.4 |
30.2 |
Winter (December – February) |
30.7 |
31.0 |
30.2 |
30.6 |
Mean seasonal maximum temperature over the northern Western Ghats is given in Table 19. Mean seasonal maximum temperature was found to be highest in the plains (37.8 °C) and least in the coast (32.5 °C) in summer. Ghats recorded intermediary mean seasonal maximum temperature of 34.6 °C during summer. Mean maximum temperature was high in the post monsoon season next to the summer season in the Ghats (32.2 °C) and plains (31.6 °C) but coastal areas recorded second highest in the winter season (32.2 °C).
Table 19: Mean seasonal maximum temperature (°C) in northern Western Ghats
Season |
Coast |
Ghats |
Plain |
Mean |
Summer (March –May) |
32.5 |
34.6 |
37.8 |
35.0 |
Monsoon (June – September) |
29.2 |
29.9 |
31.2 |
30.1 |
Post monsoon (October and November) |
31.5 |
32.2 |
31.6 |
31.8 |
Winter (December – February) |
32.2 |
29.7 |
31.2 |
31.0 |
Table 20 lists the maximum temperature across the Western Ghats. The mean annual maximum temperature was found to be highest in the plains (31.2 °C), followed by the coast (30.6 °C). It was observed to be the least in the Ghats, which recorded mean annual maximum temperature of 30.5 °C.
Table 20: Mean maximum temperature (°C) over the Western Ghats
Region |
Southern WG |
Central WG |
Northern WG |
WG |
Coast |
30.6 |
30.2 |
31.1 |
30.6 |
Ghats |
29.8 |
30.4 |
31.4 |
30.5 |
Plains |
30.7 |
30.0 |
32.9 |
31.2 |
Mean |
30.4 |
30.2 |
31.8 |
|
4.3. Minimum temperature across Western Ghats: Table 21 depicts the mean annual and mean monthly minimum temperature over the southern Western Ghats. Mean annual minimum temperature was lowest in the Ghats (21.5 °C) when compared to coast (23.2 °C) and plains (23.2 °C). High elevation in the Ghats region is likely to be a factor in the lower minimum temperature than the Ghats and plains.
The least recorded mean minimum temperature along the coast was in the month of January (22.0 °C), followed by December (22.3 °C) while the months of February, July and September recorded mean minimum temperature of 22.5 °C. October (17.1 °C) recorded the least mean minimum temperature along the Ghats of southern Western Ghats, followed by September (17.5 °C), May (18.8 °C) and January (19.9 °C). August (19.6 °C) was the coolest month in the plains along the southern Western Ghats followed by January (21.2 °C), December (21.5 °C) and February (21.8 °C).
Table 21: Mean annual and monthly minimum temperature (°C) in southern Western Ghats
Month |
Coast |
Ghats |
Plain |
SWG |
January |
22.0 |
19.9 |
21.2 |
21.0 |
February |
22.5 |
20.4 |
21.8 |
21.6 |
March |
23.5 |
23.5 |
23.2 |
23.4 |
April |
24.6 |
24.4 |
25.4 |
24.8 |
May |
25.0 |
18.8 |
25.5 |
23.1 |
June |
24.3 |
24.1 |
25.0 |
24.5 |
July |
22.5 |
23.5 |
24.5 |
23.5 |
August |
23.4 |
23.6 |
19.6 |
22.2 |
September |
22.5 |
17.5 |
24.0 |
21.3 |
October |
22.7 |
17.1 |
23.6 |
21.1 |
November |
22.8 |
22.8 |
22.7 |
22.8 |
December |
22.3 |
22.3 |
21.5 |
22.0 |
Annual |
23.2 |
21.5 |
23.2 |
22.6 |
Mean annual and monthly minimum temperature of central Western Ghats is given in Table 22. It reveals that the mean annual minimum temperature is found to be least in the plains (19.8 °C), followed by the Ghats (20.6 °C) and higher in the coast (22.5 °C).
Least mean minimum temperature was recorded in the month of January (19.4 °C) followed by December (19.8 °C), February (20.4 °C), November (21.4 °C) and March (22.4 °C) in the coastal areas of central Western Ghats. January (16.7 °C) recorded lowest mean minimum temperature in the Ghats of the central Western Ghats followed by February (17.8 °C), November (18.7 °C) and December (19.0 °C). Mean minimum temperature along the plains of central Western Ghats was noticed to be least in the month of January (16.7 °C) followed by December (16.9 °C), February (17.8 °C), November (18.7 °C) and March (19.9 °C).
Table 22: Mean annual and mean monthly minimum temperature (°C) in central Western Ghats
Month |
Coast |
Ghats |
Plain |
Mean |
January |
19.4 |
16.7 |
16.7 |
17.6 |
February |
20.4 |
17.8 |
17.8 |
18.7 |
March |
22.4 |
20.1 |
19.9 |
20.8 |
April |
24.1 |
23.4 |
21.7 |
23.1 |
May |
24.5 |
21.9 |
21.9 |
22.8 |
June |
23.6 |
23.6 |
21.1 |
22.8 |
July |
23.3 |
20.9 |
20.9 |
21.7 |
August |
24.2 |
23.0 |
21.1 |
22.8 |
September |
23.9 |
22.1 |
20.3 |
22.1 |
October |
22.7 |
20.1 |
20.1 |
21.0 |
November |
21.4 |
18.7 |
18.7 |
19.6 |
December |
19.8 |
19.0 |
16.9 |
18.6 |
Annual |
22.5 |
20.6 |
19.8 |
20.9 |
Table 23 shows the mean annual and mean minimum temperature over the northern Western Ghats. The mean annual minimum temperature is found to lowest in the plain (18.0 °C) and high in the coast (21.1 °C). Ghats experience mean annual minimum temperature of 18.9 °C which is slightly higher than the plains.
Along the coastal region, the mean minimum temperature was noticed to be lowest in the month of January (14.1 °C) followed by December (15.4 °C), February (15.5 °C) and November (18.5 °C). January (11.8 °C) was the coolest month in the Ghats of central Western Ghats followed by February (13.0 °C), December (14.9 °C), March (16.8 °C) and November (17.2 °C). The plains along the northern Western Ghats recorded lowest mean minimum temperature in January (11.6 °C), followed by December (11.7 °C), February (12.7 °C), November (15.1 °C) and March (16.6 °C).
Table 23: Mean annual and mean monthly minimum temperature (°C) in northern Western Ghats
Month |
Coast |
Ghats |
Plain |
Mean |
January |
14.1 |
11.8 |
11.6 |
12.5 |
February |
15.5 |
13.0 |
12.7 |
13.7 |
March |
19.7 |
16.8 |
16.6 |
17.7 |
April |
23.0 |
22.9 |
20.9 |
22.3 |
May |
25.8 |
22.4 |
23.1 |
23.8 |
June |
26.1 |
25.8 |
22.9 |
24.9 |
July |
24.6 |
21.5 |
21.7 |
22.6 |
August |
24.1 |
21.0 |
21.0 |
22.0 |
September |
23.8 |
20.3 |
20.3 |
21.5 |
October |
22.3 |
18.8 |
18.6 |
19.9 |
November |
18.5 |
17.2 |
15.1 |
16.9 |
December |
15.4 |
14.9 |
11.7 |
14.0 |
Annual |
21.1 |
18.9 |
18.0 |
19.3 |
Mean seasonal minimum temperature across the southern Western Ghats is given in Table 24. Mean minimum temperature is lowest in the Ghats (20.0 °C) during the post monsoon season followed by the plains (21.5 °C) and high in the coast (22.3 °C) during winter season.
Table 24: Mean seasonal minimum temperature (°C) in southern Western Ghats
Season |
Coast |
Ghats |
Plain |
Mean |
Summer (March –May) |
24.4 |
22.2 |
24.7 |
23.8 |
Monsoon (June – September) |
23.2 |
22.2 |
23.3 |
22.9 |
Post monsoon (October and November) |
22.8 |
20.0 |
23.2 |
22.0 |
Winter (December – February) |
22.3 |
20.9 |
21.5 |
21.5 |
Table 25 indicates the mean seasonal minimum temperature in the central Western Ghats. The mean seasonal minimum temperature is found to be lowest in the plains (17.1°C) followed by the Ghats (17.8 °C) and highest in the plains (19.9 °C) during the winter season.
Table 25: Mean seasonal minimum temperature (°C) in central Western Ghats
Season |
Coast |
Ghats |
Plain |
Mean |
Summer (March –May) |
23.7 |
21.8 |
21.2 |
22.2 |
Monsoon (June – September) |
23.8 |
22.4 |
20.9 |
22.3 |
Post monsoon (October and November) |
22.1 |
19.4 |
19.4 |
20.3 |
Winter (December – February) |
19.9 |
17.8 |
17.1 |
18.3 |
Mean seasonal minimum temperature across the northern Western Ghats is depicted in Table 26. It revealed that the mean seasonal minimum temperature was lowest in the plains (12.0 °C) and highest in the coast (15.0 °C) during winter season. Ghats region recorded minimum temperature of 13.2 °C which is intermediary to the coast and Ghats.
Table 26: Mean seasonal minimum temperature (°C) in northern Western Ghats
Season |
Coast |
Ghats |
Plain |
Mean |
Summer (March –May) |
22.8 |
20.7 |
20.2 |
21.2 |
Monsoon (June – September) |
24.7 |
22.2 |
21.5 |
22.8 |
Post monsoon (October and November) |
20.4 |
18.0 |
16.9 |
18.4 |
Winter (December – February) |
15.0 |
13.2 |
12.0 |
13.4 |
4.4. Land Cover Analysis of Western Ghats
The land cover analysis was done to study the changes in the vegetation cover over the area from 2005 to 2015 (Fig.1). Analysis showed a decrease in vegetation cover in northern Western Ghats and eastern part of entire stretch from south to north of Western Ghats.
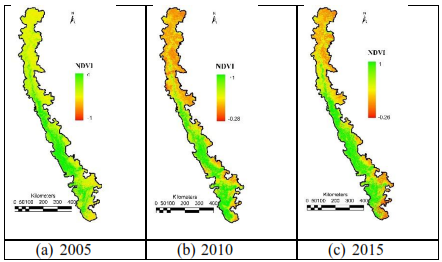
Fig.1. NDVI images of Western Ghats
Decrease in the green area in northern Western Ghats in the year can be attributed to the agricultural land left barren due to the reduction in water available for irrigation as a result of drought in 2009. The loss of vegetation in the eastern part can be attributed to the conversion of agricultural lands to built-up area and open lands.
4.5. Water Availability studies in the Karamana and Sita river basins
Karamana basin
4.4.1. Land use: Land use analyses was done using the NDVI-land cover images (shown in Fig. 2) generated from Landsat imageries of the basin for the years 1990 and 2010.The basin is predominantly covered with coconut and rubber plantations in both the time periods.
Table 27: Land uses (percentage) in Karamana basin
Land use |
1990 (% of the basin area) |
2010 (% of the basin area) |
Forest |
15.8 |
15.26 |
Plantation |
74.13 |
66.48 |
Agriculture |
1.59 |
0.90 |
Water bodies |
1.26 |
1.14 |
Others |
7.21 |
16.23 |
The land cover in the Karamana basin indicated that the area under plantation decreased from 74.13% to 66.48 % from 1990 to 2010 respectively. In the case of agriculture, the decline was from 1.59 % to 0.9 % during the same period i.e. in the last 20 years. The basin area under forests was 15.8 % in 1990 while 15.26 % in 2010. In the case of water bodies, it covered 1.26 % of the basin area in 1990 while it got reduced to 1.14 % of the basin area in 2010. The area under the land cover class ‘Others’ which include open lands and buildings increased drastically from 7.21 % in 1990 to 16.23 % in 2010. It is evident that there was a significant change in the land cover since last 20 years in the Karamana basin since there was a decline in the area under forest, plantation, agriculture and water bodies due to man- made intervention in the activities like construction of buildings and land filling and conversion of water bodies to agriculture and plantation areas (Table 27). The hilly areas are dominated by the Shola forests and rubber plantations whereas the midlands and the coastal areas are covered by the coconut plantations.
4.4.2. Rainfall: The basin receives rainfall from both southwest and north east monsoon (from mid-May to October). Monthly rainfall in the basin is calculated based on the data from the 15 rain gauge stations located within and around the basin area. The basin receives an average annual rainfall of about 2000 mm. Long term analysis show that the rainfall has been decreasing and maximum as well as minimum temperature has been increasing in the basin. This is in agreement with the studies that revealed a decreasing trend in rainfall in the region (Krishnakumar et al., 2009; Nair et al., 2014).
Interception losses are assumed to be zero for the months in which the rainfall is less than 50 mm, as it is accounted in the evapotranspiration losses. Runoff water primarily caters to the demand of water in the basin in each month. When the runoff water fails to meet the demands, water in the vadose zone is utilized to cater the needs, i.e., Water in the vadose zone contributes to streamflow after cessation of precipitation. When the vadose water doesn’t completely meet the water demand of the basin for the month, water is supplied by the ground water discharge.
Analysis of the water balance in the basin, taking into consideration, the average annual rainfall in the basin until the particular year, land use in the year and the water demand, indicated that the basin witnessed a water deficit of about 2 months (i.e. April and May) in catering to the needs of the basin. The mean annual average rainfall was about 2200 mm in the year 1990 and has reduced to 2000 mm in the year 2010. Forests showed no significant reduction in area in these 2 decades. There has been a reduction in the agriculture and plantation area whereas the area under the ‘Others’ category has increased considerably owing to an increase in the built-up area. The water balance studies of the basin for the year 2010 showed that there is water deficit in Karmana basin for 5 months from January to May. This can be attributed to higher demand of horticultural activities.
If the current land use pattern and water demand persists, the basin would experience a water deficit of about 3-5 months in case of normal monsoon year, water deficit of 2 months or less in case of an excess monsoon and 6-9 months’ water deficit in case of a moderate drought in the basin (Fig.3). Hence, if the trend of decreasing rainfall continues in the basin, it is predicted to have more than 6 months of water deficit from December to May.
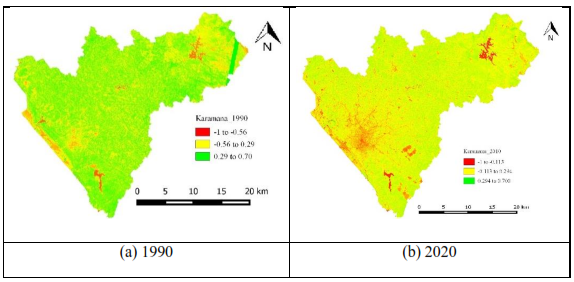
Fig. 2. Land cover of Karamana river basin
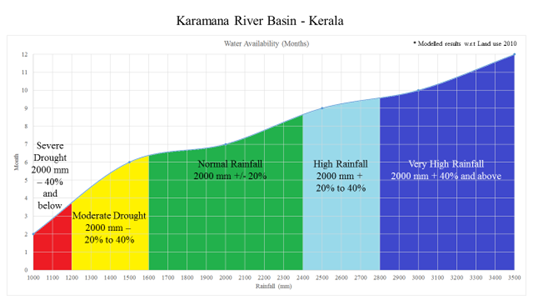
Fig. 3. Water availability versus Rainfall in Karamana basin
Sita Basin
4.4.3 Land Cover: Land cover analyses were done using the NDVI images (Fig.4) of the basin generated from the Landsat images for the years 1990 and 2010. The basin is covered by evergreen forests in the hilly areas, while agricultural lands occupy a major portion of the coastal region. The basin has undergone a marginal decrease in the forest cover and an increase in the area under agriculture and plantation in the time period 1990 to 2010 (Table 28).
Table 28: Land Use percentage in Sita basin
Land use |
1990 (percentage of the basin area) |
2010 (percentage of the basin area) |
Forest |
37.90 |
36.02 |
Plantation |
26.84 |
24.43 |
Agriculture |
31.73 |
36.53 |
Waterbodies |
1.66 |
1.43 |
Others |
1.87 |
1.59 |
Land use analysis of Sita river basin reveal that area under forest has reduced from 37.9 % in 1990 to 36.02 % in 2010. There was a decrease in the plantation area from 26.84 % in 1990 to 24.43 % in 1990 while the agriculture area has increased from 31.73 % in 1990 to 36.53 % in 2010 in the Sita basin. The area under water bodies covered 1.66 % of the total basin area in 1990 but has reduced marginally to 1.43 % in 2010. The area under the land cover category ‘Others’ has also reduced marginally from 1.87 % in 1990 to 1.59% in 2010 (Table 28). It is noticed that the agricultural and plantation areas have increased in the basin from 1990 to 2010.
4.4.4 Rainfall: Major share of the annual rainfall received in the basin is from the South West monsoon. Monthly rainfall is calculated using the data from 14 rain gauge stations situated within and surrounding the Sita basin. Basin receives average annual rainfall of 4980 mm. Rainfall, maximum and minimum temperature of the basin is showing an increasing trend as revealed in the long term analysis of rainfall and temperature. Similar results were obtained in the studies analyzing the rainfall and temperature trends in the coastal Karnataka (Kumar et al., 2010; Jain, 2012). Water balance studies in the basin using the land use characteristics, monthly rainfall, maximum and minimum temperature, showed that basin doesn’t suffer any deficiency of water in both the time periods, 1990 and 2010. This can be attributed to the copious rainfall received in the basin annually. The abundant rainfall received in the basin caters to the human, livestock and crop water demand. In the years of monsoon failure, the basin would suffer a water deficit in few months depending upon the extent of drought occurred. If the land use pattern of 2010 continues in the basin, the basin would suffer a water deficit of 3-4 months in case of a moderate drought and a water deficit of 5 months or more in case of a severe drought (Fig.5).
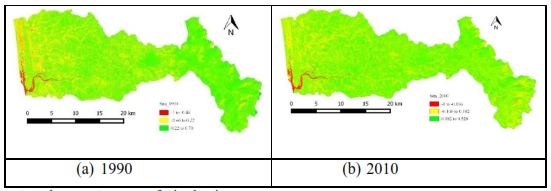
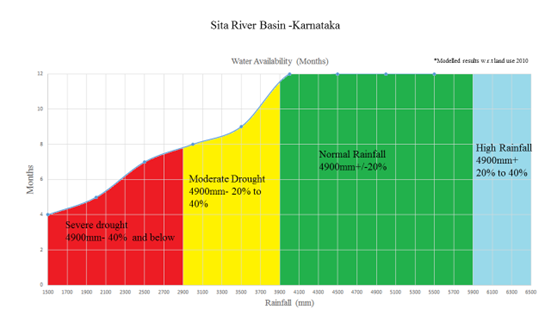
Fig.5. Water availability versus Rainfall in Sita basin
The present study involves the analyses of trends in rainfall (1901 – 2010) and temperature (1948-2010) in the Coast, Ghat and Plain regions of the southern, central and northern Western Ghats and the land use and water availability in two river basins, viz., Karamana in Thiruvananthapuram District of Kerala and Sita in Udupi District of Karnataka. The results obtained are summarized below:
The mean annual rainfall was high (2941.4mm) in the Central Western Ghats (Karnataka and Goa) while intermediary (1697.8mm) across the Southern Western Ghats (Kerala and Tamil Nadu) and low (1618.9 mm) in the Northern Western Ghats (Maharashtra and Gujarat) against the normal rainfall (2086mm) of the Western Ghats as a whole. Across the Western Ghats, the Ghats region experiences high rainfall (2529.1mm), followed by the Coast (2393.4 mm) and Plains (785.5 mm). All the three regions of the Western Ghats followed similar pattern of annual rainfall. It does not show any trend in the Coastal region but shows a decreasing trend in Ghats region and an increasing trend in the Plain Region. High annual rainfall in the Central Western Ghats, especially in the Ghats and the Coast can be attributed to the frequent development of closed vortices (a sort of cyclonic circulation) in the head of the off-shore troughs during the monsoon season.
The mean monthly rainfall was high (532.9 mm) in July, followed by June (445.0 mm), August (356.2 mm), September (241.6 mm) and October (176.3 mm) while low from December to April across the Western Ghats as a whole, indicating that southwest monsoon play a major role in deciding annual rainfall, followed by post monsoon except the Plains over which the influence of post monsoon/northeast monsoon is high.
The mean seasonal rainfall of southern Western Ghats also indicated that southwest monsoon is the major contributor of annual rainfall along the Coast (1490.0 mm) and Ghats (678.8 mm), followed by northeast monsoon / post monsoon season (614.4 mm and 450.4 mm in the Coast and Ghats respectively) whereas the Plains is greatly influenced by the post monsoon/northeast monsoon (345.5 mm), followed by winter (147.3mm) and summer (143.2 mm) rainfall.
The monthly rainfall over the Coast of the Southern Western Ghats indicated that June recorded high rainfall (496.8 mm), followed by July (458.1 mm), August (296 mm), May (270.7 mm) and September (239.1 mm). Though the monthly rainfall is less over the Ghats of southern Western Ghats when compared to the Coast, the trend in monthly rainfall is similar due to the influence of both southwest and northeast monsoons. In contrast, the monthly rainfall pattern across the Plains is different as November receives high rainfall (185.4 mm), followed by October (160.1 mm), revealing that the Plains of southern Western Ghats experience more rainfall during the northeast monsoon when compared to that of the southwest monsoon while it was the southwest monsoon which influences most along the Coast and Ghats regions. The monthly rainfall of southern Western Ghats showed an increasing trend in the Plains during May, July, August, September and October while decreasing from May to December in the Ghats region. The Coastal region doesn’t exhibit any trend in rainfall.
The monthly rainfall over the Coastal region of the central Western Ghats reveals that July recorded the maximum rainfall (1202.4 mm), followed by June (992.2 mm), August (755.2 mm), September (306.2), October (226.5 mm) and May (161.9 mm). The Ghats of central Western Ghats followed a similar trend but the Plain region receives high rainfall in October (155.2 mm), followed by September (113.8 mm) and May (108.6 mm). The monthly rainfall in the central Western Ghats over the Coast, Ghats and Plain regions of the Central Western Ghats did not show any considerable change in rainfall trends. This region also received high rainfall during the southwest monsoon season, followed by the post monsoon season. The Coastal areas receive mean seasonal rainfall of 3256.0 mm, Ghats receive 3614.7 mm and Plains receive 305.9 mm during southwest monsoon season. It reveals that the Ghat region receives relatively high rain fall when compared to that of the Coast and Plains across the central Western Ghats unlike southern and northern Western Ghats, where the Coastal areas receive high rainfall.
June was the wettest month in the Coast of the northern Western Ghats with a recorded rainfall of 671.2 mm, followed by July (659.3 mm), August (418.7 mm), September (272.6 mm), October (95.9 mm) and May (56.7 mm). The period from November to April doesn’t receive significant rainfall over the region. July (705.8 mm) was the rainiest month in the Ghats, followed by August (498.1 mm), September (252.3 mm) and June (246.2 mm). A similar rainfall trend was observed in the Plain regions of northern Western Ghats in spite of the variation in the magnitude of rainfall. The monthly rainfall over the Coastal region of the northern Western Ghats has shown an increasing trend in June and September while decreasing trend in May and July. The Ghats region showed a decreasing trend in rainfall from June to October. The rainfall was found to be increasing in June and August while it decreased in the months of May, October and November across the Plains. The mean seasonal rainfall over the Coast is 314.8mm while 278.7 mm in the Ghats and 223.2 mm in the Plains during the post monsoon season. The southwest monsoon season is the major contributor of rainfall in the Coast, Ghats and Plains of northern Western Ghats unlike in southern and central Western Ghats. Coastal areas receive high seasonal rainfall of 2021.8 mm, followed by Ghats (1702.4 mm) and the Plains (729.4 mm) in the plains during the southwest monsoon.
The Seasonality Index (SI) doesn’t show any significant trend over the Coast and Ghats regions of the southern Western Ghats while decreasing trend in the Plain region. It did not show any significant changing trend for the past 110 years in the Coast, Ghats and Plain region of the central Western Ghats. The Plain region of the northern Western Ghats showed an increase in the Seasonality Index in the recent years indicating that the total rainfall received over the region has been confined to shorter periods of the year thus experiencing a longer dry spell unlike in the central and southern Western Ghats. However, the Plain region of southern Western Ghats experienced less dry spell since the Seasonality Index showed declining trend.
The mean annual maximum temperature was high in the Plains (31.2 °C) of the Western Ghats as a whole, followed by the Coast (30.6 °C) and low (30.5 °C) across the Ghats, indicating the influence of altitude on temperature. It was found to be high in the northern Western Ghats (31.8 °C) and least in the central Western Ghats (30.2 °C) while intermediary in the southern Western Ghats (30.4 °C).
The Plain region of southern Western Ghats experienced high maximum temperature (30.7 °C), followed by the Coast (30.6 °C) and least in the Ghats (29.8 °C). In contrast, it was high in the Ghats (30.4 °C), followed by the Coast (30.2 °C) and the Plains (30.0 °C) over central Western Ghats. Across the northern Western Ghats, the mean annual maximum temperature was high in the plains (32.9 °C) and low across the Coast (31.1 °C) while intermediary over the Ghats region (31.4 °C). The trends in annual maximum temperature showed an increasing trend in the Coast, Ghats and Plain region over southern, central and northern Western Ghats except a marginal decrease in the Coast and Plains of the northern Western Ghats during winter and summer.
The Coastal areas of southern Western Ghats experience high maximum temperature in March (33.1°C), followed by April (32.4 °C) and May (31.7 °C) while the least in August (28.5 °C). May (31.9 °C) is the hottest month along the Ghats of southern Western Ghats, followed by March (31.8 °C), April (30.3 °C), February (31.3 °C) and June (30.2 °C). The maximum temperature along the Plains of the southern Western Ghats was noticed to be maximum in April (32.4 °C), followed by March (32.2 °C), May (32.1 °C) and February (31.4 °C). High maximum temperature was recorded the in the Ghats (33.3 °C), followed by Plains (33.0 °C) and low across the Coast (32.3 °C) of the southern Western Ghats during summer. The mean maximum temperature recorded in the Coast of central Western Ghats was high in April (32.7 °C), followed by March (32.2 °C), May (31.9 °C), February (31.2 °C). May (33.5 °C) was the hottest across the Ghats region, followed by April (33.3 °C) and March (33.1 °C). The mean maximum temperature along the Plains was high in March (33.7 °C), May (33.1 °C) and April (32.3 °C). It was found to be high across the Ghats (33.3 °C) and low across the Coast (32.3 °C) during summer while intermediary in the Plains (33.0 °C).
The mean maximum temperature is high (34.1 °C) in March, February (33.4 °C) and April (33.0 °C) in the Coastal areas of northern Western Ghats. The Ghats region recorded high maximum temperature in May (35.0 °C), April (34.8 °C), March (34.1 °C). A similar trend was noticed along the Plains though it was of higher magnitude than the Ghats. Mean seasonal maximum temperature was found to be high in the Plains (37.8 °C) and low across the Coast (32.5 °C) in summer while intermediary over the Ghats (34.6°C).
The mean maximum temperature of Western Ghats as a whole experience more than 330 C in summer and a sudden drop was noticed with the commencement of southwest monsoon due to heavy downpour of rains. It was high in March (33.4 °C), followed by April (33.3 °C), May (33.2 °C), February (31.8 °C)and low in August (27.9 °C).
The mean annual minimum temperature across the Western Ghats was high in the Coast (22.3 °C), followed by Ghats (20.3 °C) and Plains (20.3 °C). It was low (21.5 °C) across the Ghats when compared to Coast (23.2 °C) and Plains (23.2 °C) over the southern Western Ghats. High elevation in the Ghats region is likely to be a factor for low minimum temperature than the Coast and Plains. The mean annual minimum temperature of central Western Ghats is found to be least in the plains (19.8 °C), followed by the Ghats (20.6 °C) and high in the Coast (22.5 °C). It was found to be low in the Plain (18.0 °C) and high in the Coast (21.1 °C) across the Northern Western Ghats while the Ghats experience the mean annual minimum temperature of 18.9 °C. The annual minimum temperature doesn’t show any consistent trends in most of the regions except in the Ghats region of the northern Western Ghats which shows a marginal decreasing trend. It is an indication that the temperature range (difference between maximum and minimum temperatures) is likely to widen across the northern Western Ghats.
The mean seasonal minimum temperature across the southern Western Ghats is low in the Ghats (20.0 °C) during the post monsoon season, followed by the Plains (21.5 °C) and high in the Coast (22.3 °C) during winter season. It is found to be low in the Plains (17.1°C), followed by the Ghats (17.8 °C) and high in the Coast (19.9 °C) during the winter across the central Western Ghats. The northern Western Ghats revealed that the mean seasonal minimum temperature was low in the Plains (12.0 °C) and high in the Coast (15.0 °C) during winter. Ghats region recorded minimum temperature of 13.2 °C which is intermediary to the Coast and Plains.
The mean monthly minimum temperature was low in January (17.0°C), followed by February (18.0 °C), December (18.2 °C), November (19.8 °C) and March (20.6 °C) across the entire Western Ghats. It was low in January (22.0 °C), along the Coast, followed by December (22.3 °C) while February, July and September recorded mean minimum temperature of 22.5 °C.
The mean monthly minimum temperature doesn’t exhibit any trend in the Plain region of northern Western Ghats while marginal decreasing over the Coastal and Ghat regions while the southern and central Western Ghats have shown an increasing trend over the Coast, Ghats and Plains.
The land use pattern over the Karamana Basin (Thiruvananthapuram, Kerala) clearly indicated that there was a decline in area of forests, plantations, agriculture and water bodies in 2010 when compared to that of 1990 while other sectors like construction of buildings increased significantly. Similar was the case in the Sita Basin of Karnataka also except in agricultural sector. Anthropogenic activities such as deforestation, intense horticulture and irrigation are some of the reasons for change in land use pattern across the two basins since last twenty years.
Water availability studies in Karamana river basin revealed that the water yield from the basin doesn’t completely fulfill the water needs of the basin. The basin suffers a deficit in water supply from January to May due to mismanagement of natural resources such as forests, water received from rainfall when compared to the huge water demand in the basin due to intense horticulture and agriculture. The situation will aggravate due to the likely scenario of a reduction in rainfall in the region in ensuing years. In contrast, the Sita river basin receives annual average rainfall of about 4900mm,presence of higher natural forest cover in the basin, and proper management of water has helped in catering water demand across the year (both in normal rainfall events and high rainfall events). In the case of drought years, water deficit is expected for 3-4 months in the basin from February to May.
Conclusion: The Central Western Ghats experience high rainfall when compared to that of northern and southern Western Ghats. The Ghat region, as a whole, experiences high rainfall when compared to the Coast and Plains. Rainfall during the southwest monsoon contributes a major portion of annual rainfall over the Coast and Ghats while the Plain region experiences relatively high rainfall during the Northeast monsoon season. Rainfall trends indicated that there was a decline over the southern Western Ghats while not so in other two viz., central and northern Western Ghats. Overall, there was an increasing trend in maximum and minimum temperatures over the Western Ghats except in the Plain region of northern Western Ghats. Rainfall and temperature variations, urbanization and deforestation are the main reasons for change in land use pattern across the two basins since last twenty years. The basin suffers a deficit in water supply from January to May due to mismanagement of resources (natural forest and rainfall), situation tends to aggravate due to the likely scenario of a reduction in rainfall in the region in ensuing years. In contrast, the Sita river basin receives average annual rainfall of about 4900mm and due to the presence of higher natural forest cover, the basin doesn’t suffer scarcity of water during the normal rainfall years, where as in case of drought events, basin suffers water deficiency of 3 to 4 months.
- Alvi, S. M. A. and Koteswaram, P. 1985. Time series analysis of annual rainfall over India.Mausam.36: 479-490.
- Arnell, N.W. 1999. Climate change and global water resouces.Glob. Environ. Chang.9: 31-49.
- Arora, M., Goel, N. K. and Singh, P. 2005. Evaluation of temperature trends over India. Hydrolog. Sci. J. 50: 81-94.
- Attri, S.D. and Tyagi, A. 2010.Climate profile of India. Met Monograph Environmental Meteorology No 1/2010. 122p
- Barnett, T.P., Adam, J.C. and Lettenmaier, D.P. 2005. Potential impacts of a warming climate on water availability in snow-dominated regions.Nature. 438:303-309.
- Barry, R.G. 1990.Changes in mountain climate and glacio-hydrological responses.Mountain Res. Dev. 10:161-170.
- Bhutiyani, M. R., Kale, V. S. and Pawar, N. J. 2007.Long-term trends in maximum, minimum and mean annual air temperatures across the Northwestern Himalaya during the twentieth century.Climatic Change. 85:159–177.
- Biswas AK, Tortajada C, Izquierdo R (eds) (2009) Water management in 2020 and beyond. Springer, Berlin.
- Climate change and India: a 4 × 4 assessment – A sectoral and regional analysis for 2030s. MoEF, GoI, 2010.
- Dash, S. K., Jenamani, R. K., Kalsi, S. R. and Panda S. K.Some evidence of climate change in twentieth-century India.Climatic Change. 85:299-321.
- Dash, S. K., Nair, A. A., Kulkarni, M. A. and Mohanty, U. C. 2011.Characteristic changes in the long and short spells of different rain intensities in India. Theor. Appl. Climatol. 105:563–570.
- Drost, F., Karoly, D. and Braganza, K. 2012.Communicating global climate change using simple indices: an update.Clim. Dynam.39:989-999.
- Forest, C. E., Stone, P. H., Sokolov, A. P., Allen, M. R. and Webster, M. D. 2002. Quantifying Uncertainties in Climate System Properties with the use of recent climate observations.Science. 295 (5552):113-117.
- Foster, S.S.D. 1990. Impact of urbanisation on groundwater. In Massing, H., et al., eds., Hydrological processes and water management in urban areas: Wallingford, UK, IAHS Publn. 198:187–207.
- Francis, P. A. and Gadgil, S. 2006. Intense rainfall events over the west coast of India. Meteorol. Atmos. Phys. 94: 27–42.
- Gedney, N., Cox, P. M., Betts, R.A., Boucher, O., Huntingford, C. and Stott, P. A. 2006.Nature.439:835–838.
- George, G. Charlotte, B.V. and Ruchith, R.D. 2011.Interannual variation of northeast monsoon rainfall over southern peninsular India.Indian J. GeoMar. Sci. 40(1):98–104.
- Ghosh, S., Luniya, V. and Gupta, A. 2009.Trend analysis of Indian summer monsoon rainfall at different spatial scales.Atmos. Sci. Let. 10: 285–290.
- Goswami, B. N., Venugopal, V., Sengupta, D., Madhusoodanan, M. S., Xavier, P. K. 2006. Increasing Trend of Extreme Rain Events over India in a Warming Environment.Science.314: 1442- 1445.
- Guhathakurta, P. and Rajeevan, M. 2008. Trends in the rainfall pattern over India.Int. J. Climatol. 28: 1453–1469.
- Hansen, J. E., Sato, M., Lacis, A., Ruedy, R., Tegen, I. and Matthews, E. 1998.Climate forcings in the industrial era.Proc. Natl. Acad. Sci. USA. 95: 12,753–12,758.
- Hansen, J., Sato, M., Ruedy, R., Lo, K., Lea, D. W. and Medina- Elizade, M. 2006.Global temperature change.Proc. Natl. Acad. Sci. USA. 103 (39):14288-14293.
- Houghton J et al (eds) .2001. Climate change 2001: the scientific basis. Cambridge University Press, Cambridge, UK.
- IPCC, 2013: Climate Change 2013: The Physical Science Basis. Contribution of Working Group I to the Fifth Assessment Report of the Intergovernmental Panel on Climate Change [Stocker, T.F., D. Qin, G.K. Plattner, M. Tignor, S.K. Allen, J. Boschung, A. Nauels, Y. Xia, V. Bex and P.M. Midgley (Eds.)]. Cambridge University Press, Cambridge, United Kingdom and New York, NY, USA, 1535 pp.
- Jain, S.K., Goswami, A. and Saraf, A.K. 2010.Assessment of Snowmelt Runoff Using Remote Sensing and Effect of Climate Change on Runoff.Water Resour. Manage. 24:1763–1777.
- Jiang, T., Yongqin, D.C., Chong-yu, X., Xiaohong, C., Xi, C. and Singh, V.P. 2007.Comparison of hydrological impacts of climate change simulated by six hydrological models in the Dingjiang Basin, South China.J. Hydrol. 336:316–333.
- Kanellopoulou, E. A. 2002. Spatial distribution of rainfall seasonality in Greece. Weather. 57:215–219.
- Kothawale, D. R. and Rupa Kumar, K. 2005. On the recent changes in surface temperature trends over India.Geophys. Res. Lett. 32: L18714.
- Kothawale, D. R., Krishna Kumar, K. and Srinivasan, G. 2012. Spatial asymmetry of temperature trends over India and possible role of aerosols.Theor. Appl. Climatol. 110:263–280.
- Kripalani, R.H. and Kumar, P. 2004. Northeast monsoon rainfall variability over south peninsular India vis-á-vis the Indian Ocean dipole mode.Int. J. Climatol. 24:1267–1282.
- Krishnakumar, K. N., Rao, G. S. L. H. V. P. and Gopakumar, C. S. 2009.Rainfall trends in twentieth century over Kerala, India. Atmos. Environ. 43: 1940-1944.
- Kulkarni, A. 2012.Weakening of the Indian monsoon rainfall in warming environment.Theor. Appl. Climatol. 109: 447-459.
- Kumar, R., Kumar, K. and Pant, G.B. 1994. Diurnal asymmetry of surface temperature trends over India. Geophys. Res. Lett. 21:677–680.
- Kumar, R.K., Sahai, A.K., Kumar, K.K., Patwardhan, P.K., Mishra, P.K., Revadekar, J.V., Kamala, K. and Pant, G.B. 2006. High-resolution climate change scenarios for India for the 21st century.Curr. Sci.90(3):334-345.
- Kumar, V., Jain, S. K. and Singh, Y. 2010. Analysis of long- term rainfall trends in India, Hydrolog. Sci. J., 55(4): 484-496.
- Labat, D., Godderis, Y., Probst, J. L. and Guyot, J. L. 2004. Evidence for global runoff increase related to climate warming. Adv. Water Resour. 27:631-642.
- Maathews, H. D., Weaver, J., Meissner, K. J., Gillett, N. P and Eby, M. 2004. Natural and anthropogenic climate change: incorporating historical land cover change, vegetation dynamics and the global carbon cycle. Clim. Dynam. 22:461-479.
- Mehrotra. R. 1999. Sensitivity of runoff, soil moisture and reservoir design to climate change in central Indian river basins. Clim. Chang. 42: 725-757.
- Menne, M.J., I. Durre, R.S. Vose, B.E. Gleason, and T.G. Houston.2012.An overview of the Global Historical Climatology Network-Daily Database.J. Atmos.Ocean. Technology. 29: 897-910, doi:10.1175/JTECH-D-11-00103.1.
- Mir, R.A., Jain, S.K. and Saraf, A.K. 2015.Analysis of current trends in climatic parameters and its effect on discharge of Satluj River basin, western Himalaya.Nat. Hazards. 79:587-619.
- Misra, A.K. 2011.Impact of Urbanisation on the Hydrology of Ganga Basin (India).Water Resour. Manage.25: 705-719.
- Mittal, N., Bhave, A.G., Mishra, A. and Singh, R. 2015.Impact of Human Intervention and Climate Change on Natural Flow Regime. Water Resour. Manage. DOI 10.1007/s11269-015-1185-6.
- Mondal, A., Khare, D. and Kundu, S. 2014.Spatial and temporal analysis of rainfall and temperature trend of India.Theor. Appl. Climatol. 122(1): 143-158.
- Nair, A., Joseph, K. A. and Nair, K. S. 2014.Spatio -temporal analysis of rainfall trends over a maritime state (Kerala) of India during the last 100 years. Atmos. Environ. 88:123-132.
- Nayagam, L. R., Janardanan, R. and Ram Mohan, H. S. 2009.Variability and tele connectivity of northeast monsoon rainfall over India.Glob.Planet Chang. 69(4):225–231.
- Nune, R., George, B.A., Teluguntla, P. and Western, A.W. 2014. Relating Trends in Streamflow to Anthropogenic Influences: A Case Study ofHimayatSagar Catchment, India.Water.Resour. Manage. 28:1579-1595.
- Oki T, Kanae S (2006) Global hydrological cycles and world water resources. Science 313(5790):1068–1072.
- Pal, I. and Al Tabbaa, A. 2009.Trends in seasonal precipitation extremes – An indicator of ‘climate change’ in Kerala, India.J. Hydrol. 367 :62–69.
- Pal, I. and Al- Tabbaa, A. 2011.Assessing seasonal precipitation trends in India using parametric and non-parametric statistical techniques.Theor. Appl. Climatol. 103:1–11.
- Palmate, S.S., Pandey, A., Kumar, D., Pandey, R.P and Mishra, S.K. 2014.Climate change impact on forest cover and vegetation in Betwa Basin, India.Appl. Water Sci.DOI 10.1007/s13201-014-0222-6.
- Parthasarathy, B. and Dhar, O. N. 1974.Secular variations of regional rainfall over India.Quart. J. Roy. Meteor Soc.100: 245-257.
- Piao, S., Friedlingstein, P., Ciais, P., Ducoudre, N., N. Labat, D. and Zaehle, S. 2007. Proc. Natl. Acad. Sci. USA. 104: 15242–15247.
- Prakash, S., Mahesh, C., Sathiyamoorthy, V. and Gairola, R. M. 2013.Increasing trend of northeast monsoon rainfall over the equatorial Indian Ocean and peninsular India.Theor. Appl. Climatol. 112:185–191.
- Punia, M., Nain, S., Kumar, A., Singh, B. P., Prakash, A., Krishnan Kumar and Jain, V. K. 2015.Analysis of temperature variability over north-west part of India for the period 1970–2000.Nat Hazards. 75:935–952.
- Rajeevan, M., Bhate, J. and Jaswal, A. K. 2008. Analysis of variability and trends of extreme rainfall events over India using 104 years of gridded daily rainfall data.Geophys. Res. Lett. 35: L18707, doi: 10.1029/2008GL035143.
- Rakhecha, P. R. and Soman, M. K. 2004.Trends in the annual extreme rainfall events of 1 to 3 days duration over India.Theor. Appl. Climatol. 48: 227-237.
- Ramachandra, T.V., Vinay, S. and Bharath, H. A. 2015. Environmental Flow Assessment in Yettinahole: Where is 24 TMC to divert?.Sahyadri Conservation Series 48, ENVIS Technical Report 91, EWRG, CES, IISc, Bangalore.
- Rangan, H., Kull, C.A. and Alexander, L. 2010. Forest plantations, water availability, and regional climate change: controversies surrounding Acacia mearnsii plantations in the upper Palnis Hills, southern India. Reg. Environ. Change. 10: 103-117.
- Rathore, C.S., Attri, S.D. and Jaswal, A.K. 2013. State level climate change trends in India. Meteorological Monograph ESSO/IMD/EMRC/02/2013.India Meteorological Department. 147p
- Ratna, S. B., Cherchi, A., Joseph, P. V., Behera, S. K., Abish, B. and Masina, S. 2015. Clim. Dynam. DOI.10.1007/s00382-015-2624-z.
- Revadekar, J.V., Kothawale, D.R., Patwardhan, S. K., Pant, G. B. and Rupa Kumar, K. 2012. About the observed and future changes in temperature extremes over India.Nat Hazards. 60:1133–1155.
- Richardson K, SteffenW, Liverman D (2011) Climate change: global risks, challenges and decisions. CambridgeUniversity Press, Cambridge.
- Roy, S. S. and Balling, R. C. 2005.Analysis of trends in maximum and minimum temperature, diurnal temperature range, and cloud cover over India.Geophys. Res. Lett. 32: L12702. Doi: 10.1029/2004GL022201.
- Ruddiman, W. F. 2003. Orbital insolation, ice volume, and greenhouse gases. Quat.Sci. Rev. 22:1597–1629.
- Sheffield, J., G. Goteti, and E. F. Wood, 2006: Development of a 50-yr high-resolution global dataset ofmeteorological forcings for land surface modeling, J. Climate, 19 (13), 3088-3111.
- Singh, N. Sontakke, N. A. 1999.On the variability and prediction of rainfall in the post-monsoon season over India.Int. J. Climatol. 19:309–339.
- Sreekala, P. P., Rao, S.V.B. and Rajeevan, M. 2012. Northeast monsoon rainfall variability over south peninsular India and its teleconnections.Theor. Appl. Climatol. 108(1–2):73–83.
- Srivastava, H. N., Dewan, B. N., Dikshit, S. K., Rao, P. G. S., Singh, S.S. and Rao, K.R. 1992. Decadal trends in climate over India. Mausam.43: 7–20.
- Thapliyal V, Kulshrestha SM .1991.Decadal changes and trends over India.Mausam42:333–338.
- The International Panel for Climate Change (IPCC).2001. Climate Change 2001: The Scientific Basis. Houghton, J.T. et al.(eds.). Cambridge Univ. Press, Cambridge, UK.
- UNDP (2007) Human development report 2007/2008. United Nations Development Program (UNDP), United Nations Plaza, New York.
- Uniyal, B., Jha, M. K. and Verma, A.K. 2015.Assessing Climate Change Impact on Water Balance Components of a River Basin Using SWAT Model.Water Resour. Manage. 29:4767–4785.
- Vinnikov, K., Graisman, P.Y. and Lugina, K.M. 1990. Empirical data on contemporary global climatic changes (Temperature and precipitation).J Climate. 3:662–677.
- Vorosmarty CJ, Green P, Salisbury J, Lammers RB (2000) Global water resources: Vulnerability from climate change and population growth. Science 289(5477):284–288.
- Walsh, R. P. D. and Lawer, D. M. 1981. Rainfall seasonality: Description, spatial patterns and change through time. Weather. 36: 201–208.
- Wang, W., Shao, Q., Yang, T., Peng, S., Yu, Z., Taylor, J., Xing, W., Zhao, C. and Sun, F. 2013.Changes in daily temperature and precipitation extremes in the Yellow River Basin, China.Stoch. Environ. Res. Risk Assess. 27:401-421.
Khare, D., Patra, D., Mondal, A. and Kundu, S. 2015. Impact of landuse/land cover change on run-off in a catchment of Narmada river in India. Appl. Geomat. 7: 23-35.
APPENDIX
Appendix.1. Seasonality Index
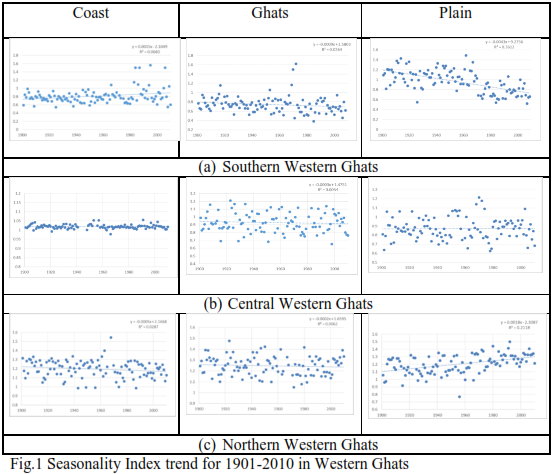
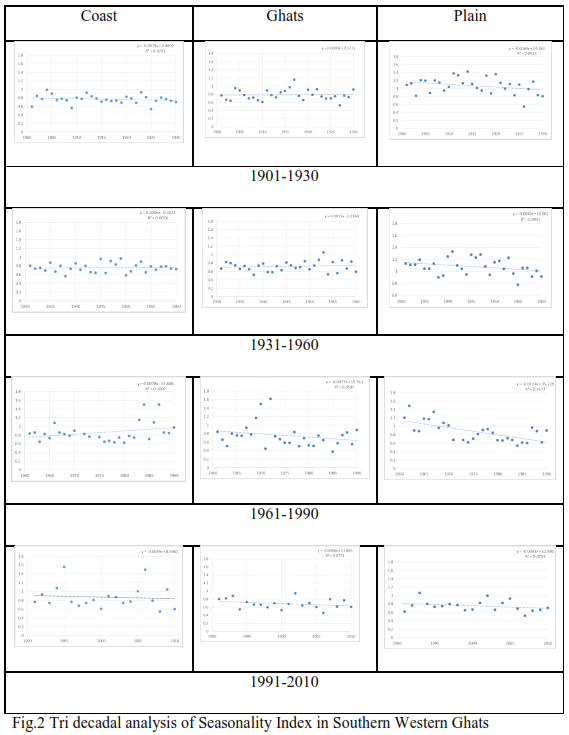
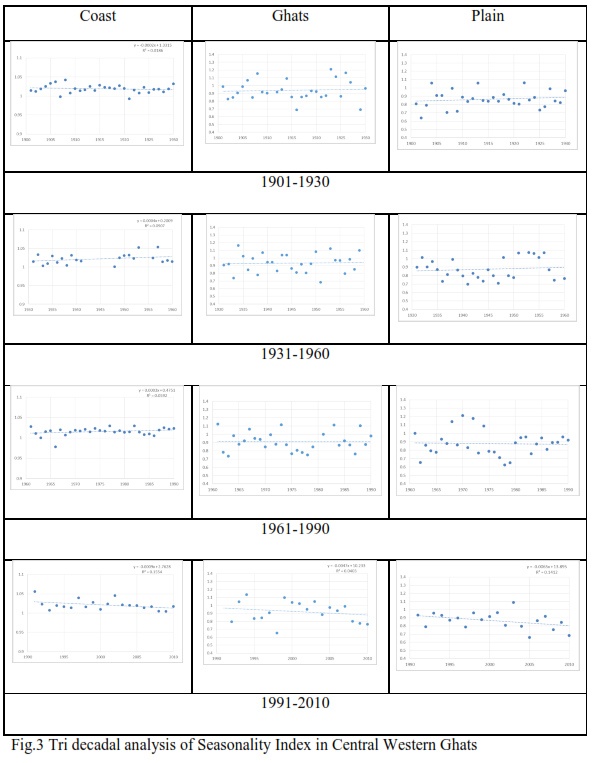
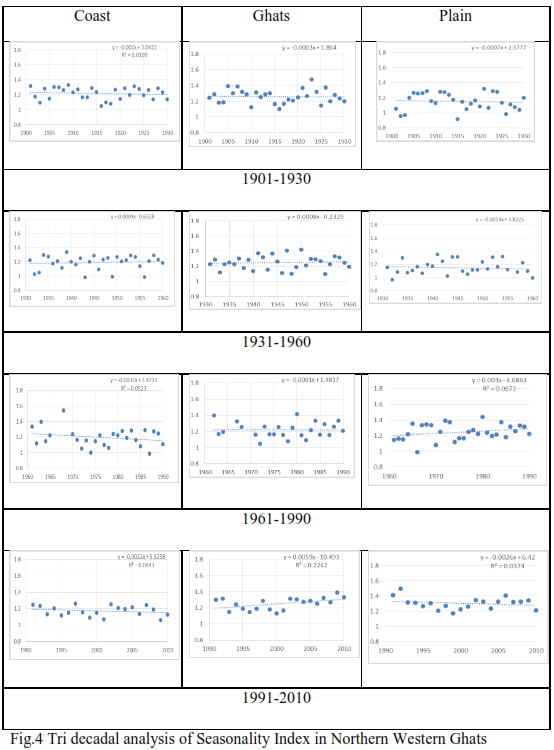
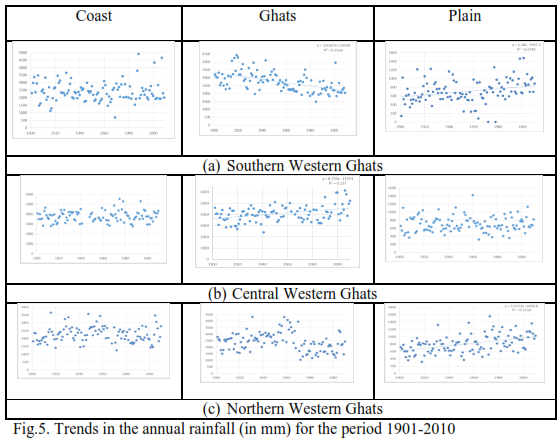
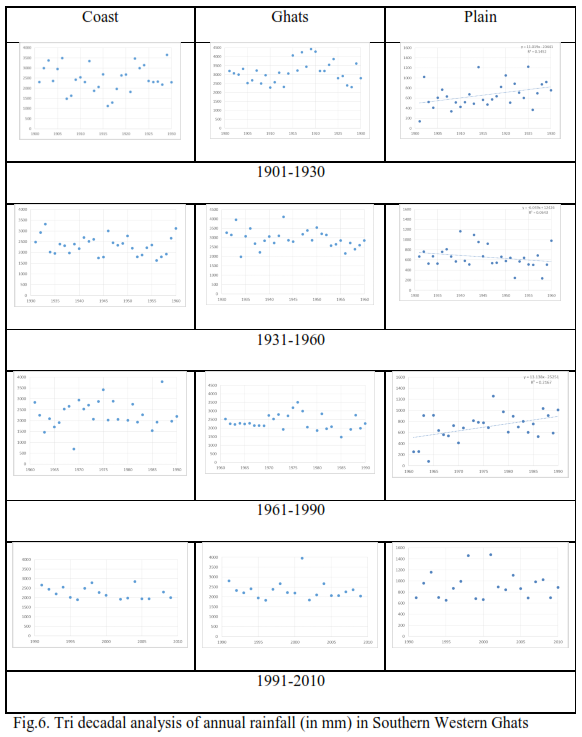
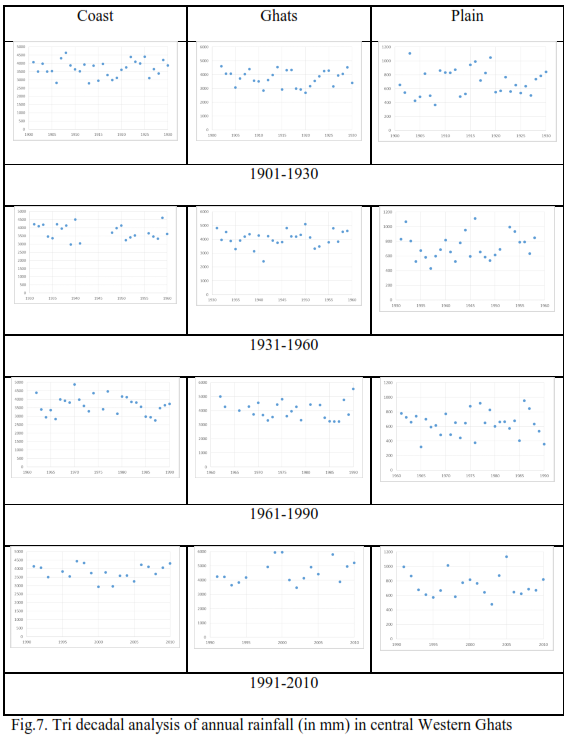
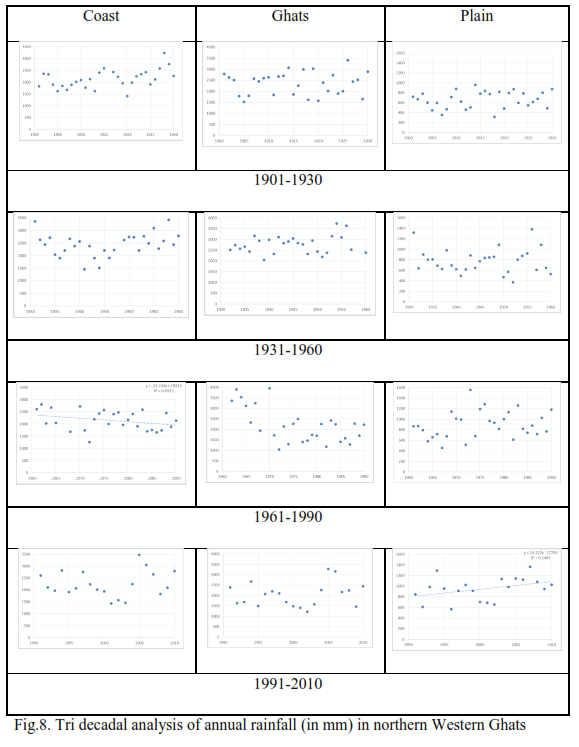
Appendix.3. Trends in Monthly Rainfall from May to December
Appendix.3.1. Monthly rainfall across Southern Western Ghats
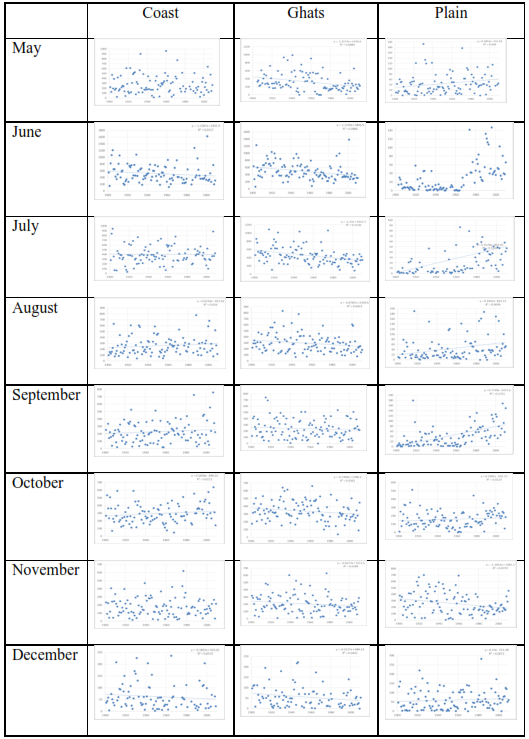
Fig.9. Trend analysis of monthly rainfall (in mm) in southern Western Ghats from 1901-2010
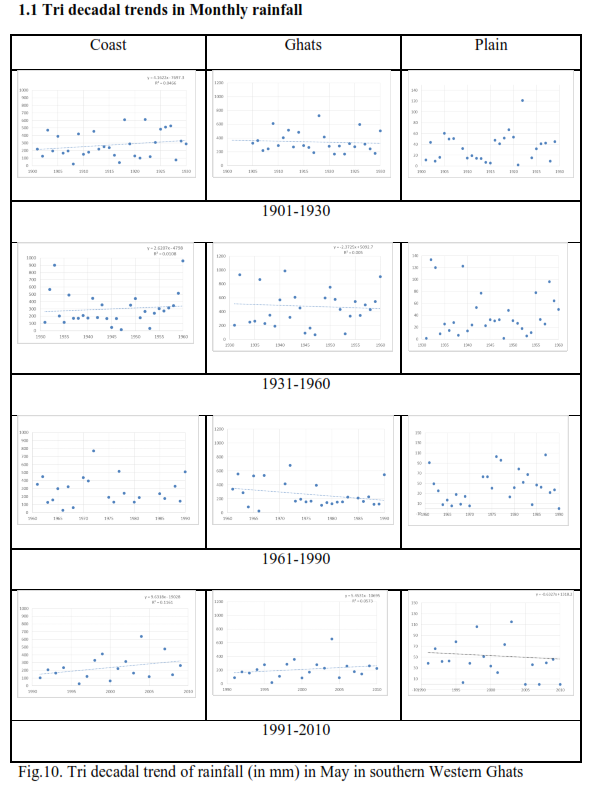
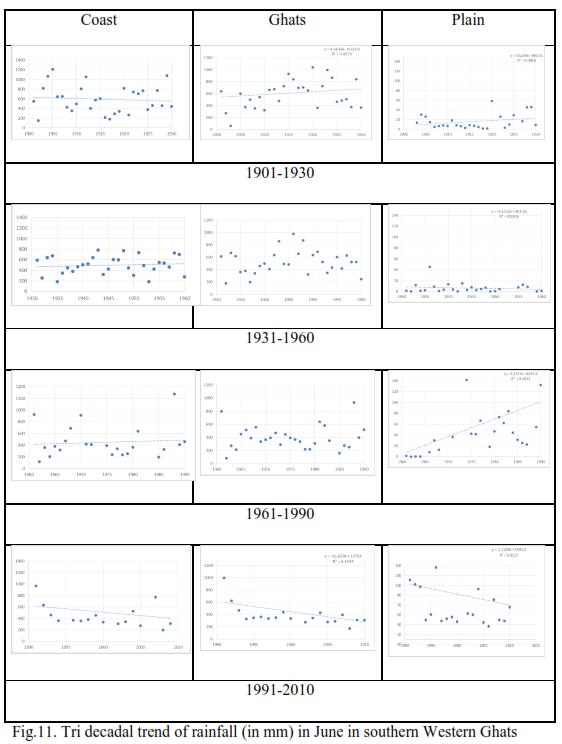
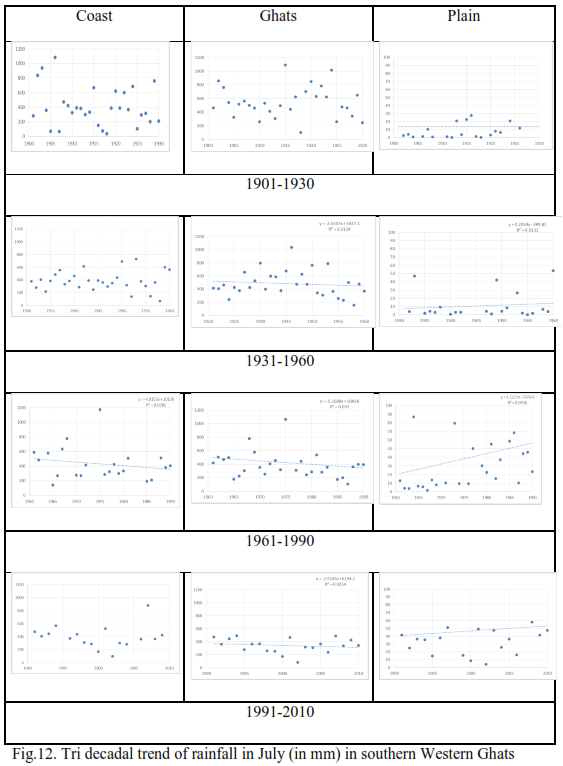
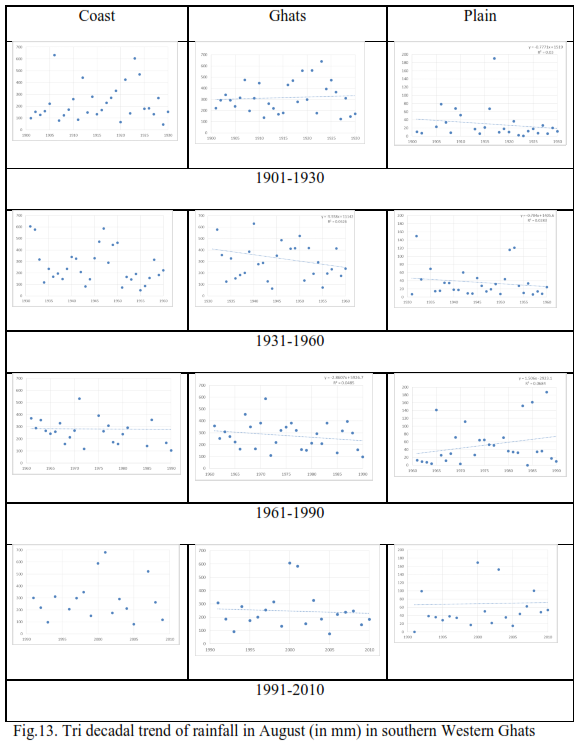
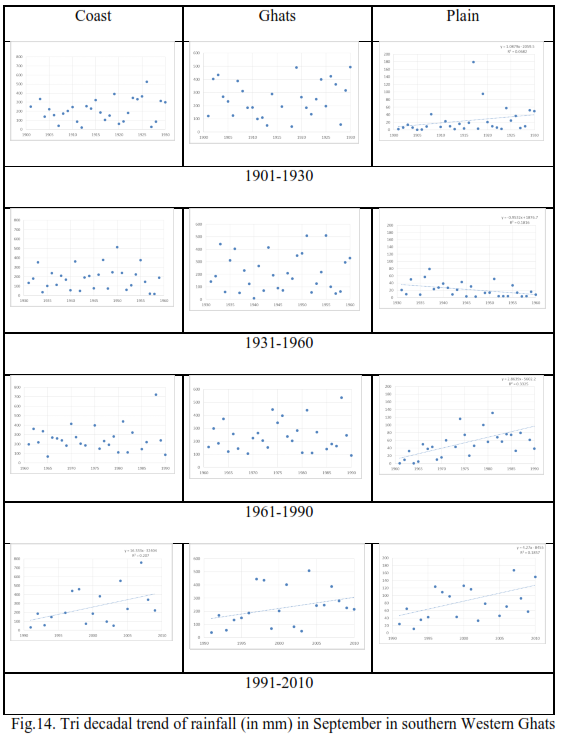
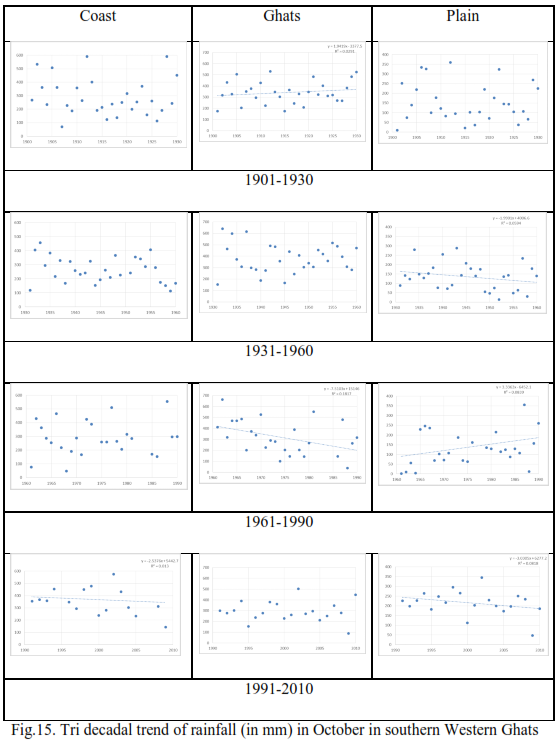
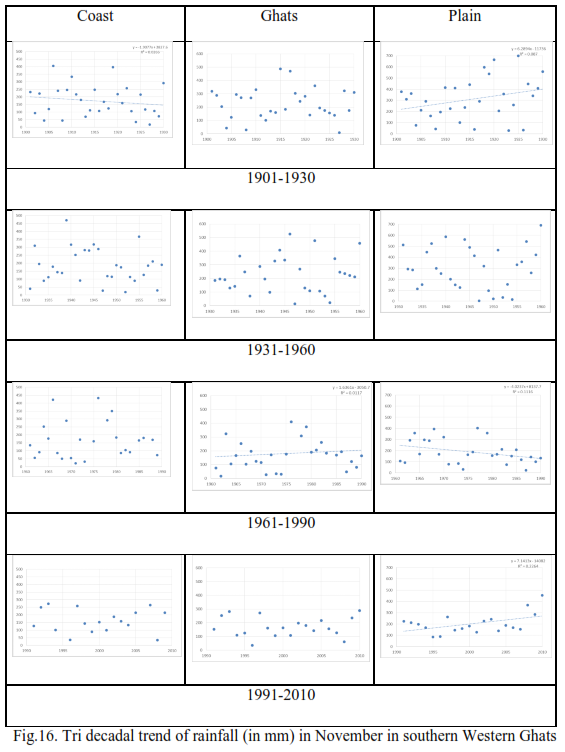
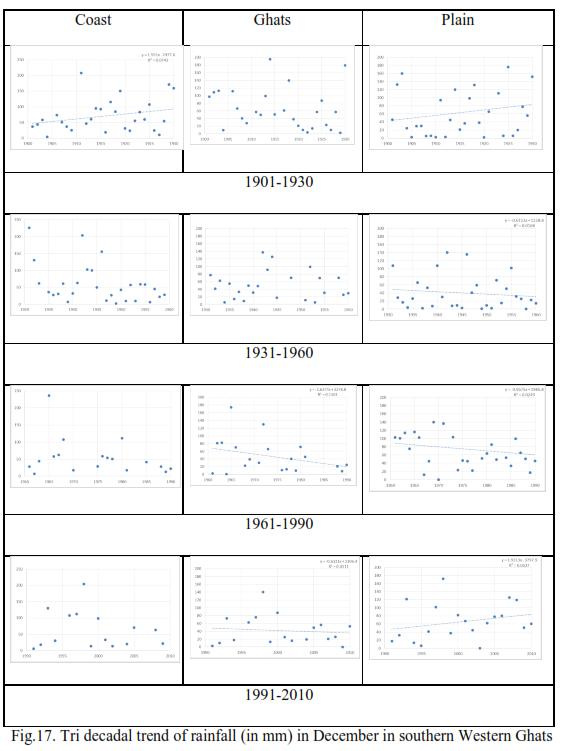
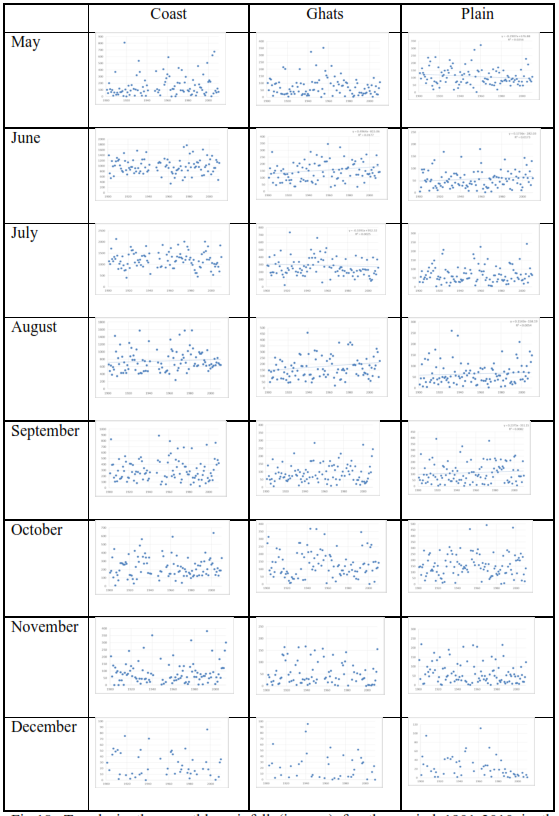
Fig.18. Trends in the monthly rainfall (in mm) for the period 1901-2010 in the central Western Ghats
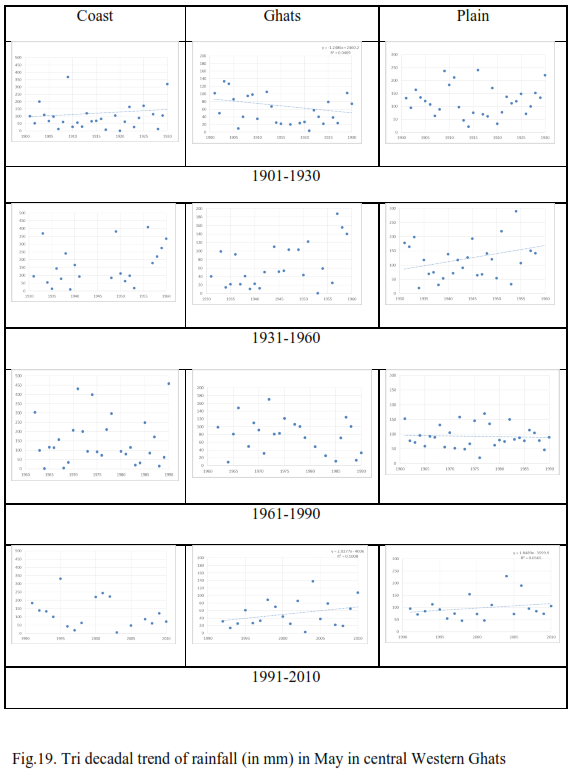
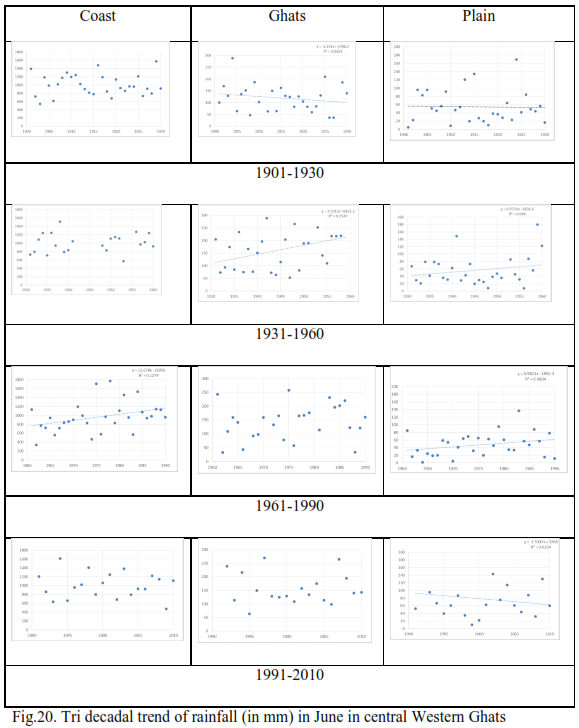
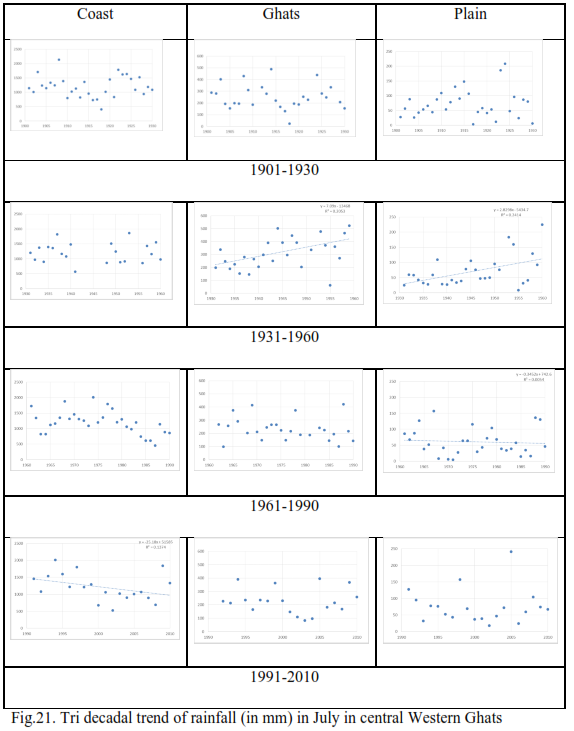
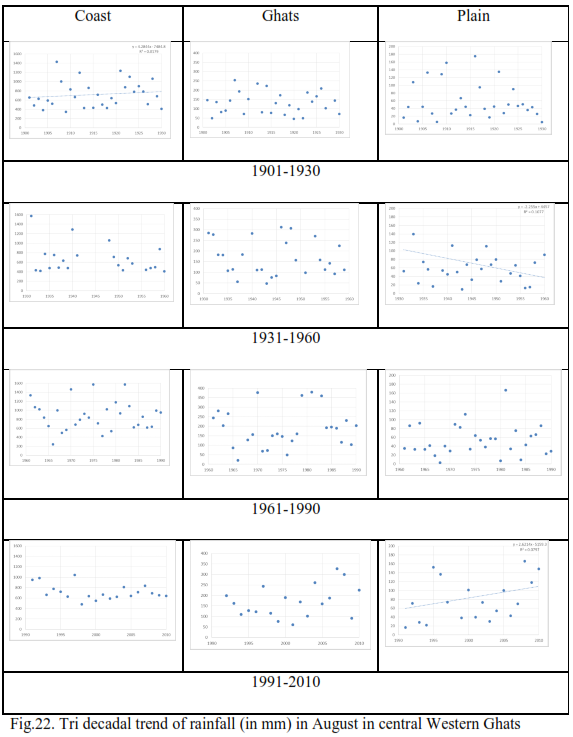
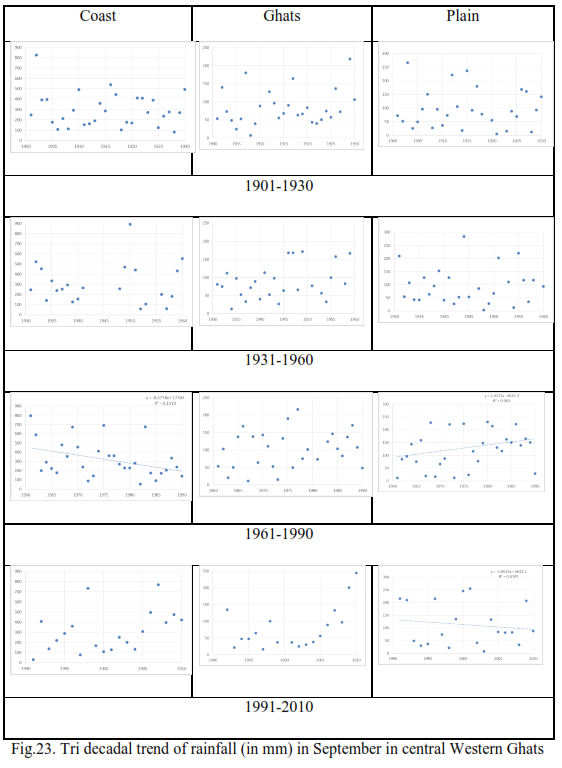
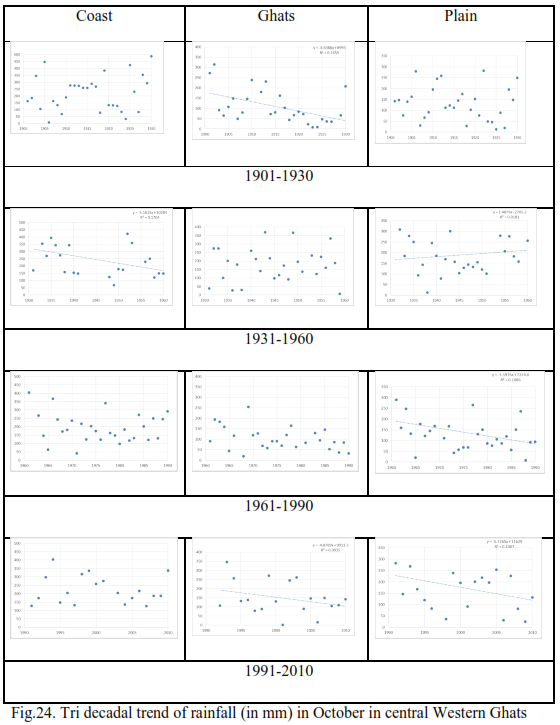
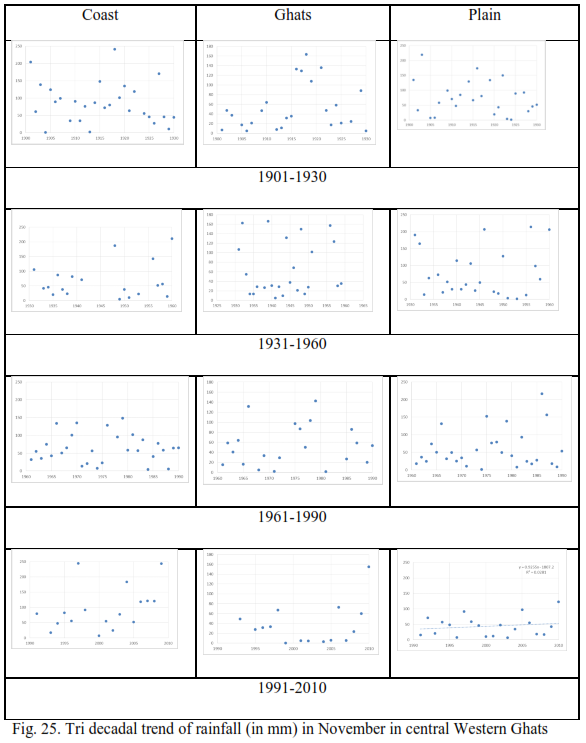
Fig.26. Trends in the monthly rainfall (in mm) for the period 1901-2010 in the Northern Western Ghats
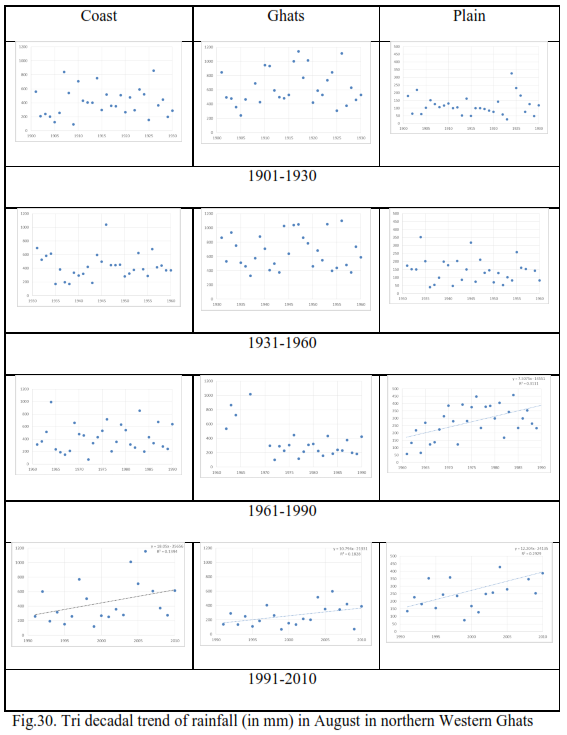
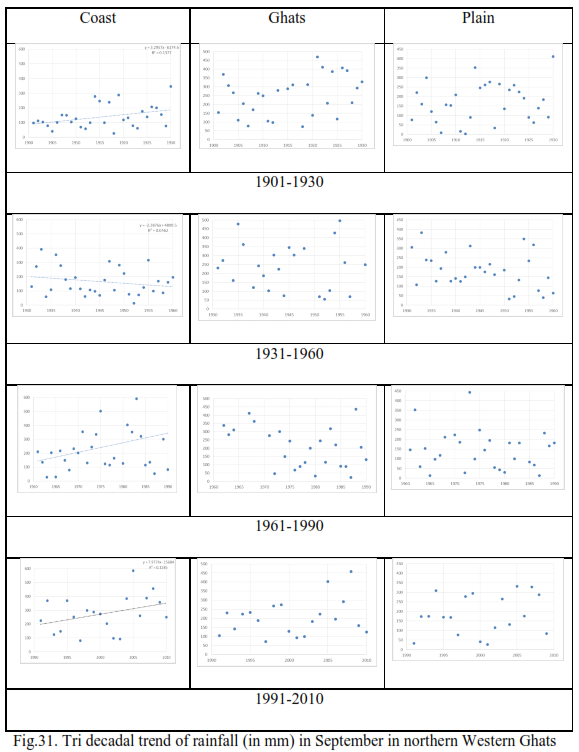
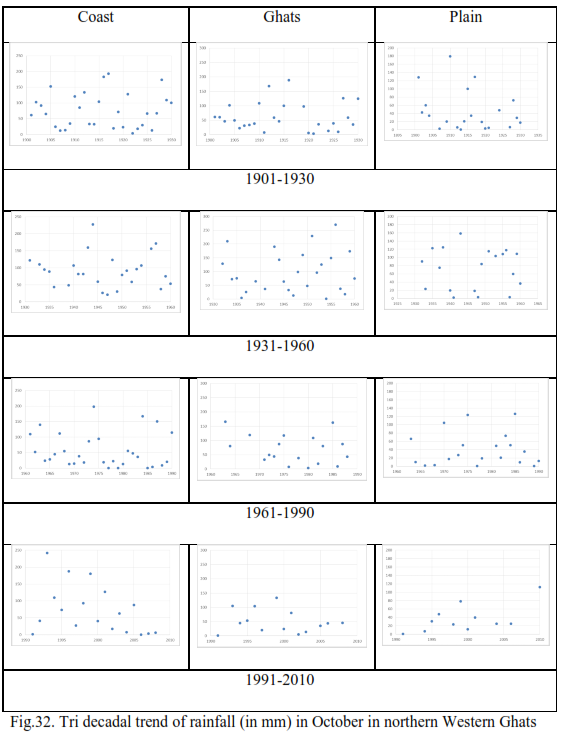
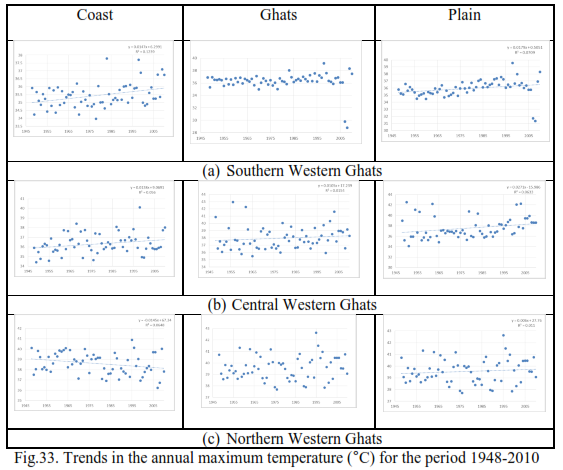
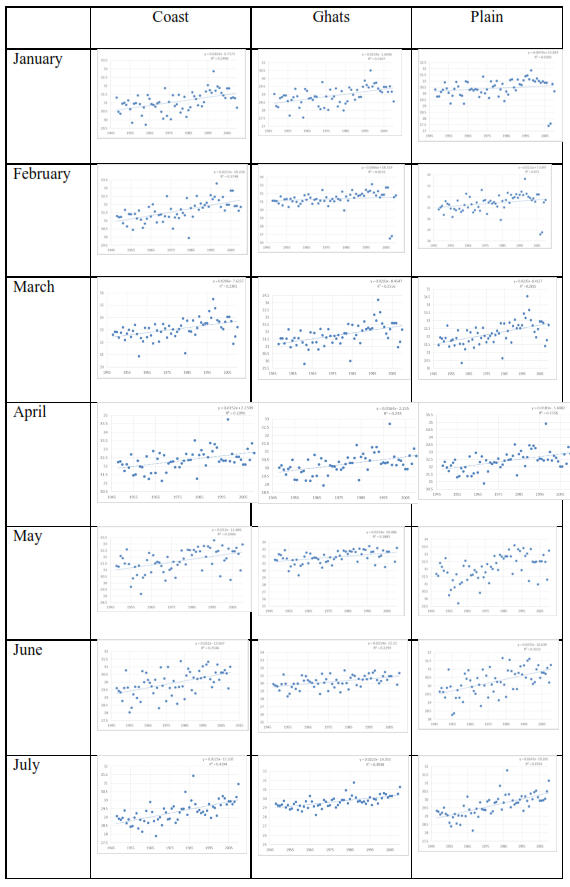
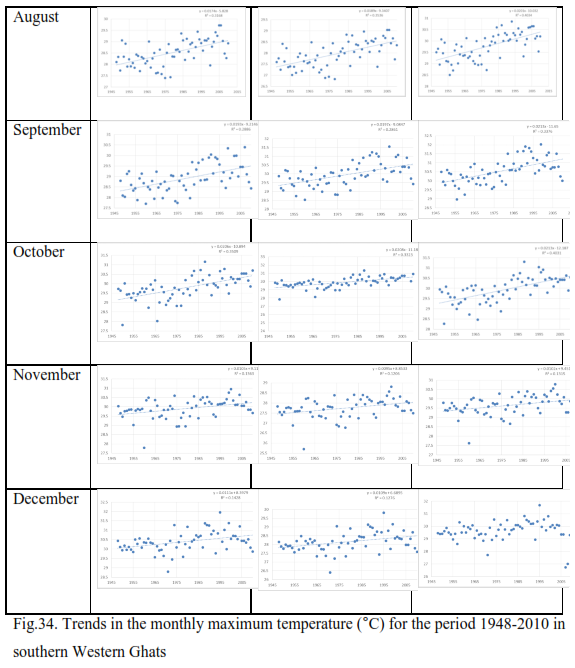
Fig.35. Trends in the monthly maximum temperature (°C) for the period 1948-2010 in central Western Ghats
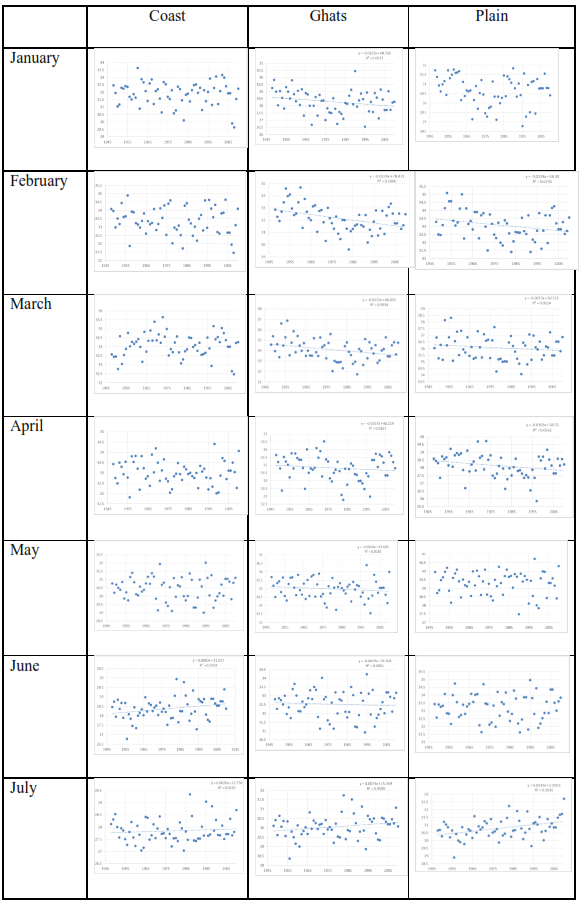
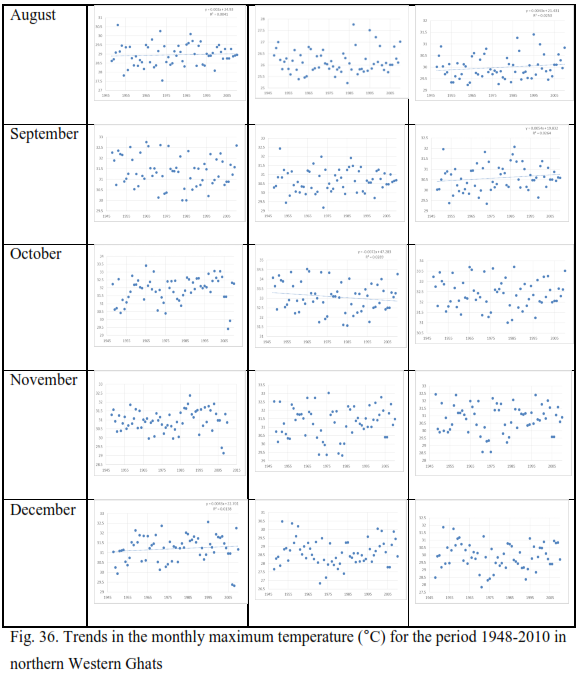
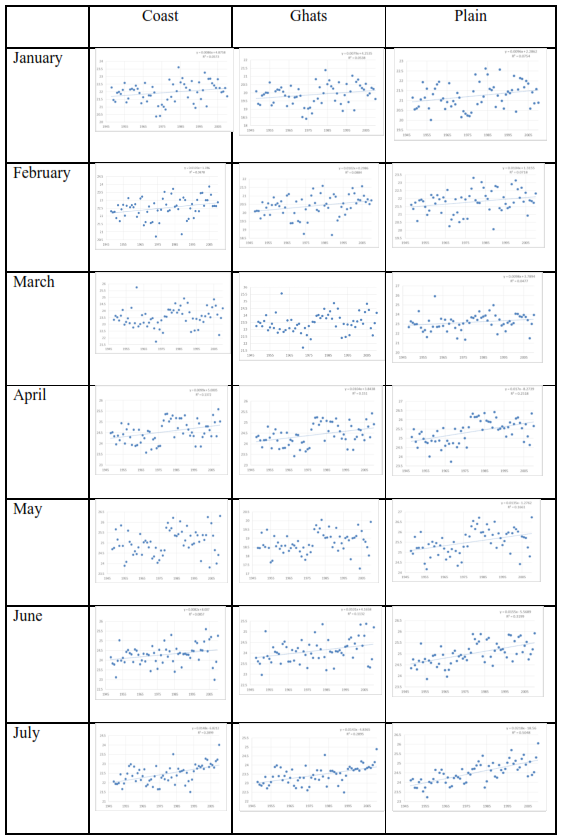
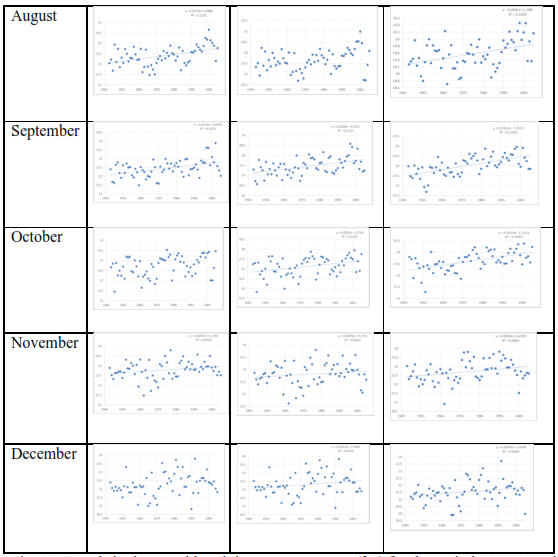
Fig. 38. Trends in the monthly minimum temperature (°C) for the period 1948-2010 in southern Western Ghats
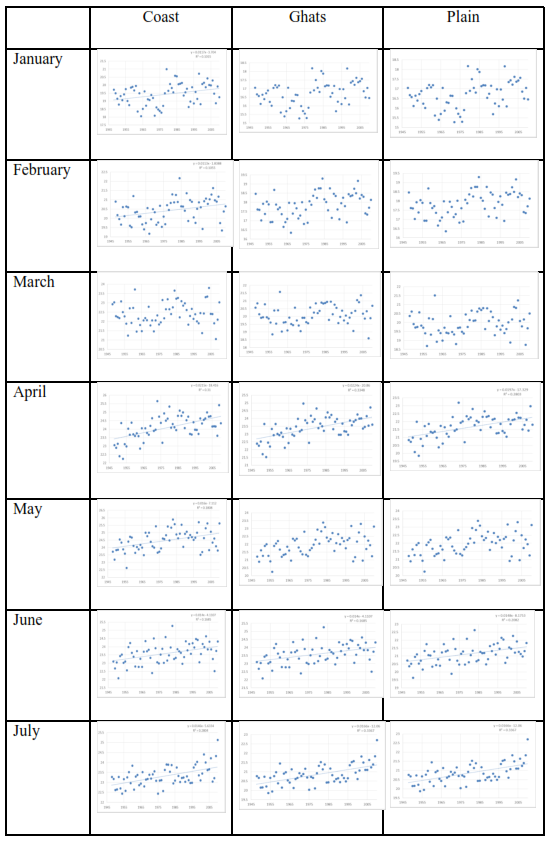
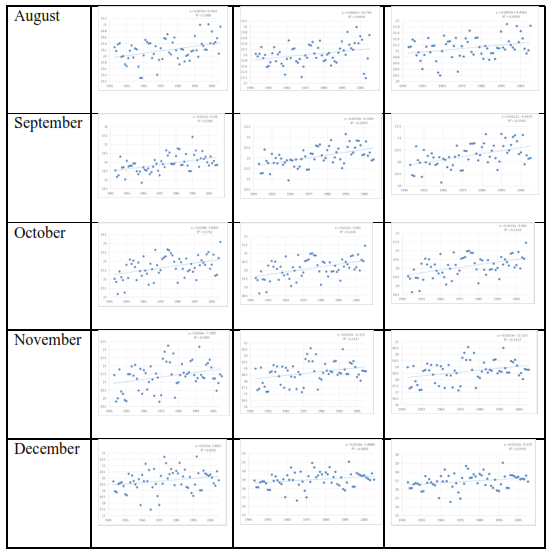
Fig. 39. Trends in the monthly minimum temperature (°C) for the period 1948-2010 in central Western Ghats