| GISdevelopment.net --> Application --> Environment |
Marie-Claire Guero
freninst@ind2.vsnl.net.in
Head Geomatics Laboratory, French Institute of Pondicherry,
11 St. Louis Street, Post Box 33, Pondicherry
B.R. Ramesh
ifpbota@satyam.net.in
Head Botanical Laboratory, French Institute of Pondicherry,
11 St. Louis Street, Post Box 33, Pondicherry
The State of West Bengal has a total geographical area of 88,750 Sq. Km. i.e. 13.4% of its land area is under recorded forest. Out of this recorded forest area, nearly 34% of the forest has been brought under Protected Area network which includes National Parks and Sanctuaries. West Bengal has one of the highest population densities in the country and there is tremendous pressure on forest land. During the Sixties and Seventies of twentieth century, because of a series of development activities and population explosion, there had been large-scale degradation of natural forest. However, from the early Eighties, with the adoption of the technique of Joint Forest Management, the process of degradation could not only be stopped but also reversed. Peoples’ participation in management of forest and sharing of usufruct from the resuscitated forest was the key to success of Joint Forest Management. Since the natural eco-system has been undergoing rapid changes in the recent times, the conventional methodology of forest vegetation monitoring through the long-term process of preparation of forest stock maps through manual survey has become almost obsolete. For better management of this dynamic eco-system, a more realistic method has been felt necessary. The modern technology of GIS and vegetation mapping through Satellite Imagery provides an opportunity for such real-time monitoring of the eco-system. Rapid appraisal of the forest inventory will help identification of the correct strategy to achieve the desired goal of conservation of forests and bio-diversity.
Background
Most of the territorial forest Divisions in the State have Working Plans prepared for a period of 10 years or so, within the framework of which detailed activities of the Divisions are drawn up. These Working Plans are to be approved by Government of India, as per the direction of the Supreme Court of India. No forest can be worked without an approved Working Plan. Each Working Plan has normally 3 volumes. Volume-I contains background information of the Forest Division including history of its management in the past, information on the quality and growth of the forest vegetation, geographical description of the forest land and organisational pattern. Volume-II of the Working Plan includes the objectives and strategies of management and is the real operative part of the Working Plan. Volume-III contains the stock maps which indicate details of the forest stock/inventory, mouza-wise, and also is the reference map for forest land boundary demarcation.The two most important components of the Working Plan are
- Description of forest boundary (Forest Map)
- Description of forest vegetation (Forest inventory)
Forest Inventory ( Stock Maps )
In any resource management, continuous flow and updation of information about the inventory is one of the most important components of management functions. In the present-day scenario, forest vegetation, which is a natural and renewable resource, is no more a static resource. Ever-increasing population in a land-scarce situation is putting the natural forests and the eco-system under increased pressure and threats, and needs to be dynamically managed for its sustainability and development.
Forest stock maps constitute the basis of Working Plan for the territorial Forest Divisions. They contain detailed spatial information on extent of recorded forest lands including the administrative jurisdiction at various levels, infrastructure and communications facilities, water resources and the status of forest vegetation. The last component include categorisation of forest into density classes, species distribution, assessment of growing stock, growth data for various species and age distribution. All these information are extremely vital in presenting the management options like afforestation of blank areas, reforestation of degraded forests, harvesting of mature crop (plantation) followed by regeneration, restoration of bio-diversity in monoculture areas, and management of Protected Areas for Bio-Diversity Conservation.
The conventional method of enumeration of the forest inventory by a handful of Working Plan staff is very uncertain, highly time consuming and somewhat unrealistic. By the time enumeration of the forest stock of one Division is completed and the Working Plan is prepared for the next 10 years or so, there may be a sea-change of reality on the ground and the forest Working Plan may have become non-implementable. The conventional method of preparation of stock maps cannot generate real-time information on forest inventories and is thus not at all useful for realistic planning.
Moreover, the forest stock maps are not geo-referenced and hence is not much useful even after digitisation of the individual mouza/block under computer-based GIS and hence are not fit for analysis under GIS.

Working Plan - A Detailed Structural Design
| Components of Planning | [ Fixation of
objectives [ Fixation of Goals [ Deciding on strategies |
Objects and contents of Working Plan :~
-
- Assess the present status of Forest land and Flora/Faunal Resources.
- Evaluate the past practices of management.
- Fix the overall goals and strategies
- Prescribe a control mechanism and control the deviations from the goals.
Vol. I of W.P. - Contains general description of the resources and past management. Vol. II. of W.P. - Fixes the objectives of management, earmarks one working circle (zonation) for attaining each objective, prescribes strategies for each W.C. in the form of yield, treatment method etc. and prescribes the control forms. Vol. III of W.P. - Contains information on the forest inventory, i.e. growing stock, species composition, density classification, spatial description of forest land (surveyed maps) etc. the Stock Maps.
Assessment of Forest Inventory [Survey of Forest land to detect changes [Enumeration of growing stock to assess flora resources
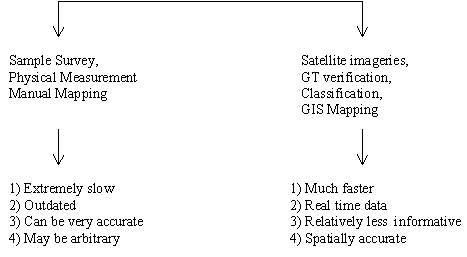
Comparative statement of conventional method and New Technology

Project objectives
The primary objectives of the present study are
- Develop methodologies for creation of forest administrative maps in GIS environment.
- Develop methodologies for rapid monitoring of forest vegetation at Mouza/Compartment level, including generation of classified forest stock maps on real time basis.
- Developing in-house capabilities for use of computer-based GIS and Satellite Imageries in preparation of updated Working Plans of various Forest Divisions.
- Use of GIS tools for evaluating the success of Joint Forest Management in South West Bengal.
- Monitoring the bio-diversity status of the National Parks and Sanctuaries of the State.
- Generating database to substantiate the principles of forestry operation in South West Bengal and North Bengal.
One GIS Cell has been made operative in the office of the Conservator of Forests, Working Plan and GIS from the July, 1999 onwards. The complete GIS solution package of Arc/Info and Satellite Imagery data processing software ERDAS have been installed on Windows NT Platform.
ARC/INFO GIS Software on Windows NT and ERDAS image processing software, professional version on Windows NT were used for the project.
Though the basic forest stock maps are prepared at the Mouza level (1:3960) in South West Bengal, or forest Block/Compartment level (1:15840) in North Bengal, these maps are not geo-referenced. In order to geo-reference, these maps, the following strategy was adopted
- The Police Station (PS)/ Block maps, in 1:63,360 scale, were
procured from BLLRO/DLLRO. These maps have latitude/ longitudes
reference and contain the Mouza boundaries, as well as information on
road/rail network and rivers. These maps were digitised and the three
coverages containing Block / Mouza boundaries, road/rail and rivers were
created under geographic projections.
- These coverage were then projected into real world co-ordinates. [
Projection Polyconic, with spheroid Modified Everest, and Central
Meridian / Projection Origin at 88° / 24° ].
- Topology was built for the coverage, containing Mouza boundary after
correcting the digitisation errors and information on each mouza was
attached to the database after adding the relevant items.
- IRS ID, LISS 3 Satellite imageries, pertaining to the period
December, 1998 was obtained from NRSA, Hyderabad on CD and a sub set for
the Area of Interest was created through ERDAS image processing
software.
- The satellite imagery was geometrically rectified with reference to
the geo-referenced, digitised Road / Rail coverage and River
coverage.
- Various options of image enhancement techniques were tried out to
get the best image for visual interpretation. A number of Ground Control
Point (GCPs) were chosen for Ground Truth Verification.
- Supervised classification, using maximum likelihood classifier
algorithm, was carried out with the help of collected Ground Truth
Information (GTI) for the Area of Interest. The final classified output
contained vegetation classification on the basis of species (Sal,
eucalyptus, cashew) and density (more than 40% = Dense, 40% to 10% =
open, less than 10% = Degraded), age (young Sal coppice and matured
Sal), agriculture, water bodies, habitations and wasteland.
- The classified raster image was converted into a grid theme using
image to grid utility and then the grid theme into a poly coverage
(vector file) using grid to poly utility in ArcInfo.
- The classified output vector coverage was overlayed on to digitised
PS/Block coverage containing Mouza boundaries. Each mouza, with
superposed classified vegetation output containing forest types, spp,
wasteland and habitations, was extracted and inter-mouza boundary
junction points were identified and 4 to 5 such control points were
created for this coverage.
- The individual mouza maps were scanned.
- The scanned image was geo-referenced with the existing PS/Block
coverage, using the known control points (mouza boundary
intersections).
- The individual mouza maps containing plot boundaries were digitised
with the registered scanned maps as back environment.
- Topology was built and relevant data for the mouza added.
- The individual mouza coverage was overlayed on the polygon coverage obtained from the classified image using the Intersect Command in ArcInfo and a new mouza map was created as the updated stock map.
Specific Need for New Technology
The total recorded Forest land in the 3 South West Bengal Districts of Midnapur, Bankura and Purulia is 4067 ha. The vegetation is predominantly sal (Shorea robusta) forests, which had been managed in the past few decades under coppice rotation. The rotation age followed was between 10 years and 15 years.
The Forest tract is lateritic with sub-soil canker pan. The forests are characterised by their fragmented nature, and the patches vary between a few hectares to a few hundred hectors. The disjointed forest patches are interspersed with heavily populated villages with sizeable Scheduled Caste / Schedule Tribe population. The people in the fringe villages are predominantly agriculturists with small / marginal farmers dominating the scenario.
From the decades of 1970, the forests of this region were subjected to uncontrolled destruction due to evergrowing population in the forest fringe areas with rising unemployment and poverty. Majority of the sal coppice forests had been reduced to either bushy sal forests or degraded sites. In the degraded / blank sites, Forest Department took up large scale afforestation programme with Eucalyptus as the most successful species. On the other hand, the sal bushes, whenever regenerated through coppicing & grown to pole-size, were again cut down by the fringe villagers who sold them in the market as firewood for their livelihood. The scenario continued till late 80s till the people started protecting small chunks of the forests, adjoining their villages under the practice of "Joint Forest Management (JFM)". Immediate incentive for peoples’ participation in protection of the forests was the sharing of usufructs from the resuscitated sal forests with the Forest Protection Committee (FPC) members. However, the practice of JFM was not equally effective everywhere and the quality/age of the forest became highly uneven, without any regularity. As on today, the forests in these Districts constitute sal coppices of all age classes varying from 1 yr. to 15 yrs., as well as degraded sites and forest blanks in addition to large areas of Eucalyptus plantation of varying age classes.
The Working Plan wing of the Forest Directorate had been entrusted with the job of revising the earlier Working Plan, and prescribe management of these sal coppice forests on sustainable basis. The objective is to develop these sal coppice forests through JFM and harvest the mature sal forests (around 15 years age) for further coppice regeneration.
However, the major difficulty in prescribing a strategy for their management was lack of real-time information on age / quality of the various patches of the sal forests which had been subjected to repeated illicit felling in the past. The conventional method would have been to carry out enumeration of these forests, using sample plots, and prepare detailed stock map of each and every forest Mouza. But the available infrastructure is the main drawback towards such effort. With a handful of field level staff under the Working Plan Division, it will perhaps take more than a decade to complete the enumeration and prepare the stock maps. And, by the time the last Stock Map is updated, the earlier ones would have become out-dated, unrealistic and unfit for future planning.
With these constraints in hand, the current endeavour to prepare and upgrade Stock Maps using the modern technology of remote sensing was introduced in June, 1999. The objective was to immediately identify all those sal coppice forests which were more than 10 yrs. old (mature) and which was to be managed under 15 to 20 years rotation cycle during plan period, through coppice regeneration. Those forests, having young sal coppices, will be set aside for protection at least over the next 10 years. The degraded / blank forest patches will be identified for large scale afforestation purpose.
Since as per December, 1996 Order of Hon’ble Supreme Court of India, no forest area can be worked without a Working Plan, duly approved by Government of India, availability of authentic and real-time data is all the more necessary for seeking Central Government’s approval. The current project has tried to overcome the field problems and achieve the targets, as mentioned earlier, using the computer based Geographical Information System. Application of this technology has enabled the undersigned to prepare updated stock maps of at least 350 Mouzas in a span of one month. Once the basic methodologies are decided, it will be possible to generate up-dated stock maps of more than a few hundred forest bearing Mouzas of the 3 Districts every year.
Results and Discussions
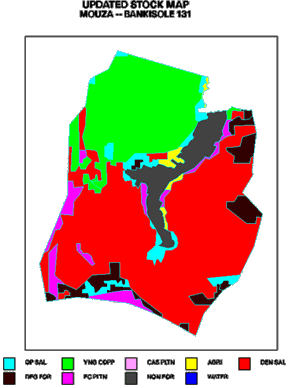
Mouza Bankisole, J.L.NO. 131, under Salboni PS in the Midnapur District of West Bengal was taken up for the case Study. The mouzas had predominantly sal as forest cover on the recorded forest land. The non-forest land comprised of habitations as well as waste land. However, the classified mouza map yielded the following statistics :
| Bankisole 131 | ||
| Recorded Forest land | = 679.59 | ha |
| Dense sal Forest | = 376.97 | ha. |
| Young Sal coppiece | = 182.16 | ha |
| Open Sal Forest | = 28.77 | ha |
| Plantations | = 34.78 | ha |
| Degraded Forests | = 50.34 | ha |
| Total Forest Cover On Forest Land |
= 622.68 | ha |
This indicates that some of the waste lands have been rehabilitated through afforestation, whilst small chunks of forest land have become degraded. This updated forest stock map is much more realistic, as compared to the old conventional stock map, with regard to management planning. However, the classified output is based on limited ground truth verification and can be further improved through more intense ground truth collections. Project Benefit
The direct benefit of the project will be in bringing about a total change in the concept of preparation of forest working plans, to make it more realistic and capable of coping with technological changes in the New Millennium. The other benefit will be achievement of in-house expertise on application of GIS and Remote Sensing Technology in the management and development of forest and Wildlife.
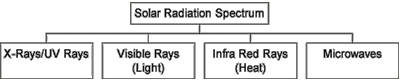
Eye is a scanner which is sensitive only to visible Band of Energy.
When visible Band of Radiation is replaced from an object and reaches eye, we see objects and their colours.
An ordinary camera takes photographs of objects using visible Bands (Blue, Green, Red) and film (Scanner).
In a Satellite, the scanner is an electronic sensor which measures the reflected energies in terms of ‘Grey Scale’. And scanner measures the radiation received in Green, Red, Near infra red and Far infra red Bands.
Grey scale has 256 levels - from 0 to 255.
Every earth feature has its own characteristics with respect to the energies reflected from it in different bands. This is known as Signature characteristic of that object and is equivalent to thump impression or signature of a persons.
Green Vegetation reflects green band and it reflects I.R Band much more.
In Satellite Imageries, various futures / objects can be identified if their signature characteristics are known.
Since the Satellite scanner measures the energies electronically/ digitally, it does not produce a real life photograph.
To make the satellite digital data visual, the green band is depicted with blue colour, Red Band with green colour and IR Band with Red colour. This is called false colour composite (standard F.C.C.)
Since vegetation reflects high amount of I.R. Radiation, and, I.R. Band is depicted with Red colour, hence vegetation normally looks Red in Satellite Imageries. Thus, vegetation in general has Red Signature.
Ground Truth (GT) verification is necessary to identify the signature characteristics of various features / objects.
Classification of the Imageries are done on the basis of Signatures of known objects and computer does the classification.
| Remote Sensing Satellites | [ 900 Km above earth surface [ Sun Synchronous, Polar [ IRS IA, IB, IC , ID [ Photographs the same area once in 22 days (approx) |
From forest vegetation maps (1:250,000) ...
The French Institute of Pondicherry (FIP) has launched in the 1970s a cartographic program for the Western Ghats area. Agreements were signed between the French Institute of Pondicherry and the State Governments of Karnataka, Kerala and Tamil Nadu for the preparation of forest maps at the scale of 1;250,000. These maps depict the actual state of the forests, their environmental conditions (climatic, edaphic, biotic, administrative) and their potentialities. It is obviously based on the experience gained from an earlier mapping programme at the scale of 1:1,000,000 for the whole peninsula. However, the larger scale of 1:250,000 calls for a higher degree of precision. Such an information becomes a base for carrying out new fundamental research concerning the structure, floristic composition and dynamism of the formations, and to serve as help decision making tools to the environment managers.
The 1:250,000 scale cartographic programme consists of 6 vegetation maps (fig.1). Five of which have been published (the reference year for the vegetation cover is given under brackets) :
| Published in | 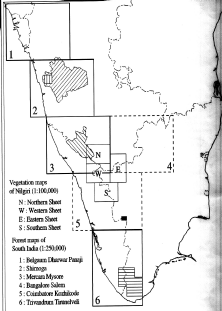 | ||
| Mercara - Mysore | 1984 | (1977) | |
|
Bangalore - Salem |
1982 | (1977) | |
| Coimbatore - Kozhikode | 1982 | (1977) | |
|
Trivandrum - Tirunelveli |
1992 | (1977) | |
| Belgaum-Dharvar Panaji | 2000* | (1989,1992) | |
| Shimoga | 1999 | (1994)* | |
| (to be published) |
This mapping synthesises different types of information. The cartographic synthesis gives particulars on several categories of information:
- Characterisation of different vegetation.
This is done combining phenology, physiognomy and floristic groups which are derived from the characteristic distribution pattern and abundance. Based on these combinations several vegetation types are identified. The major types include evergreen forests, deciduous forests, other wooded formation and plantation. The location and identification of vegetation cover are taken from satellite imagery (Landsat, IRS1C/1D 1:250,000 False Colour Composite enlargements) : a visual interpretation allows delineating different kinds of forest vegetation physiognomy classes, which are checked on the field, using a ground truth method. Simultaneously the floristic characterisation of the climax or related formations is delineated using the reference of 1:500,000 FIP bioclimatic maps. By integrating these two information layers, 134 types have been defined for the Western Ghats area (between Goa and Kanya Kumari).
- Background of streams and water bodies.
This forms part of the physical environment.
- Biotic pressure and administrative
information.
The degradation of forests is mainly related to the intensity of the anthropogenic pressure. Therefore, the FIP vegetation maps include the following information :- The density of the population represented by towns and villages with a population over 1000, represented by symbols proportional to the size of the localities,
- The road network, including the main forest tracks, in order to indicate the accessibility of forests,
- The legal status of the forests, by delineating the territorial division of the forest administration and the protected and reserved forests.
Other recent maps
Specific 1:100,000 maps on
the Nilgiri have been published in 1994 using the same methodology: four
sheets are available at this scale on this area ("Nilgiri biosphere
reserve area, vegetation and land use", R.Prabhakar, J.P. Pascal; 1994;
published by the Centre for Ecological Sciences, Indian Institute of
Sciences – Bangalore and the French Institute of Pondicherry). One
1:100,000 scale map is to be published in the coming months on the
Lingannamaki reservoir area (Karanataka) related to Rain forests, degraded
forests and cultivated areas.
... to Geographic
Databases
Since the creation of the Geomatics Laboratory in 1994,
the FIP started building geographic databases based on the 1:250,000
vegetation maps, using the Arc/Info software package. The scope of the
work consists in facilitating the digital composition of the forest maps,
constituting an evolutive information system and carrying out spatial
analyses and modelling on landscape and forest biodiversity.
Each
map corresponds to a database. The databases contain the following layers
of information : forest vegetation, streams, water bodies, roads and
railways networks, localities over 1000, administrative units (states,
districts), forest units (forest administration units, protected forests).
Each information layer is documented with an encoded attribute table for
the semantic characteristics of various features.
Of these maps,
numbers 1, 2 and 3 which were created using traditional cartographic
methods, are now in digital format. Map number 4 is yet to be digitised.
Map number 6 of this series was published in 1999. This has been created
using GIS potentialities. The geographic database related to map number 5
is now under preparation.
These geographic databases are actually
used by the FIP in the context of specific research programs on a regional
level. It is used in research projects whose scope includes understanding
and modelling the changes of landscape and forest biodiversity in Western
Ghats. In this context the vegetation cover in the Belgaum, Shimoga, and
Mercara databases have been already upgraded, using recent IRS 1C/1D
satellite images (1997). The information is also processed and combined
with other sources of information for modelling environmental indices, for
example, the soil organic carbon tenure has been spatially modelised in
the Shimoga district area by applying a modelC = f(soil, vegetation cover,
climate).
With the aim of enhancing the knowledge on forest biodiversity, the department of Ecology carried out a research programme jointly with the Geomatics laboratory on the distribution of endemics species in Western Ghats : all the information was gathered in a geographic database (location of the endemics species, main forest types limits, bioclimatic zones) and was combined to other ecological descriptions. This work culminated in the publication of an Atlas of the Endemic species in Western Ghats and one interactive CD-Rom application was published in 1997 ("Atlas of Endemics of the Western Ghats, distribution of tree species in the evergreen and semi-evergreen forests", B.R.Ramesh, J.P. Pasal, C. Nouguier, 1997 ; "Endemic tree species of the Western Ghats (India) CD-Rom", R. Datta, C. Nouguier, J.P. Pascal, B.R. Ramesh, 1997).
The vegetation maps and explanatory notices, the Endemics species Atlas and Cd-Rom appplication are available for sale at the French Institute of Pondicherry. The databases are presently not made available outside the FIP, but new research projects can be identified using these information systems.