Results and Discussion
|
Image Fusion: Fusion of multispectral data (Resourcesat 2) and Cartosat (2.7 m) data was done using algorithms - Hyperspectral Color Space resolution (HCS) merge, High Pass Filter (HPF) fusion, Modified Intensity Hue Saturation (MHIS) fusion, Wavelet Fusion. Quality and accuracy of fused data was assessed using UIQI value. All fusion techniques (except wavelets) were heavy intensive process which consumed 12 cores and 36 hrs of times on cloud computing networked systems. The results is given in Figure 9, visually HCS provided better results.
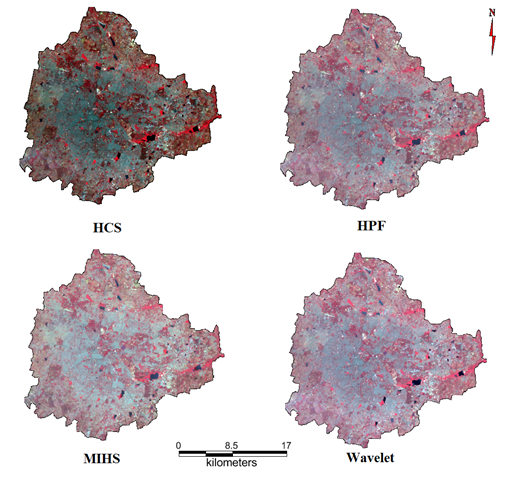
Figure 9: Landscape of Bangalore based on fused remote sensing data
The land use analysis was carried out using HPF fused remote sensing data using the supervised classifier based on Gaussian Maximum Likelihood Classifier (MLC). Categories include two classes - vegetation and non-vegetation (built-up, water bodies, open area, etc.) and is depicted in figure 10. Accuracy assessment show the overall accuracy of 91.5% the kappa of 0.86 indicating higher agreement of the classified data and field data. Results highlight that spatial extent of tree vegetation is 100.02 sq.km. (14.08%).
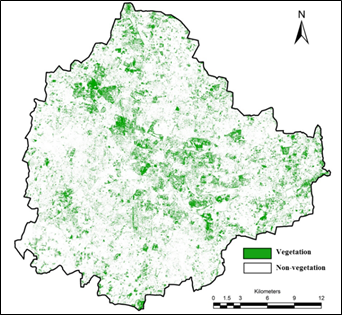
Figure 10: Spatial distribution of vegetation in Bangalore
|
|
Ward Wise |
Gradient Wise |
|
|
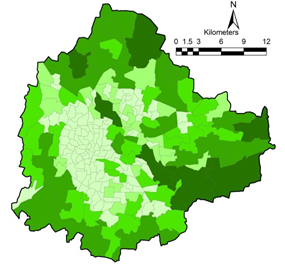
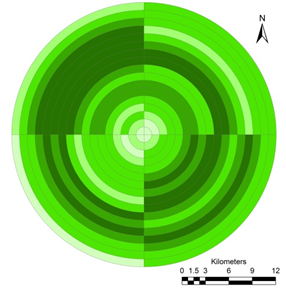
Figure 11: Ward wise spatial extent of vegetation (Hectares)
Tree distribution in wards: Vector layer of wards is overlaid on Figure 10, to extract the vegetation information for each ward. Figure 11 shows the ward wise distribution of vegetation and wardwise tree statistics is included in Annexure II. Spatial extent of vegetation is minimum (less than 1 hectare) in wards such as Chickpete, Shivajinagara, Kempapura agrahara, Padarayanapura, while wards such as Varthur, Bellandur, Agaram have higher vegetation cover (> 300 hectares).
Bangalore was divided into 1km incrementing radii circles (with respect to the central business district) to assess the vegetation gradient. Figure 12 depicts vegetation density in each concentric regions in 1973 and 2013. Figure 12 illustrates the erosion of vegetation during the last 4 decades. Presence of Lalbhag, Cuban park etc. in the core area show higher vegetation density in the respective gradients. Figure 13 illustrates ward wise vegetation density for 2013. The wards such as Hudi, Aramane nagara and Vasantha pura have higher vegetation density of more than 0.4, while Chickpete, Laggere, Hegganahalli, Hongasandra, Padarayanapura have lower density with less than 0.015. Bangalore has an average vegetation density of 0.14.
i.e., Area of Bruhat Bangalore: 741 sq.km
Area under vegetation: 100.20 sq.km
Vegetation Density: 100.02 / 741 = 0.14
|
|
1973 |
2013 |
|
|
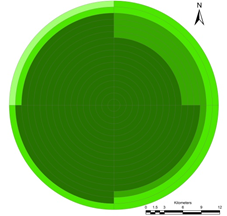
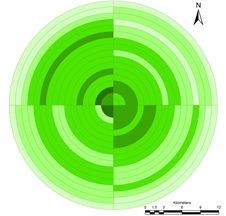
Figure 12: Gradient wise Vegetation density
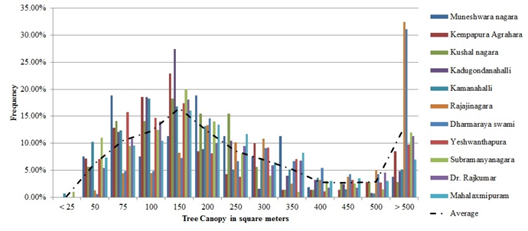
Field data was collected using GPS in select wards, which include tree census with the canopy dimensions. Canopy was also delineated using online Google Earth. This helped in quantifying number of trees based on delineation of canopy from remote sensing data. Figure 15 gives the frequency distribution based on the canopy size for wards i) < 500 trees and ii) > 500 trees.
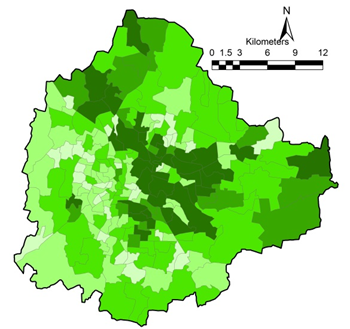
Figure 14: Ward wise vegetation density (2013)
 |
Wards > 500 trees |
|
Wards < 500 trees |
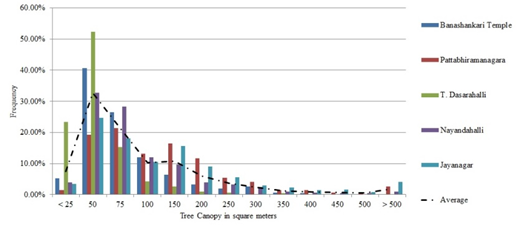
Figure 15: Histogram based on canopy size
|
|
Ward Wise |
Gradient Wise |
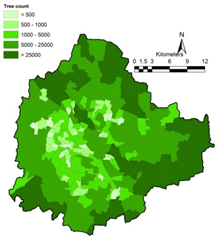
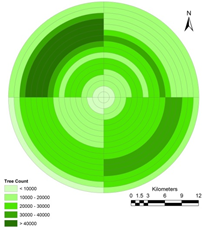
Figure 16: Tree distribution
Based on these, number of trees in each ward are computed. Figure 16 gives the ward wise and gradient wise number of trees. This highlights that wards such as Vathuru, Bellanduru, Agaram, Aramane nagara have the trees greater than 40000 trees, while Chickpete, Padarayanapura, Shivaji nagara, Kempapura Agrahara, Kushal nagara wards have trees less than 100 trees. Based on these, total number of trees in Bangalore is about 14,78,412 trees. Annexure III provides details of prominent trees in Bangalore. Annexure IV is the list of trees compiled from various published literatures.
Validation of tree quantification was done in select wards of Bangalore. Figure 17a gives the tree distribution based on field census and Figure 17b gives the canopy distribution based pattern classifier. Total number of trees as per the census is 22201 and figure 18 gives the frequency distribution of canopy classes. Based on the remote sensing data, IISc campus has canopy cover of 107.85 hectares and number of trees as 22616. This means the accuracy of tree estimation based on canopy delineation using fused remote sensing data of 2.7 m spatial resolution is 97%.
|
|
|
|
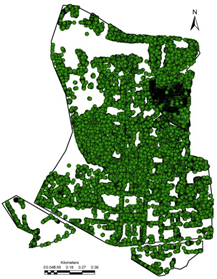
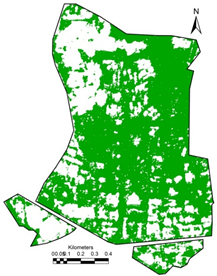
Figure 17: Tree Distribution in Indian Institute of Science campus
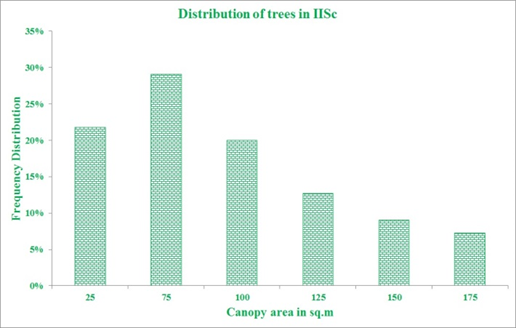
Figure 18: Frequency Distribution based on field measurement
Figure 19 gives ward wise population during 2013 computed considering the growth rate based on the population of 2001 and 2011. This shows wards in the core area of the city have population more than 40000 persons, whereas the wards towards the periphery have population less than 30000.
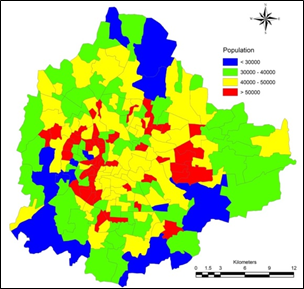
Figure 19: Ward wise population during 2013
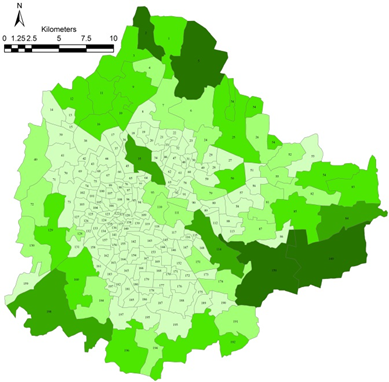
Figure 20: Ward wise tree per person
Figure 20 depicts ward wise trees per person computed considering number of trees and population for the respective ward. This analysis shows that Shivaji nagara, Dayananda nagara, Chickpete, Padarayanapura, Kempapura Agrahara wards have very less number of trees per person (< 0.002). This highlights that these wards have less than 1 tree for every 500 people. Compared to this, wards such as Bellanduru, Jakkuru, Varthuru, Agaram, Aramane nagara have trees more than one per person indicating the presence of one tree for every person.
This shows that Gandhinagar (Gujarat), Nashik(Maharashtra) has more than 1 tree per person, while most of other cities are less than one tree per person. Major cities such as Gandhinagar, Bangalore, Ahmedabad, Brihan Mumbai are with spatial extent greater than 400 sq.km. Gandhinagar has 416 trees for every 100 people followed by Bangalore with 17 trees, Brihan Mumbai with 15 trees and Ahmedabad with 11 trees. Table 4 lists city wise number of trees and trees per person based on published literatures
Table 4: Comparative assessment of trees across different cities
State |
Location |
Population |
Area (Ha) |
Number of Trees |
Tree / person |
Tree / Hectare |
Reference |
Gujarat |
Ahmedabad |
5570590 |
46985 |
617090 |
0.111 |
13.13 |
21 |
Surat |
4462000 |
39549 |
333970 |
0.075 |
8.44 |
21 |
|
Vadodara |
1666700 |
16264 |
747190 |
0.448 |
45.94 |
21 |
|
Gandhinagar |
208300 |
57000 |
866670 |
4.161 |
15.20 |
21 |
|
Rajkot |
1287000 |
10400 |
139520 |
0.108 |
13.42 |
21 |
|
Bhavnagar |
593770 |
5320 |
485950 |
0.818 |
91.34 |
21 |
|
Junagafh |
320250 |
5670 |
76690 |
0.239 |
13.53 |
21 |
|
Jamnagar |
529310 |
3434 |
45880 |
0.087 |
13.36 |
21 |
|
Maharashtra |
Nagpur |
2405421 |
21717 |
2143838 |
0.891 |
98.72 |
22 |
Nashik |
1486973 |
25900 |
2055523 |
1.382 |
79.36 |
22 |
|
Brihan Mumbai |
12478447 |
43771 |
1917844 |
0.154 |
43.82 |
22 |
|
Kalyan* |
472208 |
5198 |
212795 |
0.451 |
40.94 |
22 |
|
Thane |
1818872 |
12700 |
45262 |
0.025 |
3.56 |
22 |
|
Navi Mumbai |
1119477 |
16205 |
478120 |
0.427 |
29.50 |
22 |
|
Nanded |
550564 |
4906 |
101310 |
0.184 |
20.65 |
22 |
|
Mira and Bhayandar |
814655 |
7904 |
150000 |
0.184 |
18.98 |
22 |
|
Karnataka |
Bangalore |
8907175 |
74100 |
1478412 |
0.166 |
19.95 |
calculated |
* Kalyan and Dombivali, combined together has population of 1,246,381 and area of 137.15 sq.km, proportion of area was used to calculate population of Kalyan city