Trees in bangalore
|
Bengaluru / Greater Bangalore / Bruhat Bengaluru / Bangalore (77°37’19.54’’ E and 12°59’09.76’’ N geographically located at the south eastern part of Karnataka state) is the principal administrative, cultural, commercial, industrial, and knowledge capital of the state (fig.1). The city is subdivided 8 zones with 198 wards under the jurisdiction of BBMP. Bangalore is geographically extends from 12o49’5”N to 13o8’32”N and 77o27’29” E to 77o47’2” E encompassing an area of 741 km2. Spatial extent of Bangalore has increased over 10 times between 1949 (69 km2) to 2006 (741 km2) (figure 2) and is the 5th largest metropolis in India (Ramachandra et al, 2012; Sudhira et al., 2007).The population (figure 3) of Bangalore urban (BBMP limits) has increased by 48%, from 5.84millon in 2001(Census, 2001) to 8.64 million (Census, 201) in 2011. The population distribution in past two decades ward wise is as depicted in figure 4.The population density in the region (figure 4) has increased from 7881 persons/km2 (2001) to 11664 persons/km2 (2011).
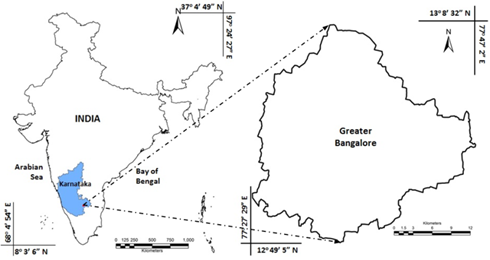
Figure 1: Study area Greater Bangalore / Bengaluru / Bruhat Bengaluru / Bangalore
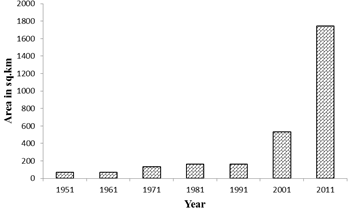
Figure 2: Spatial growth of Bangalore
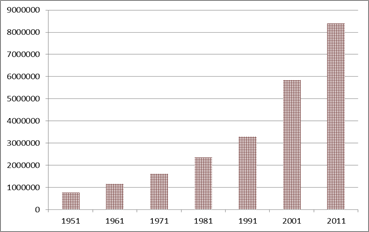
Figure 3: Escalating Population of Bangalore
Figure 4: Ward wise population distribution
The topography (figure 5) of the region is undulating, the altitude varies from about 740 m to over 960 m above mean sea in the region is main cause for formation of large number of drainages and storage tanks. These water bodies and open green spaces are responsible for moderating local climate. Temperature varies from 22 oC to 38 oC during summer and 14 oC to 27 oC in winter. Bangalore receives an annual average rainfall of about 800 mm.
Bengaluru (77°37’19.54’’ E and 12°59’09.76’’ N) is the principal administrative, cultural, commercial, industrial, and knowledge capital of the state of Karnataka. The present name Bengaluru has its origin to ‘benga’, the local term for Pterocarpus marsupium, a species of dry and moist deciduous tree, and ooru, meaning town (Ramachandra and Mujumdar, 2006; Sudha and Ravindranath, 2000). Bengaluru (Bangalore) was known as ‘Garden city of India’ due to its vast green cover, fauna and two nationally recognized botanical gardens - Cubbon Park and Lalbagh. Currently Bangalore is second fastest and fifth largest metropolis in India and has experienced unprecedented expansion of urban area 69 km2 in 1949 to 741 km2 in 2010 (Ramachandra and Kumar, 2010; Ramachandra et al., 2012). Bangalore city population has increased enormously from 6,537,124 (in 2001) to 9,588,910 (in 2011), accounting to decadal growth of 46.68% . Population density has increased from as 10,732 (in 2001) to 13,392 (in 2011) persons per sq. km (Ramachandra et al., 2012). The vegetation of Bangalore was classified as dry deciduous forest-type (Champion and Seth, 1968) under the Terminalia-Anogeissus latifolia-Tectona series ( Puri et al., 1983). The city enjoys the salubrious climate throughout the year.
In the early 17th century, Bangalore comprised natural thorny forests (Kamath 1990). Green vegetation within the Bangalore city was initiated by Hyder Ali, a ruler of Mysore city. He also established Lalbagh with an area cover of 100 hectares as his private garden which is now public garden. Since then the Bangalore city identified as ‘Garden city’. Subsequently in 1831, British further established greening the city with the creation of Cubbon Park (Issar 1998, Iyer et al., 2012).
During the British tenure, park culture was introduced, which was a new perspective to the use of social spaces. The park culture got integrated slowly among Indians, through the elite and educated. For instance, Malleshwaram is one of the oldest area in the city. It has readily adopted the park culture and also retained Indian traditional practices. They started to grow vegetables and fruits in their home gardens and also planted trees along the roads. Some streets in Malleshwaram derived their names from the trees that were grown along the entire stretch like “Sampige” (Michelia champaka) and “Margosa” (Azadirachta indica) roads.
From 1965 onwards, the city began to evolve into a city of small–scale industries. By 1998, it was recognized as IT hub. Bangalore also houses IT and IT based industries and numerous leading commercial and educational institutions, industries like textile, aviation, space, and biotechnology have come up. The immediate consequence of this growth also created pressure on infrastructure and basic amenities like water supply, energy, public transportation, land etc. Large plots and colonial bungalows with home gardens gave way to multi-storied apartment blocks with just small patches of lawn. In terms of natural flora, Bangalore city had 979 species in 542 genera, 133 families (Ramaswamy and Razi, 1973). Due to the rapid unplanned urbanization and urban sprawl, the spatial extent of Bangalore increased from 69 sq.km (1949) to 741 sq. km (2010). Now Bangalore is the fifth largest metropolis in India with a population of about 8.4 million (census, 2011).
Bangalore’s urban vegetation comprises of trees are Alstonia scholaris, Artocarpus heterophyllus (Jack fruit), Azadirachta indica (Neem), Bombax cieba (Red silk cotton), Butea monosperma, Ficus bengalensis (Alada mara), F. religiosa (Ashwatha), Gmelina arborea, Kigelia pinnata (Sausage tree), Lagerstroemia speciosa (Pride of India), Mangifera indica (Mango), Madhuca longifolia (Mehwa or Ippe), Melia composite (Malabar Neem), Michelia champaca, Neolamarkia kadamba (Kadamba), Pongamia pinnata (Honge), Pterocarpus marsupium (Honne), Syzigium cumini (Jaamun), Saraca indica (Seeta Asok), Swetenia sp (Mahogani), Terminalia arjuna (Arjuna), T. bellerica (Tare), Tabebuia spectabilis etc.
Some of the gracious exotic trees found as avenue trees are: Delonix regia (Gulmhur), Enterolobium saman (Rain tree), Parkia biglandulosa (Badminton ball tree), Peltophorum pterocarpum (Coppar pod), Spathodea companulata (African tulip tree), Tabebuia spectabilis, Polythia longifolia etc. Trees have various important roles to play in the ecosystem, few are as listed in Annexure I. In recent years, the increase in vehicular traffic has also increased the Carbon dioxide, Nitrogen, Sulphur dioxide and suspended particulate matter in the environment. Air pollution and reduction in the green vegetation induced the urban heat island effect which results in variation in microclimate.
Bangalore is also known for their lakes which are paradise for ecology. In 1962 Bangalore had 265 water bodies due to the rapid urbanization the water bodies decreased to 98 in 2010. As the city grew over the space and time, inner areas got more crowded and congested (Ramachandra et al., 2012). Road network has increased and also being widened by axing the numerous road trees. Many lakes and tanks were encroached and converted to residential layouts, multi-storey buildings, playgrounds, bus stands etc. and some lakes were used for dumping of municipal solid waste or building debris (Sudhira et al., 2007). It has been observed that about 584% growth in built-up area during the last four decades with the decline of vegetation by 66% and water bodies by 74% (Ramachandra et al., 2012).

Figure 5: Topography
Bangalore is located on a ridge with natural water courses along the three directions of the Vrishabhavaty, Koramangala-Challaghatta (K&C) and Hebbal-Nagavara valley systems. The drainage allows the flows to cauvery through its tributaries Arkavathi (East flowing), Pinakini/Pennar (East Flowing) and Shimsha (West Flowing). The central, northern and eastern portion is undulating with the upland tracts occupied by scrubs, while the low lands occupied by series of tanks formed by embanking the streams along the valley for irrigation purposes. These valleys vary in size from small ponds to large lakes. The southern portion of the land consists of hills that are close together and are surrounded by scrub jungles and forests. Geologically the area consists of Granitic and Gneisses rocks in large scale (Bangalore District Gazetteer, 1981; Sekhar and Mohan, 2009), and other rocks include dykes, dolerites, schist’s. As the city grew over the space and time, inner areas got more crowded and congested. Road network has increased by axing the numerous road trees. Many lakes and tanks were encroached and converted to residential layouts, multi-storey buildings, playgrounds, bus stands etc. and some lakes were used for dumping of municipal solid waste or building debris (Ramachandra et al., 2012; Sudhira et al., 2007).
Land use dynamics: Table 1 and Fig 6 gives an insight to the temporal land use changes. The built-up area has increased from 7.97% in 1973 to 58.33 % in 2012 (Ramachandra et al, 2012a; Ramachandra et al, 2011; Bharath S et al, 2012). The sudden increment in urbanization post 1990’s could be observed due to the industrial revolution towards Peenya, Rajajinagar.
Figure 6: Land use dynamics
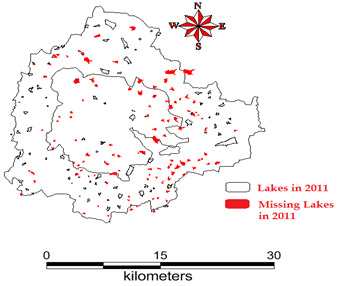
Figure 7: Lakes of Bangalore
Table 1: Temporal Land use dynamics
Class |
Urban |
Vegetation |
Water |
Others |
Year |
Ha |
% |
Ha |
% |
Ha |
% |
Ha |
% |
1973 |
5448 |
7.97 |
46639 |
68.27 |
2324 |
3.4 |
13903 |
20.35 |
1992 |
18650 |
27.3 |
31579 |
46.22 |
1790 |
2.6 |
16303 |
23.86 |
1999 |
24163 |
35.37 |
31272 |
45.77 |
1542 |
2.26 |
11346 |
16.61 |
2006 |
29535 |
43.23 |
19696 |
28.83 |
1073 |
1.57 |
18017 |
26.37 |
2012 |
41570 |
58.33 |
16569 |
23.25 |
665 |
0.93 |
12468 |
17.49 |
Post 2000, due to the evolution of the software sectors led to the large scale land use changes with urbanization at White field, Electronic city, Domlur, Hebbal, due to private players and development of Special Economic Zones. Bangalore, once branded as the Garden city due to dense vegetation cover, which has declined from 68.27% (1973) to less than 25% (2012). Similar to vegetation, Bangalore was also known as city of lakes for numerous lakes that were present (209 lakes). The impact of urbanization has diminished lake bodies (93 lakes as per 2011) (fig 7) and also loss of feeder canals (rajakaluve). The water bodies have reduced from 3.4% (1973) to less than 1% (2012). Other land uses has changed from 20.35% (1973) to 17.49% (2012).
3.0 Objective: Objective of this study is to map trees in Bangalore city (Bruhat Bangalore) and computation of ward wise tree density and trees per person.
|